Free Statistics

of Irreproducible Research!

Author's title

Author*Unverified author*
R Software Modulerwasp_smp.wasp
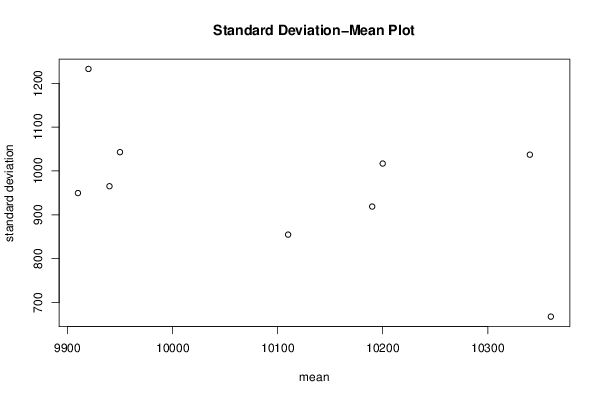
Title produced by softwareStandard Deviation-Mean Plot
Date of computationWed, 14 Aug 2013 10:38:00 -0400
Cite this page as followsStatistical Computations at FreeStatistics.org, Office for Research Development and Education, URL https://freestatistics.org/blog/index.php?v=date/2013/Aug/14/t1376491110bv53euownw08v9r.htm/, Retrieved Sat, 04 May 2024 23:48:28 +0000
Statistical Computations at FreeStatistics.org, Office for Research Development and Education, URL https://freestatistics.org/blog/index.php?pk=211100, Retrieved Sat, 04 May 2024 23:48:28 +0000
QR Codes:

Original text written by user:
IsPrivate?No (this computation is public)
User-defined keywords
Estimated Impact179
Family? (F = Feedback message, R = changed R code, M = changed R Module, P = changed Parameters, D = changed Data)
-     [Histogram] [Stap 2/2] [2013-08-14 13:02:24] [1cfd0014ba435dd2b8f9632cac0a7144]
- RMP   [Harrell-Davis Quantiles] [Stap 6 / 2] [2013-08-14 13:20:36] [9b490dd2ab715f1b5bf65aa31d98df3d]
- RMP       [Standard Deviation-Mean Plot] [Stap 21/2] [2013-08-14 14:38:00] [38a0db91cd47487c7649642dcb33e029] [Current]
Feedback Forum

Post a new message
Dataseries X:
10320
11400
9360
10080
10080
10800
10320
9720
10440
11160
9480
11160
9840
11160
8760
10320
9600
10680
10200
10680
10200
12480
8880
11280
9480
11040
9240
9360
9240
10680
10680
10320
9960
12240
8880
11280
9360
10320
9840
9120
9360
10800
9840
11760
9960
11160
9240
11520
9000
10200
10200
9840
8760
11520
9120
11280
10560
10680
9960
10200
10200
10320
9600
10080
9120
10920
7800
11880
9360
10920
9840
9360
10680
9720
9960
10680
9120
10320
8040
11280
8880
11040
9600
9600
11040
9720
9480
10200
9360
10800
8520
11520
9120
11040
8880
9600
10440
8880
8520
10800
8880
10560
8400
12480
10560
10800
9840
8880


Summary of computational transaction
Raw Inputview raw input (R code)
Raw Outputview raw output of R engine
Computing time2 seconds
R Server'Herman Ole Andreas Wold' @ wold.wessa.net

\begin{tabular}{lllllllll}
\hline
Summary of computational transaction \tabularnewline
Raw Input & view raw input (R code)  \tabularnewline
Raw Output & view raw output of R engine  \tabularnewline
Computing time & 2 seconds \tabularnewline
R Server & 'Herman Ole Andreas Wold' @ wold.wessa.net \tabularnewline
\hline
\end{tabular}
%Source: https://freestatistics.org/blog/index.php?pk=211100&T=0

[TABLE]
[ROW][C]Summary of computational transaction[/C][/ROW]
[ROW][C]Raw Input[/C][C]view raw input (R code) [/C][/ROW]
[ROW][C]Raw Output[/C][C]view raw output of R engine [/C][/ROW]
[ROW][C]Computing time[/C][C]2 seconds[/C][/ROW]
[ROW][C]R Server[/C][C]'Herman Ole Andreas Wold' @ wold.wessa.net[/C][/ROW]
[/TABLE]
Source: https://freestatistics.org/blog/index.php?pk=211100&T=0

Globally Unique Identifier (entire table): ba.freestatistics.org/blog/index.php?pk=211100&T=0

As an alternative you can also use a QR Code:  

The GUIDs for individual cells are displayed in the table below:

Summary of computational transaction
Raw Inputview raw input (R code)
Raw Outputview raw output of R engine
Computing time2 seconds
R Server'Herman Ole Andreas Wold' @ wold.wessa.net


Standard Deviation-Mean Plot
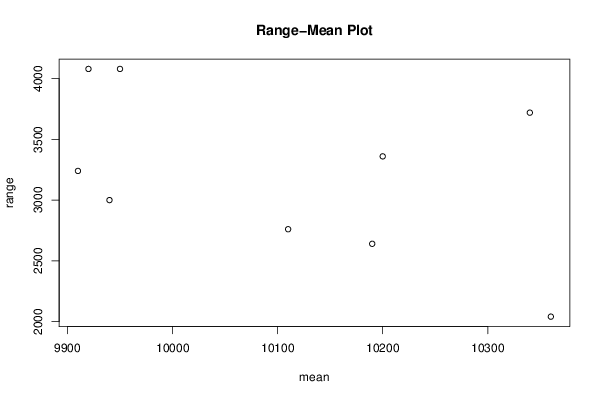
SectionMeanStandard DeviationRange
110360667.8050886026822040
2103401037.128904059843720
3102001016.947303542233360
410190918.8332522577452640
510110854.86841092652760
699501042.950360537574080
79910949.6602263202063240
89940965.2131182471383000
999201232.646819578984080

\begin{tabular}{lllllllll}
\hline
Standard Deviation-Mean Plot \tabularnewline
Section & Mean & Standard Deviation & Range \tabularnewline
1 & 10360 & 667.805088602682 & 2040 \tabularnewline
2 & 10340 & 1037.12890405984 & 3720 \tabularnewline
3 & 10200 & 1016.94730354223 & 3360 \tabularnewline
4 & 10190 & 918.833252257745 & 2640 \tabularnewline
5 & 10110 & 854.8684109265 & 2760 \tabularnewline
6 & 9950 & 1042.95036053757 & 4080 \tabularnewline
7 & 9910 & 949.660226320206 & 3240 \tabularnewline
8 & 9940 & 965.213118247138 & 3000 \tabularnewline
9 & 9920 & 1232.64681957898 & 4080 \tabularnewline
\hline
\end{tabular}
%Source: https://freestatistics.org/blog/index.php?pk=211100&T=1

[TABLE]
[ROW][C]Standard Deviation-Mean Plot[/C][/ROW]
[ROW][C]Section[/C][C]Mean[/C][C]Standard Deviation[/C][C]Range[/C][/ROW]
[ROW][C]1[/C][C]10360[/C][C]667.805088602682[/C][C]2040[/C][/ROW]
[ROW][C]2[/C][C]10340[/C][C]1037.12890405984[/C][C]3720[/C][/ROW]
[ROW][C]3[/C][C]10200[/C][C]1016.94730354223[/C][C]3360[/C][/ROW]
[ROW][C]4[/C][C]10190[/C][C]918.833252257745[/C][C]2640[/C][/ROW]
[ROW][C]5[/C][C]10110[/C][C]854.8684109265[/C][C]2760[/C][/ROW]
[ROW][C]6[/C][C]9950[/C][C]1042.95036053757[/C][C]4080[/C][/ROW]
[ROW][C]7[/C][C]9910[/C][C]949.660226320206[/C][C]3240[/C][/ROW]
[ROW][C]8[/C][C]9940[/C][C]965.213118247138[/C][C]3000[/C][/ROW]
[ROW][C]9[/C][C]9920[/C][C]1232.64681957898[/C][C]4080[/C][/ROW]
[/TABLE]
Source: https://freestatistics.org/blog/index.php?pk=211100&T=1

Globally Unique Identifier (entire table): ba.freestatistics.org/blog/index.php?pk=211100&T=1

As an alternative you can also use a QR Code:  

The GUIDs for individual cells are displayed in the table below:

Standard Deviation-Mean Plot
SectionMeanStandard DeviationRange
110360667.8050886026822040
2103401037.128904059843720
3102001016.947303542233360
410190918.8332522577452640
510110854.86841092652760
699501042.950360537574080
79910949.6602263202063240
89940965.2131182471383000
999201232.646819578984080


Regression: S.E.(k) = alpha + beta * Mean(k)
alpha5512.36828891924
beta-0.450123857415313
S.D.0.273143876965763
T-STAT-1.64793683979134
p-value0.14335661277268

\begin{tabular}{lllllllll}
\hline
Regression: S.E.(k) = alpha + beta * Mean(k) \tabularnewline
alpha & 5512.36828891924 \tabularnewline
beta & -0.450123857415313 \tabularnewline
S.D. & 0.273143876965763 \tabularnewline
T-STAT & -1.64793683979134 \tabularnewline
p-value & 0.14335661277268 \tabularnewline
\hline
\end{tabular}
%Source: https://freestatistics.org/blog/index.php?pk=211100&T=2

[TABLE]
[ROW][C]Regression: S.E.(k) = alpha + beta * Mean(k)[/C][/ROW]
[ROW][C]alpha[/C][C]5512.36828891924[/C][/ROW]
[ROW][C]beta[/C][C]-0.450123857415313[/C][/ROW]
[ROW][C]S.D.[/C][C]0.273143876965763[/C][/ROW]
[ROW][C]T-STAT[/C][C]-1.64793683979134[/C][/ROW]
[ROW][C]p-value[/C][C]0.14335661277268[/C][/ROW]
[/TABLE]
Source: https://freestatistics.org/blog/index.php?pk=211100&T=2

Globally Unique Identifier (entire table): ba.freestatistics.org/blog/index.php?pk=211100&T=2

As an alternative you can also use a QR Code:  

The GUIDs for individual cells are displayed in the table below:

Regression: S.E.(k) = alpha + beta * Mean(k)
alpha5512.36828891924
beta-0.450123857415313
S.D.0.273143876965763
T-STAT-1.64793683979134
p-value0.14335661277268


Regression: ln S.E.(k) = alpha + beta * ln Mean(k)
alpha53.9488005671041
beta-5.10701635515197
S.D.2.99511661696258
T-STAT-1.70511436056574
p-value0.131944086656246
Lambda6.10701635515197

\begin{tabular}{lllllllll}
\hline
Regression: ln S.E.(k) = alpha + beta * ln Mean(k) \tabularnewline
alpha & 53.9488005671041 \tabularnewline
beta & -5.10701635515197 \tabularnewline
S.D. & 2.99511661696258 \tabularnewline
T-STAT & -1.70511436056574 \tabularnewline
p-value & 0.131944086656246 \tabularnewline
Lambda & 6.10701635515197 \tabularnewline
\hline
\end{tabular}
%Source: https://freestatistics.org/blog/index.php?pk=211100&T=3

[TABLE]
[ROW][C]Regression: ln S.E.(k) = alpha + beta * ln Mean(k)[/C][/ROW]
[ROW][C]alpha[/C][C]53.9488005671041[/C][/ROW]
[ROW][C]beta[/C][C]-5.10701635515197[/C][/ROW]
[ROW][C]S.D.[/C][C]2.99511661696258[/C][/ROW]
[ROW][C]T-STAT[/C][C]-1.70511436056574[/C][/ROW]
[ROW][C]p-value[/C][C]0.131944086656246[/C][/ROW]
[ROW][C]Lambda[/C][C]6.10701635515197[/C][/ROW]
[/TABLE]
Source: https://freestatistics.org/blog/index.php?pk=211100&T=3

Globally Unique Identifier (entire table): ba.freestatistics.org/blog/index.php?pk=211100&T=3

As an alternative you can also use a QR Code:  

The GUIDs for individual cells are displayed in the table below:

Regression: ln S.E.(k) = alpha + beta * ln Mean(k)
alpha53.9488005671041
beta-5.10701635515197
S.D.2.99511661696258
T-STAT-1.70511436056574
p-value0.131944086656246
Lambda6.10701635515197


Parameters (Session):
par1 = 48 ; par2 = 1 ; par3 = 0 ; par4 = 0 ; par5 = 12 ; par6 = White Noise ; par7 = 0.95 ;
Parameters (R input):
par1 = 12 ;
R code (references can be found in the software module):
par1 <- as.numeric(par1)
(n <- length(x))
(np <- floor(n / par1))
arr <- array(NA,dim=c(par1,np))
j <- 0
k <- 1
for (i in 1:(np*par1))
{
j = j + 1
arr[j,k] <- x[i]
if (j == par1) {
j = 0
k=k+1
}
}
arr
arr.mean <- array(NA,dim=np)
arr.sd <- array(NA,dim=np)
arr.range <- array(NA,dim=np)
for (j in 1:np)
{
arr.mean[j] <- mean(arr[,j],na.rm=TRUE)
arr.sd[j] <- sd(arr[,j],na.rm=TRUE)
arr.range[j] <- max(arr[,j],na.rm=TRUE) - min(arr[,j],na.rm=TRUE)
}
arr.mean
arr.sd
arr.range
(lm1 <- lm(arr.sd~arr.mean))
(lnlm1 <- lm(log(arr.sd)~log(arr.mean)))
(lm2 <- lm(arr.range~arr.mean))
bitmap(file='test1.png')
plot(arr.mean,arr.sd,main='Standard Deviation-Mean Plot',xlab='mean',ylab='standard deviation')
dev.off()
bitmap(file='test2.png')
plot(arr.mean,arr.range,main='Range-Mean Plot',xlab='mean',ylab='range')
dev.off()
load(file='createtable')
a<-table.start()
a<-table.row.start(a)
a<-table.element(a,'Standard Deviation-Mean Plot',4,TRUE)
a<-table.row.end(a)
a<-table.row.start(a)
a<-table.element(a,'Section',header=TRUE)
a<-table.element(a,'Mean',header=TRUE)
a<-table.element(a,'Standard Deviation',header=TRUE)
a<-table.element(a,'Range',header=TRUE)
a<-table.row.end(a)
for (j in 1:np) {
a<-table.row.start(a)
a<-table.element(a,j,header=TRUE)
a<-table.element(a,arr.mean[j])
a<-table.element(a,arr.sd[j] )
a<-table.element(a,arr.range[j] )
a<-table.row.end(a)
}
a<-table.end(a)
table.save(a,file='mytable.tab')
a<-table.start()
a<-table.row.start(a)
a<-table.element(a,'Regression: S.E.(k) = alpha + beta * Mean(k)',2,TRUE)
a<-table.row.end(a)
a<-table.row.start(a)
a<-table.element(a,'alpha',header=TRUE)
a<-table.element(a,lm1$coefficients[[1]])
a<-table.row.end(a)
a<-table.row.start(a)
a<-table.element(a,'beta',header=TRUE)
a<-table.element(a,lm1$coefficients[[2]])
a<-table.row.end(a)
a<-table.row.start(a)
a<-table.element(a,'S.D.',header=TRUE)
a<-table.element(a,summary(lm1)$coefficients[2,2])
a<-table.row.end(a)
a<-table.row.start(a)
a<-table.element(a,'T-STAT',header=TRUE)
a<-table.element(a,summary(lm1)$coefficients[2,3])
a<-table.row.end(a)
a<-table.row.start(a)
a<-table.element(a,'p-value',header=TRUE)
a<-table.element(a,summary(lm1)$coefficients[2,4])
a<-table.row.end(a)
a<-table.end(a)
table.save(a,file='mytable1.tab')
a<-table.start()
a<-table.row.start(a)
a<-table.element(a,'Regression: ln S.E.(k) = alpha + beta * ln Mean(k)',2,TRUE)
a<-table.row.end(a)
a<-table.row.start(a)
a<-table.element(a,'alpha',header=TRUE)
a<-table.element(a,lnlm1$coefficients[[1]])
a<-table.row.end(a)
a<-table.row.start(a)
a<-table.element(a,'beta',header=TRUE)
a<-table.element(a,lnlm1$coefficients[[2]])
a<-table.row.end(a)
a<-table.row.start(a)
a<-table.element(a,'S.D.',header=TRUE)
a<-table.element(a,summary(lnlm1)$coefficients[2,2])
a<-table.row.end(a)
a<-table.row.start(a)
a<-table.element(a,'T-STAT',header=TRUE)
a<-table.element(a,summary(lnlm1)$coefficients[2,3])
a<-table.row.end(a)
a<-table.row.start(a)
a<-table.element(a,'p-value',header=TRUE)
a<-table.element(a,summary(lnlm1)$coefficients[2,4])
a<-table.row.end(a)
a<-table.row.start(a)
a<-table.element(a,'Lambda',header=TRUE)
a<-table.element(a,1-lnlm1$coefficients[[2]])
a<-table.row.end(a)
a<-table.end(a)
table.save(a,file='mytable2.tab')