Free Statistics

of Irreproducible Research!

Author's title

Author*Unverified author*
R Software Modulerwasp_autocorrelation.wasp
Title produced by software(Partial) Autocorrelation Function
Date of computationTue, 20 Aug 2013 02:44:10 -0400
Cite this page as followsStatistical Computations at FreeStatistics.org, Office for Research Development and Education, URL https://freestatistics.org/blog/index.php?v=date/2013/Aug/20/t1376981073omoni8xchuwx0r9.htm/, Retrieved Sat, 27 Apr 2024 07:21:25 +0000
Statistical Computations at FreeStatistics.org, Office for Research Development and Education, URL https://freestatistics.org/blog/index.php?pk=211232, Retrieved Sat, 27 Apr 2024 07:21:25 +0000
QR Codes:

Original text written by user:
IsPrivate?No (this computation is public)
User-defined keywordsJespers Eva
Estimated Impact97
Family? (F = Feedback message, R = changed R code, M = changed R Module, P = changed Parameters, D = changed Data)
-       [(Partial) Autocorrelation Function] [Tijdreeks B - Sta...] [2013-08-20 06:44:10] [987ccabfb1247e6edeac48c68eb55107] [Current]
Feedback Forum

Post a new message
Dataseries X:
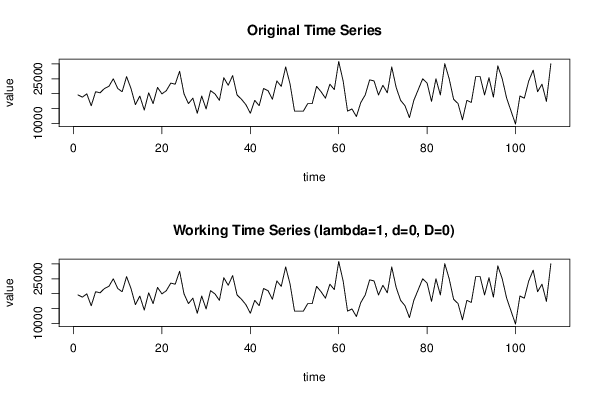
19569
18844
19931
15945
20656
20293
21743
22468
25005
21743
20656
25729
21743
16307
19206
14495
20293
16669
22105
19931
21018
23555
23193
27541
19931
16669
18481
13408
19206
14857
21018
19931
17757
25367
22830
26092
19569
18119
16307
13408
17757
15945
21743
21018
18119
24280
22468
28991
23193
14133
14133
14133
16669
16669
22468
20656
18481
23193
21381
30803
24280
14133
14857
12321
17032
19569
24642
24280
19569
22830
20293
28991
22105
17757
15945
11958
17757
21381
25005
23555
17394
25005
19569
30078
25005
18119
16669
11233
17757
17032
25729
25729
19569
25367
18844
29353
25005
18481
14133
9784
19206
18481
24280
27904
20656
23193
17394
30078


Summary of computational transaction
Raw Inputview raw input (R code)
Raw Outputview raw output of R engine
Computing time3 seconds
R Server'George Udny Yule' @ yule.wessa.net

\begin{tabular}{lllllllll}
\hline
Summary of computational transaction \tabularnewline
Raw Input & view raw input (R code)  \tabularnewline
Raw Output & view raw output of R engine  \tabularnewline
Computing time & 3 seconds \tabularnewline
R Server & 'George Udny Yule' @ yule.wessa.net \tabularnewline
\hline
\end{tabular}
%Source: https://freestatistics.org/blog/index.php?pk=211232&T=0

[TABLE]
[ROW][C]Summary of computational transaction[/C][/ROW]
[ROW][C]Raw Input[/C][C]view raw input (R code) [/C][/ROW]
[ROW][C]Raw Output[/C][C]view raw output of R engine [/C][/ROW]
[ROW][C]Computing time[/C][C]3 seconds[/C][/ROW]
[ROW][C]R Server[/C][C]'George Udny Yule' @ yule.wessa.net[/C][/ROW]
[/TABLE]
Source: https://freestatistics.org/blog/index.php?pk=211232&T=0

Globally Unique Identifier (entire table): ba.freestatistics.org/blog/index.php?pk=211232&T=0

As an alternative you can also use a QR Code:  

The GUIDs for individual cells are displayed in the table below:

Summary of computational transaction
Raw Inputview raw input (R code)
Raw Outputview raw output of R engine
Computing time3 seconds
R Server'George Udny Yule' @ yule.wessa.net


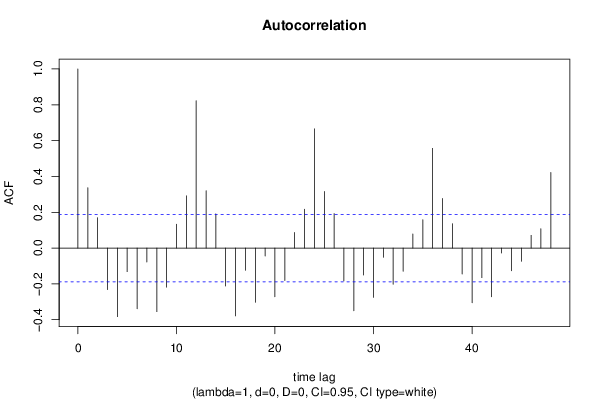
Autocorrelation Function
Time lag kACF(k)T-STATP-value
10.3366753.49880.00034
20.1690651.7570.040878
3-0.231794-2.40890.008847
4-0.382792-3.97816.3e-05
5-0.131518-1.36680.087266
6-0.338566-3.51850.000318
7-0.077447-0.80490.211336
8-0.354638-3.68550.000179
9-0.217903-2.26450.01277
100.1332671.3850.08446
110.2916483.03090.001526
120.822228.54480
130.3196713.32210.00061
140.1908011.98290.024961
15-0.211972-2.20290.014864
16-0.378633-3.93497.4e-05
17-0.123438-1.28280.101154
18-0.302502-3.14370.001077
19-0.043997-0.45720.324211
20-0.271732-2.82390.002825
21-0.181086-1.88190.031271
220.0873610.90790.182982
230.2164932.24990.013243
240.6656666.91780
250.3163833.28790.000681
260.1924682.00020.023995
27-0.183057-1.90240.029892
28-0.350361-3.64110.000209
29-0.14992-1.5580.061078
30-0.275069-2.85860.002554
31-0.051089-0.53090.298278
32-0.20154-2.09450.019279
33-0.12951-1.34590.090575
340.0787910.81880.207346
350.1585921.64810.051116
360.5565235.78360
370.2772812.88160.002387
380.1359261.41260.080326
39-0.145189-1.50890.067128
40-0.30543-3.17410.000979
41-0.164866-1.71330.04476
42-0.271746-2.82410.002824
43-0.027708-0.2880.386967
44-0.126252-1.31210.096142
45-0.07365-0.76540.222852
460.0708930.73670.231437
470.1083581.12610.131313
480.422184.38741.3e-05

\begin{tabular}{lllllllll}
\hline
Autocorrelation Function \tabularnewline
Time lag k & ACF(k) & T-STAT & P-value \tabularnewline
1 & 0.336675 & 3.4988 & 0.00034 \tabularnewline
2 & 0.169065 & 1.757 & 0.040878 \tabularnewline
3 & -0.231794 & -2.4089 & 0.008847 \tabularnewline
4 & -0.382792 & -3.9781 & 6.3e-05 \tabularnewline
5 & -0.131518 & -1.3668 & 0.087266 \tabularnewline
6 & -0.338566 & -3.5185 & 0.000318 \tabularnewline
7 & -0.077447 & -0.8049 & 0.211336 \tabularnewline
8 & -0.354638 & -3.6855 & 0.000179 \tabularnewline
9 & -0.217903 & -2.2645 & 0.01277 \tabularnewline
10 & 0.133267 & 1.385 & 0.08446 \tabularnewline
11 & 0.291648 & 3.0309 & 0.001526 \tabularnewline
12 & 0.82222 & 8.5448 & 0 \tabularnewline
13 & 0.319671 & 3.3221 & 0.00061 \tabularnewline
14 & 0.190801 & 1.9829 & 0.024961 \tabularnewline
15 & -0.211972 & -2.2029 & 0.014864 \tabularnewline
16 & -0.378633 & -3.9349 & 7.4e-05 \tabularnewline
17 & -0.123438 & -1.2828 & 0.101154 \tabularnewline
18 & -0.302502 & -3.1437 & 0.001077 \tabularnewline
19 & -0.043997 & -0.4572 & 0.324211 \tabularnewline
20 & -0.271732 & -2.8239 & 0.002825 \tabularnewline
21 & -0.181086 & -1.8819 & 0.031271 \tabularnewline
22 & 0.087361 & 0.9079 & 0.182982 \tabularnewline
23 & 0.216493 & 2.2499 & 0.013243 \tabularnewline
24 & 0.665666 & 6.9178 & 0 \tabularnewline
25 & 0.316383 & 3.2879 & 0.000681 \tabularnewline
26 & 0.192468 & 2.0002 & 0.023995 \tabularnewline
27 & -0.183057 & -1.9024 & 0.029892 \tabularnewline
28 & -0.350361 & -3.6411 & 0.000209 \tabularnewline
29 & -0.14992 & -1.558 & 0.061078 \tabularnewline
30 & -0.275069 & -2.8586 & 0.002554 \tabularnewline
31 & -0.051089 & -0.5309 & 0.298278 \tabularnewline
32 & -0.20154 & -2.0945 & 0.019279 \tabularnewline
33 & -0.12951 & -1.3459 & 0.090575 \tabularnewline
34 & 0.078791 & 0.8188 & 0.207346 \tabularnewline
35 & 0.158592 & 1.6481 & 0.051116 \tabularnewline
36 & 0.556523 & 5.7836 & 0 \tabularnewline
37 & 0.277281 & 2.8816 & 0.002387 \tabularnewline
38 & 0.135926 & 1.4126 & 0.080326 \tabularnewline
39 & -0.145189 & -1.5089 & 0.067128 \tabularnewline
40 & -0.30543 & -3.1741 & 0.000979 \tabularnewline
41 & -0.164866 & -1.7133 & 0.04476 \tabularnewline
42 & -0.271746 & -2.8241 & 0.002824 \tabularnewline
43 & -0.027708 & -0.288 & 0.386967 \tabularnewline
44 & -0.126252 & -1.3121 & 0.096142 \tabularnewline
45 & -0.07365 & -0.7654 & 0.222852 \tabularnewline
46 & 0.070893 & 0.7367 & 0.231437 \tabularnewline
47 & 0.108358 & 1.1261 & 0.131313 \tabularnewline
48 & 0.42218 & 4.3874 & 1.3e-05 \tabularnewline
\hline
\end{tabular}
%Source: https://freestatistics.org/blog/index.php?pk=211232&T=1

[TABLE]
[ROW][C]Autocorrelation Function[/C][/ROW]
[ROW][C]Time lag k[/C][C]ACF(k)[/C][C]T-STAT[/C][C]P-value[/C][/ROW]
[ROW][C]1[/C][C]0.336675[/C][C]3.4988[/C][C]0.00034[/C][/ROW]
[ROW][C]2[/C][C]0.169065[/C][C]1.757[/C][C]0.040878[/C][/ROW]
[ROW][C]3[/C][C]-0.231794[/C][C]-2.4089[/C][C]0.008847[/C][/ROW]
[ROW][C]4[/C][C]-0.382792[/C][C]-3.9781[/C][C]6.3e-05[/C][/ROW]
[ROW][C]5[/C][C]-0.131518[/C][C]-1.3668[/C][C]0.087266[/C][/ROW]
[ROW][C]6[/C][C]-0.338566[/C][C]-3.5185[/C][C]0.000318[/C][/ROW]
[ROW][C]7[/C][C]-0.077447[/C][C]-0.8049[/C][C]0.211336[/C][/ROW]
[ROW][C]8[/C][C]-0.354638[/C][C]-3.6855[/C][C]0.000179[/C][/ROW]
[ROW][C]9[/C][C]-0.217903[/C][C]-2.2645[/C][C]0.01277[/C][/ROW]
[ROW][C]10[/C][C]0.133267[/C][C]1.385[/C][C]0.08446[/C][/ROW]
[ROW][C]11[/C][C]0.291648[/C][C]3.0309[/C][C]0.001526[/C][/ROW]
[ROW][C]12[/C][C]0.82222[/C][C]8.5448[/C][C]0[/C][/ROW]
[ROW][C]13[/C][C]0.319671[/C][C]3.3221[/C][C]0.00061[/C][/ROW]
[ROW][C]14[/C][C]0.190801[/C][C]1.9829[/C][C]0.024961[/C][/ROW]
[ROW][C]15[/C][C]-0.211972[/C][C]-2.2029[/C][C]0.014864[/C][/ROW]
[ROW][C]16[/C][C]-0.378633[/C][C]-3.9349[/C][C]7.4e-05[/C][/ROW]
[ROW][C]17[/C][C]-0.123438[/C][C]-1.2828[/C][C]0.101154[/C][/ROW]
[ROW][C]18[/C][C]-0.302502[/C][C]-3.1437[/C][C]0.001077[/C][/ROW]
[ROW][C]19[/C][C]-0.043997[/C][C]-0.4572[/C][C]0.324211[/C][/ROW]
[ROW][C]20[/C][C]-0.271732[/C][C]-2.8239[/C][C]0.002825[/C][/ROW]
[ROW][C]21[/C][C]-0.181086[/C][C]-1.8819[/C][C]0.031271[/C][/ROW]
[ROW][C]22[/C][C]0.087361[/C][C]0.9079[/C][C]0.182982[/C][/ROW]
[ROW][C]23[/C][C]0.216493[/C][C]2.2499[/C][C]0.013243[/C][/ROW]
[ROW][C]24[/C][C]0.665666[/C][C]6.9178[/C][C]0[/C][/ROW]
[ROW][C]25[/C][C]0.316383[/C][C]3.2879[/C][C]0.000681[/C][/ROW]
[ROW][C]26[/C][C]0.192468[/C][C]2.0002[/C][C]0.023995[/C][/ROW]
[ROW][C]27[/C][C]-0.183057[/C][C]-1.9024[/C][C]0.029892[/C][/ROW]
[ROW][C]28[/C][C]-0.350361[/C][C]-3.6411[/C][C]0.000209[/C][/ROW]
[ROW][C]29[/C][C]-0.14992[/C][C]-1.558[/C][C]0.061078[/C][/ROW]
[ROW][C]30[/C][C]-0.275069[/C][C]-2.8586[/C][C]0.002554[/C][/ROW]
[ROW][C]31[/C][C]-0.051089[/C][C]-0.5309[/C][C]0.298278[/C][/ROW]
[ROW][C]32[/C][C]-0.20154[/C][C]-2.0945[/C][C]0.019279[/C][/ROW]
[ROW][C]33[/C][C]-0.12951[/C][C]-1.3459[/C][C]0.090575[/C][/ROW]
[ROW][C]34[/C][C]0.078791[/C][C]0.8188[/C][C]0.207346[/C][/ROW]
[ROW][C]35[/C][C]0.158592[/C][C]1.6481[/C][C]0.051116[/C][/ROW]
[ROW][C]36[/C][C]0.556523[/C][C]5.7836[/C][C]0[/C][/ROW]
[ROW][C]37[/C][C]0.277281[/C][C]2.8816[/C][C]0.002387[/C][/ROW]
[ROW][C]38[/C][C]0.135926[/C][C]1.4126[/C][C]0.080326[/C][/ROW]
[ROW][C]39[/C][C]-0.145189[/C][C]-1.5089[/C][C]0.067128[/C][/ROW]
[ROW][C]40[/C][C]-0.30543[/C][C]-3.1741[/C][C]0.000979[/C][/ROW]
[ROW][C]41[/C][C]-0.164866[/C][C]-1.7133[/C][C]0.04476[/C][/ROW]
[ROW][C]42[/C][C]-0.271746[/C][C]-2.8241[/C][C]0.002824[/C][/ROW]
[ROW][C]43[/C][C]-0.027708[/C][C]-0.288[/C][C]0.386967[/C][/ROW]
[ROW][C]44[/C][C]-0.126252[/C][C]-1.3121[/C][C]0.096142[/C][/ROW]
[ROW][C]45[/C][C]-0.07365[/C][C]-0.7654[/C][C]0.222852[/C][/ROW]
[ROW][C]46[/C][C]0.070893[/C][C]0.7367[/C][C]0.231437[/C][/ROW]
[ROW][C]47[/C][C]0.108358[/C][C]1.1261[/C][C]0.131313[/C][/ROW]
[ROW][C]48[/C][C]0.42218[/C][C]4.3874[/C][C]1.3e-05[/C][/ROW]
[/TABLE]
Source: https://freestatistics.org/blog/index.php?pk=211232&T=1

Globally Unique Identifier (entire table): ba.freestatistics.org/blog/index.php?pk=211232&T=1

As an alternative you can also use a QR Code:  

The GUIDs for individual cells are displayed in the table below:

Autocorrelation Function
Time lag kACF(k)T-STATP-value
10.3366753.49880.00034
20.1690651.7570.040878
3-0.231794-2.40890.008847
4-0.382792-3.97816.3e-05
5-0.131518-1.36680.087266
6-0.338566-3.51850.000318
7-0.077447-0.80490.211336
8-0.354638-3.68550.000179
9-0.217903-2.26450.01277
100.1332671.3850.08446
110.2916483.03090.001526
120.822228.54480
130.3196713.32210.00061
140.1908011.98290.024961
15-0.211972-2.20290.014864
16-0.378633-3.93497.4e-05
17-0.123438-1.28280.101154
18-0.302502-3.14370.001077
19-0.043997-0.45720.324211
20-0.271732-2.82390.002825
21-0.181086-1.88190.031271
220.0873610.90790.182982
230.2164932.24990.013243
240.6656666.91780
250.3163833.28790.000681
260.1924682.00020.023995
27-0.183057-1.90240.029892
28-0.350361-3.64110.000209
29-0.14992-1.5580.061078
30-0.275069-2.85860.002554
31-0.051089-0.53090.298278
32-0.20154-2.09450.019279
33-0.12951-1.34590.090575
340.0787910.81880.207346
350.1585921.64810.051116
360.5565235.78360
370.2772812.88160.002387
380.1359261.41260.080326
39-0.145189-1.50890.067128
40-0.30543-3.17410.000979
41-0.164866-1.71330.04476
42-0.271746-2.82410.002824
43-0.027708-0.2880.386967
44-0.126252-1.31210.096142
45-0.07365-0.76540.222852
460.0708930.73670.231437
470.1083581.12610.131313
480.422184.38741.3e-05


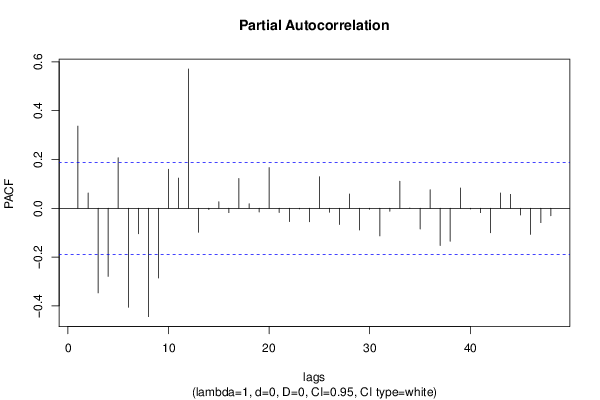
Partial Autocorrelation Function
Time lag kPACF(k)T-STATP-value
10.3366753.49880.00034
20.0628380.6530.257562
3-0.34682-3.60430.000238
4-0.279261-2.90220.002246
50.207082.1520.016811
6-0.405732-4.21652.6e-05
7-0.104231-1.08320.140565
8-0.444307-4.61745e-06
9-0.286203-2.97430.001811
100.1599951.66270.049634
110.1236451.2850.100778
120.5711145.93520
13-0.098601-1.02470.1539
14-0.005221-0.05430.478414
150.0266890.27740.391017
16-0.01788-0.18580.426468
170.1220091.2680.103771
180.0186910.19420.423176
19-0.015147-0.15740.437608
200.1667051.73240.043024
21-0.017058-0.17730.429814
22-0.054645-0.56790.285645
23-0.00262-0.02720.489165
24-0.055499-0.57680.282648
250.1294721.34550.090639
26-0.016428-0.17070.432381
27-0.066874-0.6950.24428
280.0585440.60840.272098
29-0.089155-0.92650.178118
30-0.003809-0.03960.484249
31-0.113297-1.17740.12081
32-0.012474-0.12960.448549
330.110461.14790.126767
340.0012610.01310.494784
35-0.085363-0.88710.188493
360.0758570.78830.216116
37-0.152458-1.58440.058015
38-0.135013-1.40310.081728
390.0832810.86550.194346
40-0.003353-0.03480.486133
41-0.017936-0.18640.426241
42-0.100252-1.04180.149905
430.0626430.6510.258212
440.0569030.59140.27776
45-0.027346-0.28420.388404
46-0.10696-1.11160.134397
47-0.058944-0.61260.270726
48-0.030857-0.32070.37454

\begin{tabular}{lllllllll}
\hline
Partial Autocorrelation Function \tabularnewline
Time lag k & PACF(k) & T-STAT & P-value \tabularnewline
1 & 0.336675 & 3.4988 & 0.00034 \tabularnewline
2 & 0.062838 & 0.653 & 0.257562 \tabularnewline
3 & -0.34682 & -3.6043 & 0.000238 \tabularnewline
4 & -0.279261 & -2.9022 & 0.002246 \tabularnewline
5 & 0.20708 & 2.152 & 0.016811 \tabularnewline
6 & -0.405732 & -4.2165 & 2.6e-05 \tabularnewline
7 & -0.104231 & -1.0832 & 0.140565 \tabularnewline
8 & -0.444307 & -4.6174 & 5e-06 \tabularnewline
9 & -0.286203 & -2.9743 & 0.001811 \tabularnewline
10 & 0.159995 & 1.6627 & 0.049634 \tabularnewline
11 & 0.123645 & 1.285 & 0.100778 \tabularnewline
12 & 0.571114 & 5.9352 & 0 \tabularnewline
13 & -0.098601 & -1.0247 & 0.1539 \tabularnewline
14 & -0.005221 & -0.0543 & 0.478414 \tabularnewline
15 & 0.026689 & 0.2774 & 0.391017 \tabularnewline
16 & -0.01788 & -0.1858 & 0.426468 \tabularnewline
17 & 0.122009 & 1.268 & 0.103771 \tabularnewline
18 & 0.018691 & 0.1942 & 0.423176 \tabularnewline
19 & -0.015147 & -0.1574 & 0.437608 \tabularnewline
20 & 0.166705 & 1.7324 & 0.043024 \tabularnewline
21 & -0.017058 & -0.1773 & 0.429814 \tabularnewline
22 & -0.054645 & -0.5679 & 0.285645 \tabularnewline
23 & -0.00262 & -0.0272 & 0.489165 \tabularnewline
24 & -0.055499 & -0.5768 & 0.282648 \tabularnewline
25 & 0.129472 & 1.3455 & 0.090639 \tabularnewline
26 & -0.016428 & -0.1707 & 0.432381 \tabularnewline
27 & -0.066874 & -0.695 & 0.24428 \tabularnewline
28 & 0.058544 & 0.6084 & 0.272098 \tabularnewline
29 & -0.089155 & -0.9265 & 0.178118 \tabularnewline
30 & -0.003809 & -0.0396 & 0.484249 \tabularnewline
31 & -0.113297 & -1.1774 & 0.12081 \tabularnewline
32 & -0.012474 & -0.1296 & 0.448549 \tabularnewline
33 & 0.11046 & 1.1479 & 0.126767 \tabularnewline
34 & 0.001261 & 0.0131 & 0.494784 \tabularnewline
35 & -0.085363 & -0.8871 & 0.188493 \tabularnewline
36 & 0.075857 & 0.7883 & 0.216116 \tabularnewline
37 & -0.152458 & -1.5844 & 0.058015 \tabularnewline
38 & -0.135013 & -1.4031 & 0.081728 \tabularnewline
39 & 0.083281 & 0.8655 & 0.194346 \tabularnewline
40 & -0.003353 & -0.0348 & 0.486133 \tabularnewline
41 & -0.017936 & -0.1864 & 0.426241 \tabularnewline
42 & -0.100252 & -1.0418 & 0.149905 \tabularnewline
43 & 0.062643 & 0.651 & 0.258212 \tabularnewline
44 & 0.056903 & 0.5914 & 0.27776 \tabularnewline
45 & -0.027346 & -0.2842 & 0.388404 \tabularnewline
46 & -0.10696 & -1.1116 & 0.134397 \tabularnewline
47 & -0.058944 & -0.6126 & 0.270726 \tabularnewline
48 & -0.030857 & -0.3207 & 0.37454 \tabularnewline
\hline
\end{tabular}
%Source: https://freestatistics.org/blog/index.php?pk=211232&T=2

[TABLE]
[ROW][C]Partial Autocorrelation Function[/C][/ROW]
[ROW][C]Time lag k[/C][C]PACF(k)[/C][C]T-STAT[/C][C]P-value[/C][/ROW]
[ROW][C]1[/C][C]0.336675[/C][C]3.4988[/C][C]0.00034[/C][/ROW]
[ROW][C]2[/C][C]0.062838[/C][C]0.653[/C][C]0.257562[/C][/ROW]
[ROW][C]3[/C][C]-0.34682[/C][C]-3.6043[/C][C]0.000238[/C][/ROW]
[ROW][C]4[/C][C]-0.279261[/C][C]-2.9022[/C][C]0.002246[/C][/ROW]
[ROW][C]5[/C][C]0.20708[/C][C]2.152[/C][C]0.016811[/C][/ROW]
[ROW][C]6[/C][C]-0.405732[/C][C]-4.2165[/C][C]2.6e-05[/C][/ROW]
[ROW][C]7[/C][C]-0.104231[/C][C]-1.0832[/C][C]0.140565[/C][/ROW]
[ROW][C]8[/C][C]-0.444307[/C][C]-4.6174[/C][C]5e-06[/C][/ROW]
[ROW][C]9[/C][C]-0.286203[/C][C]-2.9743[/C][C]0.001811[/C][/ROW]
[ROW][C]10[/C][C]0.159995[/C][C]1.6627[/C][C]0.049634[/C][/ROW]
[ROW][C]11[/C][C]0.123645[/C][C]1.285[/C][C]0.100778[/C][/ROW]
[ROW][C]12[/C][C]0.571114[/C][C]5.9352[/C][C]0[/C][/ROW]
[ROW][C]13[/C][C]-0.098601[/C][C]-1.0247[/C][C]0.1539[/C][/ROW]
[ROW][C]14[/C][C]-0.005221[/C][C]-0.0543[/C][C]0.478414[/C][/ROW]
[ROW][C]15[/C][C]0.026689[/C][C]0.2774[/C][C]0.391017[/C][/ROW]
[ROW][C]16[/C][C]-0.01788[/C][C]-0.1858[/C][C]0.426468[/C][/ROW]
[ROW][C]17[/C][C]0.122009[/C][C]1.268[/C][C]0.103771[/C][/ROW]
[ROW][C]18[/C][C]0.018691[/C][C]0.1942[/C][C]0.423176[/C][/ROW]
[ROW][C]19[/C][C]-0.015147[/C][C]-0.1574[/C][C]0.437608[/C][/ROW]
[ROW][C]20[/C][C]0.166705[/C][C]1.7324[/C][C]0.043024[/C][/ROW]
[ROW][C]21[/C][C]-0.017058[/C][C]-0.1773[/C][C]0.429814[/C][/ROW]
[ROW][C]22[/C][C]-0.054645[/C][C]-0.5679[/C][C]0.285645[/C][/ROW]
[ROW][C]23[/C][C]-0.00262[/C][C]-0.0272[/C][C]0.489165[/C][/ROW]
[ROW][C]24[/C][C]-0.055499[/C][C]-0.5768[/C][C]0.282648[/C][/ROW]
[ROW][C]25[/C][C]0.129472[/C][C]1.3455[/C][C]0.090639[/C][/ROW]
[ROW][C]26[/C][C]-0.016428[/C][C]-0.1707[/C][C]0.432381[/C][/ROW]
[ROW][C]27[/C][C]-0.066874[/C][C]-0.695[/C][C]0.24428[/C][/ROW]
[ROW][C]28[/C][C]0.058544[/C][C]0.6084[/C][C]0.272098[/C][/ROW]
[ROW][C]29[/C][C]-0.089155[/C][C]-0.9265[/C][C]0.178118[/C][/ROW]
[ROW][C]30[/C][C]-0.003809[/C][C]-0.0396[/C][C]0.484249[/C][/ROW]
[ROW][C]31[/C][C]-0.113297[/C][C]-1.1774[/C][C]0.12081[/C][/ROW]
[ROW][C]32[/C][C]-0.012474[/C][C]-0.1296[/C][C]0.448549[/C][/ROW]
[ROW][C]33[/C][C]0.11046[/C][C]1.1479[/C][C]0.126767[/C][/ROW]
[ROW][C]34[/C][C]0.001261[/C][C]0.0131[/C][C]0.494784[/C][/ROW]
[ROW][C]35[/C][C]-0.085363[/C][C]-0.8871[/C][C]0.188493[/C][/ROW]
[ROW][C]36[/C][C]0.075857[/C][C]0.7883[/C][C]0.216116[/C][/ROW]
[ROW][C]37[/C][C]-0.152458[/C][C]-1.5844[/C][C]0.058015[/C][/ROW]
[ROW][C]38[/C][C]-0.135013[/C][C]-1.4031[/C][C]0.081728[/C][/ROW]
[ROW][C]39[/C][C]0.083281[/C][C]0.8655[/C][C]0.194346[/C][/ROW]
[ROW][C]40[/C][C]-0.003353[/C][C]-0.0348[/C][C]0.486133[/C][/ROW]
[ROW][C]41[/C][C]-0.017936[/C][C]-0.1864[/C][C]0.426241[/C][/ROW]
[ROW][C]42[/C][C]-0.100252[/C][C]-1.0418[/C][C]0.149905[/C][/ROW]
[ROW][C]43[/C][C]0.062643[/C][C]0.651[/C][C]0.258212[/C][/ROW]
[ROW][C]44[/C][C]0.056903[/C][C]0.5914[/C][C]0.27776[/C][/ROW]
[ROW][C]45[/C][C]-0.027346[/C][C]-0.2842[/C][C]0.388404[/C][/ROW]
[ROW][C]46[/C][C]-0.10696[/C][C]-1.1116[/C][C]0.134397[/C][/ROW]
[ROW][C]47[/C][C]-0.058944[/C][C]-0.6126[/C][C]0.270726[/C][/ROW]
[ROW][C]48[/C][C]-0.030857[/C][C]-0.3207[/C][C]0.37454[/C][/ROW]
[/TABLE]
Source: https://freestatistics.org/blog/index.php?pk=211232&T=2

Globally Unique Identifier (entire table): ba.freestatistics.org/blog/index.php?pk=211232&T=2

As an alternative you can also use a QR Code:  

The GUIDs for individual cells are displayed in the table below:

Partial Autocorrelation Function
Time lag kPACF(k)T-STATP-value
10.3366753.49880.00034
20.0628380.6530.257562
3-0.34682-3.60430.000238
4-0.279261-2.90220.002246
50.207082.1520.016811
6-0.405732-4.21652.6e-05
7-0.104231-1.08320.140565
8-0.444307-4.61745e-06
9-0.286203-2.97430.001811
100.1599951.66270.049634
110.1236451.2850.100778
120.5711145.93520
13-0.098601-1.02470.1539
14-0.005221-0.05430.478414
150.0266890.27740.391017
16-0.01788-0.18580.426468
170.1220091.2680.103771
180.0186910.19420.423176
19-0.015147-0.15740.437608
200.1667051.73240.043024
21-0.017058-0.17730.429814
22-0.054645-0.56790.285645
23-0.00262-0.02720.489165
24-0.055499-0.57680.282648
250.1294721.34550.090639
26-0.016428-0.17070.432381
27-0.066874-0.6950.24428
280.0585440.60840.272098
29-0.089155-0.92650.178118
30-0.003809-0.03960.484249
31-0.113297-1.17740.12081
32-0.012474-0.12960.448549
330.110461.14790.126767
340.0012610.01310.494784
35-0.085363-0.88710.188493
360.0758570.78830.216116
37-0.152458-1.58440.058015
38-0.135013-1.40310.081728
390.0832810.86550.194346
40-0.003353-0.03480.486133
41-0.017936-0.18640.426241
42-0.100252-1.04180.149905
430.0626430.6510.258212
440.0569030.59140.27776
45-0.027346-0.28420.388404
46-0.10696-1.11160.134397
47-0.058944-0.61260.270726
48-0.030857-0.32070.37454


Parameters (Session):
par1 = 48 ; par2 = 1 ; par3 = 0 ; par4 = 0 ; par5 = 12 ; par6 = White Noise ; par7 = 0.95 ;
Parameters (R input):
par1 = 48 ; par2 = 1 ; par3 = 0 ; par4 = 0 ; par5 = 12 ; par6 = White Noise ; par7 = 0.95 ; par8 = ;
R code (references can be found in the software module):
par8 <- ''
par7 <- '0.95'
par6 <- 'White Noise'
par5 <- '12'
par4 <- '0'
par3 <- '0'
par2 <- '1'
par1 <- '48'
if (par1 == 'Default') {
par1 = 10*log10(length(x))
} else {
par1 <- as.numeric(par1)
}
par2 <- as.numeric(par2)
par3 <- as.numeric(par3)
par4 <- as.numeric(par4)
par5 <- as.numeric(par5)
if (par6 == 'White Noise') par6 <- 'white' else par6 <- 'ma'
par7 <- as.numeric(par7)
if (par8 != '') par8 <- as.numeric(par8)
ox <- x
if (par8 == '') {
if (par2 == 0) {
x <- log(x)
} else {
x <- (x ^ par2 - 1) / par2
}
} else {
x <- log(x,base=par8)
}
if (par3 > 0) x <- diff(x,lag=1,difference=par3)
if (par4 > 0) x <- diff(x,lag=par5,difference=par4)
bitmap(file='picts.png')
op <- par(mfrow=c(2,1))
plot(ox,type='l',main='Original Time Series',xlab='time',ylab='value')
if (par8=='') {
mytitle <- paste('Working Time Series (lambda=',par2,', d=',par3,', D=',par4,')',sep='')
mysub <- paste('(lambda=',par2,', d=',par3,', D=',par4,', CI=', par7, ', CI type=',par6,')',sep='')
} else {
mytitle <- paste('Working Time Series (base=',par8,', d=',par3,', D=',par4,')',sep='')
mysub <- paste('(base=',par8,', d=',par3,', D=',par4,', CI=', par7, ', CI type=',par6,')',sep='')
}
plot(x,type='l', main=mytitle,xlab='time',ylab='value')
par(op)
dev.off()
bitmap(file='pic1.png')
racf <- acf(x, par1, main='Autocorrelation', xlab='time lag', ylab='ACF', ci.type=par6, ci=par7, sub=mysub)
dev.off()
bitmap(file='pic2.png')
rpacf <- pacf(x,par1,main='Partial Autocorrelation',xlab='lags',ylab='PACF',sub=mysub)
dev.off()
(myacf <- c(racf$acf))
(mypacf <- c(rpacf$acf))
lengthx <- length(x)
sqrtn <- sqrt(lengthx)
load(file='createtable')
a<-table.start()
a<-table.row.start(a)
a<-table.element(a,'Autocorrelation Function',4,TRUE)
a<-table.row.end(a)
a<-table.row.start(a)
a<-table.element(a,'Time lag k',header=TRUE)
a<-table.element(a,hyperlink('basics.htm','ACF(k)','click here for more information about the Autocorrelation Function'),header=TRUE)
a<-table.element(a,'T-STAT',header=TRUE)
a<-table.element(a,'P-value',header=TRUE)
a<-table.row.end(a)
for (i in 2:(par1+1)) {
a<-table.row.start(a)
a<-table.element(a,i-1,header=TRUE)
a<-table.element(a,round(myacf[i],6))
mytstat <- myacf[i]*sqrtn
a<-table.element(a,round(mytstat,4))
a<-table.element(a,round(1-pt(abs(mytstat),lengthx),6))
a<-table.row.end(a)
}
a<-table.end(a)
table.save(a,file='mytable.tab')
a<-table.start()
a<-table.row.start(a)
a<-table.element(a,'Partial Autocorrelation Function',4,TRUE)
a<-table.row.end(a)
a<-table.row.start(a)
a<-table.element(a,'Time lag k',header=TRUE)
a<-table.element(a,hyperlink('basics.htm','PACF(k)','click here for more information about the Partial Autocorrelation Function'),header=TRUE)
a<-table.element(a,'T-STAT',header=TRUE)
a<-table.element(a,'P-value',header=TRUE)
a<-table.row.end(a)
for (i in 1:par1) {
a<-table.row.start(a)
a<-table.element(a,i,header=TRUE)
a<-table.element(a,round(mypacf[i],6))
mytstat <- mypacf[i]*sqrtn
a<-table.element(a,round(mytstat,4))
a<-table.element(a,round(1-pt(abs(mytstat),lengthx),6))
a<-table.row.end(a)
}
a<-table.end(a)
table.save(a,file='mytable1.tab')