Free Statistics

of Irreproducible Research!

Author's title

Author*Unverified author*
R Software Modulerwasp_autocorrelation.wasp
Title produced by software(Partial) Autocorrelation Function
Date of computationTue, 20 Aug 2013 09:32:51 -0400
Cite this page as followsStatistical Computations at FreeStatistics.org, Office for Research Development and Education, URL https://freestatistics.org/blog/index.php?v=date/2013/Aug/20/t1377005658974nb1t742zaliv.htm/, Retrieved Sat, 27 Apr 2024 08:13:18 +0000
Statistical Computations at FreeStatistics.org, Office for Research Development and Education, URL https://freestatistics.org/blog/index.php?pk=211255, Retrieved Sat, 27 Apr 2024 08:13:18 +0000
QR Codes:

Original text written by user:
IsPrivate?No (this computation is public)
User-defined keywords
Estimated Impact96
Family? (F = Feedback message, R = changed R code, M = changed R Module, P = changed Parameters, D = changed Data)
-       [(Partial) Autocorrelation Function] [] [2013-08-20 13:32:51] [bdb7c0ed7ba273e65f9ee772c5dda4f0] [Current]
Feedback Forum

Post a new message
Dataseries X:
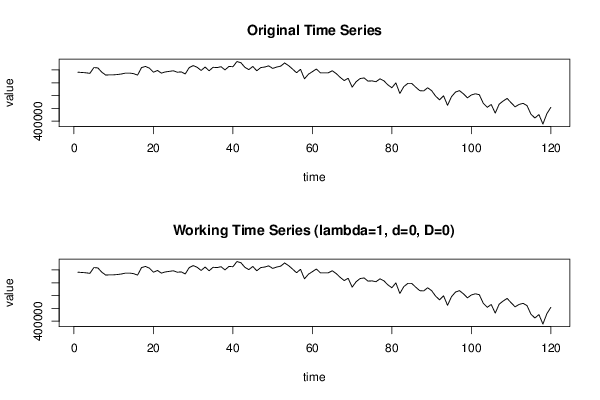
1165010
1160665
1156265
1147162.5
1237238.75
1232481.25
1165010
1120157.5
1124488.75
1124488.75
1129328.75
1138005
1151507.5
1151507.5
1142831.25
1120157.5
1237238.75
1255086.25
1228136.25
1165010
1192015
1151507.5
1169781.25
1178512.5
1187615
1165010
1169781.25
1138005
1237238.75
1268588.75
1241638.75
1192015
1245983.75
1187615
1241638.75
1237238.75
1250755
1201131.25
1255086.25
1250755
1331715
1313441.25
1241638.75
1205462.5
1255086.25
1187615
1237238.75
1245983.75
1264257.5
1223805
1245983.75
1259486.25
1309110
1268588.75
1214633.75
1156265
1210288.75
1061788.75
1133660
1174112.5
1214633.75
1156265
1156265
1156265
1187615
1142831.25
1084036.25
1034838.75
1070533.75
931205
1016578.75
1066188.75
1075305
1025681.25
1030012.5
1016578.75
1061788.75
1030012.5
967381.25
922102.5
998662.5
832383.75
940362.5
989560
989560
931205
877236.25
872905
922102.5
877236.25
791931.25
733136.25
796276.25
647831.25
782760
854562.5
877236.25
827626.25
764926.25
809778.75
827626.25
814110
679126.25
616481.25
661278.75
526350
665678.75
715302.5
755755
688283.75
625157.5
661278.75
679126.25
643431.25
508502.5
449707.5
503676.25
355231.25
517178.75
616481.25


Summary of computational transaction
Raw Inputview raw input (R code)
Raw Outputview raw output of R engine
Computing time3 seconds
R Server'Herman Ole Andreas Wold' @ wold.wessa.net

\begin{tabular}{lllllllll}
\hline
Summary of computational transaction \tabularnewline
Raw Input & view raw input (R code)  \tabularnewline
Raw Output & view raw output of R engine  \tabularnewline
Computing time & 3 seconds \tabularnewline
R Server & 'Herman Ole Andreas Wold' @ wold.wessa.net \tabularnewline
\hline
\end{tabular}
%Source: https://freestatistics.org/blog/index.php?pk=211255&T=0

[TABLE]
[ROW][C]Summary of computational transaction[/C][/ROW]
[ROW][C]Raw Input[/C][C]view raw input (R code) [/C][/ROW]
[ROW][C]Raw Output[/C][C]view raw output of R engine [/C][/ROW]
[ROW][C]Computing time[/C][C]3 seconds[/C][/ROW]
[ROW][C]R Server[/C][C]'Herman Ole Andreas Wold' @ wold.wessa.net[/C][/ROW]
[/TABLE]
Source: https://freestatistics.org/blog/index.php?pk=211255&T=0

Globally Unique Identifier (entire table): ba.freestatistics.org/blog/index.php?pk=211255&T=0

As an alternative you can also use a QR Code:  

The GUIDs for individual cells are displayed in the table below:

Summary of computational transaction
Raw Inputview raw input (R code)
Raw Outputview raw output of R engine
Computing time3 seconds
R Server'Herman Ole Andreas Wold' @ wold.wessa.net


Autocorrelation Function
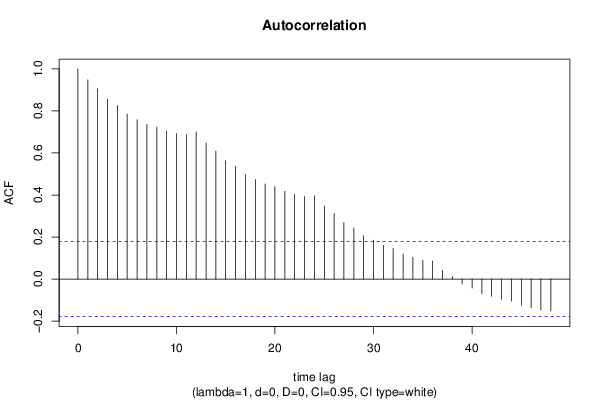
Time lag kACF(k)T-STATP-value
10.94790210.38380
20.9052679.91670
30.8557289.3740
40.8262069.05060
50.7856798.60670
60.7579668.30310
70.7361888.06450
80.7236547.92720
90.7031827.7030
100.6921027.58160
110.687577.5320
120.7001327.66960
130.6479597.0980
140.6088366.66950
150.5635116.17290
160.5363625.87560
170.4979725.4550
180.4738345.19060
190.452694.9591e-06
200.440014.82012e-06
210.4182934.58226e-06
220.4033964.4191.1e-05
230.3933264.30871.7e-05
240.39694.34781.4e-05
250.3480763.8130.000109
260.3117643.41520.000435
270.2687162.94360.001948
280.2433612.66590.004368
290.2063782.26080.012788
300.1844192.02020.022794
310.1603371.75640.040785
320.145281.59150.057068
330.1190311.30390.097379
340.1022811.12040.132383
350.0881910.96610.167972
360.0855670.93730.175235
370.0421540.46180.322539
380.0125280.13720.445537
39-0.023121-0.25330.400244
40-0.042346-0.46390.321788
41-0.070055-0.76740.222172
42-0.081845-0.89660.185873
43-0.096617-1.05840.146002
44-0.105098-1.15130.125951
45-0.124959-1.36890.086801
46-0.136032-1.49020.069403
47-0.147632-1.61720.054227
48-0.152256-1.66790.048974

\begin{tabular}{lllllllll}
\hline
Autocorrelation Function \tabularnewline
Time lag k & ACF(k) & T-STAT & P-value \tabularnewline
1 & 0.947902 & 10.3838 & 0 \tabularnewline
2 & 0.905267 & 9.9167 & 0 \tabularnewline
3 & 0.855728 & 9.374 & 0 \tabularnewline
4 & 0.826206 & 9.0506 & 0 \tabularnewline
5 & 0.785679 & 8.6067 & 0 \tabularnewline
6 & 0.757966 & 8.3031 & 0 \tabularnewline
7 & 0.736188 & 8.0645 & 0 \tabularnewline
8 & 0.723654 & 7.9272 & 0 \tabularnewline
9 & 0.703182 & 7.703 & 0 \tabularnewline
10 & 0.692102 & 7.5816 & 0 \tabularnewline
11 & 0.68757 & 7.532 & 0 \tabularnewline
12 & 0.700132 & 7.6696 & 0 \tabularnewline
13 & 0.647959 & 7.098 & 0 \tabularnewline
14 & 0.608836 & 6.6695 & 0 \tabularnewline
15 & 0.563511 & 6.1729 & 0 \tabularnewline
16 & 0.536362 & 5.8756 & 0 \tabularnewline
17 & 0.497972 & 5.455 & 0 \tabularnewline
18 & 0.473834 & 5.1906 & 0 \tabularnewline
19 & 0.45269 & 4.959 & 1e-06 \tabularnewline
20 & 0.44001 & 4.8201 & 2e-06 \tabularnewline
21 & 0.418293 & 4.5822 & 6e-06 \tabularnewline
22 & 0.403396 & 4.419 & 1.1e-05 \tabularnewline
23 & 0.393326 & 4.3087 & 1.7e-05 \tabularnewline
24 & 0.3969 & 4.3478 & 1.4e-05 \tabularnewline
25 & 0.348076 & 3.813 & 0.000109 \tabularnewline
26 & 0.311764 & 3.4152 & 0.000435 \tabularnewline
27 & 0.268716 & 2.9436 & 0.001948 \tabularnewline
28 & 0.243361 & 2.6659 & 0.004368 \tabularnewline
29 & 0.206378 & 2.2608 & 0.012788 \tabularnewline
30 & 0.184419 & 2.0202 & 0.022794 \tabularnewline
31 & 0.160337 & 1.7564 & 0.040785 \tabularnewline
32 & 0.14528 & 1.5915 & 0.057068 \tabularnewline
33 & 0.119031 & 1.3039 & 0.097379 \tabularnewline
34 & 0.102281 & 1.1204 & 0.132383 \tabularnewline
35 & 0.088191 & 0.9661 & 0.167972 \tabularnewline
36 & 0.085567 & 0.9373 & 0.175235 \tabularnewline
37 & 0.042154 & 0.4618 & 0.322539 \tabularnewline
38 & 0.012528 & 0.1372 & 0.445537 \tabularnewline
39 & -0.023121 & -0.2533 & 0.400244 \tabularnewline
40 & -0.042346 & -0.4639 & 0.321788 \tabularnewline
41 & -0.070055 & -0.7674 & 0.222172 \tabularnewline
42 & -0.081845 & -0.8966 & 0.185873 \tabularnewline
43 & -0.096617 & -1.0584 & 0.146002 \tabularnewline
44 & -0.105098 & -1.1513 & 0.125951 \tabularnewline
45 & -0.124959 & -1.3689 & 0.086801 \tabularnewline
46 & -0.136032 & -1.4902 & 0.069403 \tabularnewline
47 & -0.147632 & -1.6172 & 0.054227 \tabularnewline
48 & -0.152256 & -1.6679 & 0.048974 \tabularnewline
\hline
\end{tabular}
%Source: https://freestatistics.org/blog/index.php?pk=211255&T=1

[TABLE]
[ROW][C]Autocorrelation Function[/C][/ROW]
[ROW][C]Time lag k[/C][C]ACF(k)[/C][C]T-STAT[/C][C]P-value[/C][/ROW]
[ROW][C]1[/C][C]0.947902[/C][C]10.3838[/C][C]0[/C][/ROW]
[ROW][C]2[/C][C]0.905267[/C][C]9.9167[/C][C]0[/C][/ROW]
[ROW][C]3[/C][C]0.855728[/C][C]9.374[/C][C]0[/C][/ROW]
[ROW][C]4[/C][C]0.826206[/C][C]9.0506[/C][C]0[/C][/ROW]
[ROW][C]5[/C][C]0.785679[/C][C]8.6067[/C][C]0[/C][/ROW]
[ROW][C]6[/C][C]0.757966[/C][C]8.3031[/C][C]0[/C][/ROW]
[ROW][C]7[/C][C]0.736188[/C][C]8.0645[/C][C]0[/C][/ROW]
[ROW][C]8[/C][C]0.723654[/C][C]7.9272[/C][C]0[/C][/ROW]
[ROW][C]9[/C][C]0.703182[/C][C]7.703[/C][C]0[/C][/ROW]
[ROW][C]10[/C][C]0.692102[/C][C]7.5816[/C][C]0[/C][/ROW]
[ROW][C]11[/C][C]0.68757[/C][C]7.532[/C][C]0[/C][/ROW]
[ROW][C]12[/C][C]0.700132[/C][C]7.6696[/C][C]0[/C][/ROW]
[ROW][C]13[/C][C]0.647959[/C][C]7.098[/C][C]0[/C][/ROW]
[ROW][C]14[/C][C]0.608836[/C][C]6.6695[/C][C]0[/C][/ROW]
[ROW][C]15[/C][C]0.563511[/C][C]6.1729[/C][C]0[/C][/ROW]
[ROW][C]16[/C][C]0.536362[/C][C]5.8756[/C][C]0[/C][/ROW]
[ROW][C]17[/C][C]0.497972[/C][C]5.455[/C][C]0[/C][/ROW]
[ROW][C]18[/C][C]0.473834[/C][C]5.1906[/C][C]0[/C][/ROW]
[ROW][C]19[/C][C]0.45269[/C][C]4.959[/C][C]1e-06[/C][/ROW]
[ROW][C]20[/C][C]0.44001[/C][C]4.8201[/C][C]2e-06[/C][/ROW]
[ROW][C]21[/C][C]0.418293[/C][C]4.5822[/C][C]6e-06[/C][/ROW]
[ROW][C]22[/C][C]0.403396[/C][C]4.419[/C][C]1.1e-05[/C][/ROW]
[ROW][C]23[/C][C]0.393326[/C][C]4.3087[/C][C]1.7e-05[/C][/ROW]
[ROW][C]24[/C][C]0.3969[/C][C]4.3478[/C][C]1.4e-05[/C][/ROW]
[ROW][C]25[/C][C]0.348076[/C][C]3.813[/C][C]0.000109[/C][/ROW]
[ROW][C]26[/C][C]0.311764[/C][C]3.4152[/C][C]0.000435[/C][/ROW]
[ROW][C]27[/C][C]0.268716[/C][C]2.9436[/C][C]0.001948[/C][/ROW]
[ROW][C]28[/C][C]0.243361[/C][C]2.6659[/C][C]0.004368[/C][/ROW]
[ROW][C]29[/C][C]0.206378[/C][C]2.2608[/C][C]0.012788[/C][/ROW]
[ROW][C]30[/C][C]0.184419[/C][C]2.0202[/C][C]0.022794[/C][/ROW]
[ROW][C]31[/C][C]0.160337[/C][C]1.7564[/C][C]0.040785[/C][/ROW]
[ROW][C]32[/C][C]0.14528[/C][C]1.5915[/C][C]0.057068[/C][/ROW]
[ROW][C]33[/C][C]0.119031[/C][C]1.3039[/C][C]0.097379[/C][/ROW]
[ROW][C]34[/C][C]0.102281[/C][C]1.1204[/C][C]0.132383[/C][/ROW]
[ROW][C]35[/C][C]0.088191[/C][C]0.9661[/C][C]0.167972[/C][/ROW]
[ROW][C]36[/C][C]0.085567[/C][C]0.9373[/C][C]0.175235[/C][/ROW]
[ROW][C]37[/C][C]0.042154[/C][C]0.4618[/C][C]0.322539[/C][/ROW]
[ROW][C]38[/C][C]0.012528[/C][C]0.1372[/C][C]0.445537[/C][/ROW]
[ROW][C]39[/C][C]-0.023121[/C][C]-0.2533[/C][C]0.400244[/C][/ROW]
[ROW][C]40[/C][C]-0.042346[/C][C]-0.4639[/C][C]0.321788[/C][/ROW]
[ROW][C]41[/C][C]-0.070055[/C][C]-0.7674[/C][C]0.222172[/C][/ROW]
[ROW][C]42[/C][C]-0.081845[/C][C]-0.8966[/C][C]0.185873[/C][/ROW]
[ROW][C]43[/C][C]-0.096617[/C][C]-1.0584[/C][C]0.146002[/C][/ROW]
[ROW][C]44[/C][C]-0.105098[/C][C]-1.1513[/C][C]0.125951[/C][/ROW]
[ROW][C]45[/C][C]-0.124959[/C][C]-1.3689[/C][C]0.086801[/C][/ROW]
[ROW][C]46[/C][C]-0.136032[/C][C]-1.4902[/C][C]0.069403[/C][/ROW]
[ROW][C]47[/C][C]-0.147632[/C][C]-1.6172[/C][C]0.054227[/C][/ROW]
[ROW][C]48[/C][C]-0.152256[/C][C]-1.6679[/C][C]0.048974[/C][/ROW]
[/TABLE]
Source: https://freestatistics.org/blog/index.php?pk=211255&T=1

Globally Unique Identifier (entire table): ba.freestatistics.org/blog/index.php?pk=211255&T=1

As an alternative you can also use a QR Code:  

The GUIDs for individual cells are displayed in the table below:

Autocorrelation Function
Time lag kACF(k)T-STATP-value
10.94790210.38380
20.9052679.91670
30.8557289.3740
40.8262069.05060
50.7856798.60670
60.7579668.30310
70.7361888.06450
80.7236547.92720
90.7031827.7030
100.6921027.58160
110.687577.5320
120.7001327.66960
130.6479597.0980
140.6088366.66950
150.5635116.17290
160.5363625.87560
170.4979725.4550
180.4738345.19060
190.452694.9591e-06
200.440014.82012e-06
210.4182934.58226e-06
220.4033964.4191.1e-05
230.3933264.30871.7e-05
240.39694.34781.4e-05
250.3480763.8130.000109
260.3117643.41520.000435
270.2687162.94360.001948
280.2433612.66590.004368
290.2063782.26080.012788
300.1844192.02020.022794
310.1603371.75640.040785
320.145281.59150.057068
330.1190311.30390.097379
340.1022811.12040.132383
350.0881910.96610.167972
360.0855670.93730.175235
370.0421540.46180.322539
380.0125280.13720.445537
39-0.023121-0.25330.400244
40-0.042346-0.46390.321788
41-0.070055-0.76740.222172
42-0.081845-0.89660.185873
43-0.096617-1.05840.146002
44-0.105098-1.15130.125951
45-0.124959-1.36890.086801
46-0.136032-1.49020.069403
47-0.147632-1.61720.054227
48-0.152256-1.66790.048974


Partial Autocorrelation Function
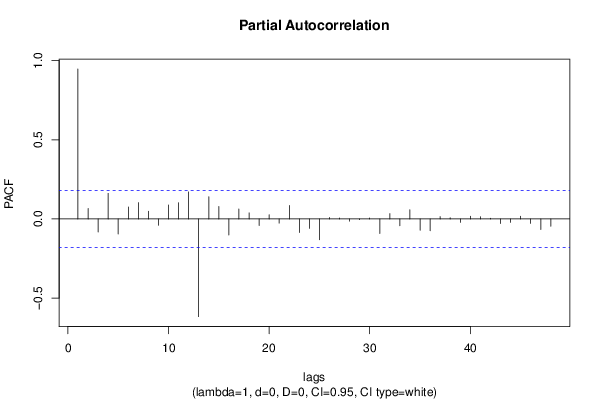
Time lag kPACF(k)T-STATP-value
10.94790210.38380
20.0664960.72840.233887
3-0.082621-0.90510.183622
40.1617691.77210.039458
5-0.095015-1.04080.150023
60.0752230.8240.20578
70.1033751.13240.129859
80.0490820.53770.295902
9-0.040351-0.4420.329636
100.0882740.9670.167746
110.1023961.12170.132117
120.1708671.87180.031838
13-0.617558-6.7650
140.1401071.53480.063734
150.0791210.86670.19391
16-0.101808-1.11530.133485
170.0628860.68890.246112
180.0384250.42090.337281
19-0.041022-0.44940.326985
200.0265220.29050.385953
21-0.026511-0.29040.386002
220.0847460.92830.177546
23-0.085819-0.94010.174529
24-0.059761-0.65460.256975
25-0.132118-1.44730.075214
260.0095750.10490.458322
270.0063870.070.472168
28-0.014106-0.15450.438728
29-0.004646-0.05090.479749
300.005710.06250.475116
31-0.091581-1.00320.158886
320.03360.36810.356734
33-0.043554-0.47710.317077
340.0585110.6410.261386
35-0.071717-0.78560.216819
36-0.075134-0.82310.206056
370.014540.15930.43686
380.0072950.07990.468222
39-0.021744-0.23820.406069
400.0172860.18940.425067
410.0142440.1560.438135
420.0038590.04230.483174
43-0.029039-0.31810.375481
44-0.021887-0.23980.405463
450.0166630.18250.427737
46-0.028074-0.30750.379485
47-0.067426-0.73860.230791
48-0.046565-0.51010.305463

\begin{tabular}{lllllllll}
\hline
Partial Autocorrelation Function \tabularnewline
Time lag k & PACF(k) & T-STAT & P-value \tabularnewline
1 & 0.947902 & 10.3838 & 0 \tabularnewline
2 & 0.066496 & 0.7284 & 0.233887 \tabularnewline
3 & -0.082621 & -0.9051 & 0.183622 \tabularnewline
4 & 0.161769 & 1.7721 & 0.039458 \tabularnewline
5 & -0.095015 & -1.0408 & 0.150023 \tabularnewline
6 & 0.075223 & 0.824 & 0.20578 \tabularnewline
7 & 0.103375 & 1.1324 & 0.129859 \tabularnewline
8 & 0.049082 & 0.5377 & 0.295902 \tabularnewline
9 & -0.040351 & -0.442 & 0.329636 \tabularnewline
10 & 0.088274 & 0.967 & 0.167746 \tabularnewline
11 & 0.102396 & 1.1217 & 0.132117 \tabularnewline
12 & 0.170867 & 1.8718 & 0.031838 \tabularnewline
13 & -0.617558 & -6.765 & 0 \tabularnewline
14 & 0.140107 & 1.5348 & 0.063734 \tabularnewline
15 & 0.079121 & 0.8667 & 0.19391 \tabularnewline
16 & -0.101808 & -1.1153 & 0.133485 \tabularnewline
17 & 0.062886 & 0.6889 & 0.246112 \tabularnewline
18 & 0.038425 & 0.4209 & 0.337281 \tabularnewline
19 & -0.041022 & -0.4494 & 0.326985 \tabularnewline
20 & 0.026522 & 0.2905 & 0.385953 \tabularnewline
21 & -0.026511 & -0.2904 & 0.386002 \tabularnewline
22 & 0.084746 & 0.9283 & 0.177546 \tabularnewline
23 & -0.085819 & -0.9401 & 0.174529 \tabularnewline
24 & -0.059761 & -0.6546 & 0.256975 \tabularnewline
25 & -0.132118 & -1.4473 & 0.075214 \tabularnewline
26 & 0.009575 & 0.1049 & 0.458322 \tabularnewline
27 & 0.006387 & 0.07 & 0.472168 \tabularnewline
28 & -0.014106 & -0.1545 & 0.438728 \tabularnewline
29 & -0.004646 & -0.0509 & 0.479749 \tabularnewline
30 & 0.00571 & 0.0625 & 0.475116 \tabularnewline
31 & -0.091581 & -1.0032 & 0.158886 \tabularnewline
32 & 0.0336 & 0.3681 & 0.356734 \tabularnewline
33 & -0.043554 & -0.4771 & 0.317077 \tabularnewline
34 & 0.058511 & 0.641 & 0.261386 \tabularnewline
35 & -0.071717 & -0.7856 & 0.216819 \tabularnewline
36 & -0.075134 & -0.8231 & 0.206056 \tabularnewline
37 & 0.01454 & 0.1593 & 0.43686 \tabularnewline
38 & 0.007295 & 0.0799 & 0.468222 \tabularnewline
39 & -0.021744 & -0.2382 & 0.406069 \tabularnewline
40 & 0.017286 & 0.1894 & 0.425067 \tabularnewline
41 & 0.014244 & 0.156 & 0.438135 \tabularnewline
42 & 0.003859 & 0.0423 & 0.483174 \tabularnewline
43 & -0.029039 & -0.3181 & 0.375481 \tabularnewline
44 & -0.021887 & -0.2398 & 0.405463 \tabularnewline
45 & 0.016663 & 0.1825 & 0.427737 \tabularnewline
46 & -0.028074 & -0.3075 & 0.379485 \tabularnewline
47 & -0.067426 & -0.7386 & 0.230791 \tabularnewline
48 & -0.046565 & -0.5101 & 0.305463 \tabularnewline
\hline
\end{tabular}
%Source: https://freestatistics.org/blog/index.php?pk=211255&T=2

[TABLE]
[ROW][C]Partial Autocorrelation Function[/C][/ROW]
[ROW][C]Time lag k[/C][C]PACF(k)[/C][C]T-STAT[/C][C]P-value[/C][/ROW]
[ROW][C]1[/C][C]0.947902[/C][C]10.3838[/C][C]0[/C][/ROW]
[ROW][C]2[/C][C]0.066496[/C][C]0.7284[/C][C]0.233887[/C][/ROW]
[ROW][C]3[/C][C]-0.082621[/C][C]-0.9051[/C][C]0.183622[/C][/ROW]
[ROW][C]4[/C][C]0.161769[/C][C]1.7721[/C][C]0.039458[/C][/ROW]
[ROW][C]5[/C][C]-0.095015[/C][C]-1.0408[/C][C]0.150023[/C][/ROW]
[ROW][C]6[/C][C]0.075223[/C][C]0.824[/C][C]0.20578[/C][/ROW]
[ROW][C]7[/C][C]0.103375[/C][C]1.1324[/C][C]0.129859[/C][/ROW]
[ROW][C]8[/C][C]0.049082[/C][C]0.5377[/C][C]0.295902[/C][/ROW]
[ROW][C]9[/C][C]-0.040351[/C][C]-0.442[/C][C]0.329636[/C][/ROW]
[ROW][C]10[/C][C]0.088274[/C][C]0.967[/C][C]0.167746[/C][/ROW]
[ROW][C]11[/C][C]0.102396[/C][C]1.1217[/C][C]0.132117[/C][/ROW]
[ROW][C]12[/C][C]0.170867[/C][C]1.8718[/C][C]0.031838[/C][/ROW]
[ROW][C]13[/C][C]-0.617558[/C][C]-6.765[/C][C]0[/C][/ROW]
[ROW][C]14[/C][C]0.140107[/C][C]1.5348[/C][C]0.063734[/C][/ROW]
[ROW][C]15[/C][C]0.079121[/C][C]0.8667[/C][C]0.19391[/C][/ROW]
[ROW][C]16[/C][C]-0.101808[/C][C]-1.1153[/C][C]0.133485[/C][/ROW]
[ROW][C]17[/C][C]0.062886[/C][C]0.6889[/C][C]0.246112[/C][/ROW]
[ROW][C]18[/C][C]0.038425[/C][C]0.4209[/C][C]0.337281[/C][/ROW]
[ROW][C]19[/C][C]-0.041022[/C][C]-0.4494[/C][C]0.326985[/C][/ROW]
[ROW][C]20[/C][C]0.026522[/C][C]0.2905[/C][C]0.385953[/C][/ROW]
[ROW][C]21[/C][C]-0.026511[/C][C]-0.2904[/C][C]0.386002[/C][/ROW]
[ROW][C]22[/C][C]0.084746[/C][C]0.9283[/C][C]0.177546[/C][/ROW]
[ROW][C]23[/C][C]-0.085819[/C][C]-0.9401[/C][C]0.174529[/C][/ROW]
[ROW][C]24[/C][C]-0.059761[/C][C]-0.6546[/C][C]0.256975[/C][/ROW]
[ROW][C]25[/C][C]-0.132118[/C][C]-1.4473[/C][C]0.075214[/C][/ROW]
[ROW][C]26[/C][C]0.009575[/C][C]0.1049[/C][C]0.458322[/C][/ROW]
[ROW][C]27[/C][C]0.006387[/C][C]0.07[/C][C]0.472168[/C][/ROW]
[ROW][C]28[/C][C]-0.014106[/C][C]-0.1545[/C][C]0.438728[/C][/ROW]
[ROW][C]29[/C][C]-0.004646[/C][C]-0.0509[/C][C]0.479749[/C][/ROW]
[ROW][C]30[/C][C]0.00571[/C][C]0.0625[/C][C]0.475116[/C][/ROW]
[ROW][C]31[/C][C]-0.091581[/C][C]-1.0032[/C][C]0.158886[/C][/ROW]
[ROW][C]32[/C][C]0.0336[/C][C]0.3681[/C][C]0.356734[/C][/ROW]
[ROW][C]33[/C][C]-0.043554[/C][C]-0.4771[/C][C]0.317077[/C][/ROW]
[ROW][C]34[/C][C]0.058511[/C][C]0.641[/C][C]0.261386[/C][/ROW]
[ROW][C]35[/C][C]-0.071717[/C][C]-0.7856[/C][C]0.216819[/C][/ROW]
[ROW][C]36[/C][C]-0.075134[/C][C]-0.8231[/C][C]0.206056[/C][/ROW]
[ROW][C]37[/C][C]0.01454[/C][C]0.1593[/C][C]0.43686[/C][/ROW]
[ROW][C]38[/C][C]0.007295[/C][C]0.0799[/C][C]0.468222[/C][/ROW]
[ROW][C]39[/C][C]-0.021744[/C][C]-0.2382[/C][C]0.406069[/C][/ROW]
[ROW][C]40[/C][C]0.017286[/C][C]0.1894[/C][C]0.425067[/C][/ROW]
[ROW][C]41[/C][C]0.014244[/C][C]0.156[/C][C]0.438135[/C][/ROW]
[ROW][C]42[/C][C]0.003859[/C][C]0.0423[/C][C]0.483174[/C][/ROW]
[ROW][C]43[/C][C]-0.029039[/C][C]-0.3181[/C][C]0.375481[/C][/ROW]
[ROW][C]44[/C][C]-0.021887[/C][C]-0.2398[/C][C]0.405463[/C][/ROW]
[ROW][C]45[/C][C]0.016663[/C][C]0.1825[/C][C]0.427737[/C][/ROW]
[ROW][C]46[/C][C]-0.028074[/C][C]-0.3075[/C][C]0.379485[/C][/ROW]
[ROW][C]47[/C][C]-0.067426[/C][C]-0.7386[/C][C]0.230791[/C][/ROW]
[ROW][C]48[/C][C]-0.046565[/C][C]-0.5101[/C][C]0.305463[/C][/ROW]
[/TABLE]
Source: https://freestatistics.org/blog/index.php?pk=211255&T=2

Globally Unique Identifier (entire table): ba.freestatistics.org/blog/index.php?pk=211255&T=2

As an alternative you can also use a QR Code:  

The GUIDs for individual cells are displayed in the table below:

Partial Autocorrelation Function
Time lag kPACF(k)T-STATP-value
10.94790210.38380
20.0664960.72840.233887
3-0.082621-0.90510.183622
40.1617691.77210.039458
5-0.095015-1.04080.150023
60.0752230.8240.20578
70.1033751.13240.129859
80.0490820.53770.295902
9-0.040351-0.4420.329636
100.0882740.9670.167746
110.1023961.12170.132117
120.1708671.87180.031838
13-0.617558-6.7650
140.1401071.53480.063734
150.0791210.86670.19391
16-0.101808-1.11530.133485
170.0628860.68890.246112
180.0384250.42090.337281
19-0.041022-0.44940.326985
200.0265220.29050.385953
21-0.026511-0.29040.386002
220.0847460.92830.177546
23-0.085819-0.94010.174529
24-0.059761-0.65460.256975
25-0.132118-1.44730.075214
260.0095750.10490.458322
270.0063870.070.472168
28-0.014106-0.15450.438728
29-0.004646-0.05090.479749
300.005710.06250.475116
31-0.091581-1.00320.158886
320.03360.36810.356734
33-0.043554-0.47710.317077
340.0585110.6410.261386
35-0.071717-0.78560.216819
36-0.075134-0.82310.206056
370.014540.15930.43686
380.0072950.07990.468222
39-0.021744-0.23820.406069
400.0172860.18940.425067
410.0142440.1560.438135
420.0038590.04230.483174
43-0.029039-0.31810.375481
44-0.021887-0.23980.405463
450.0166630.18250.427737
46-0.028074-0.30750.379485
47-0.067426-0.73860.230791
48-0.046565-0.51010.305463


Parameters (Session):
par1 = 0.1 ; par2 = 0.9 ; par3 = 0.1 ;
Parameters (R input):
par1 = 48 ; par2 = 1 ; par3 = 0 ; par4 = 0 ; par5 = 12 ; par6 = White Noise ; par7 = 0.95 ; par8 = ;
R code (references can be found in the software module):
if (par1 == 'Default') {
par1 = 10*log10(length(x))
} else {
par1 <- as.numeric(par1)
}
par2 <- as.numeric(par2)
par3 <- as.numeric(par3)
par4 <- as.numeric(par4)
par5 <- as.numeric(par5)
if (par6 == 'White Noise') par6 <- 'white' else par6 <- 'ma'
par7 <- as.numeric(par7)
if (par8 != '') par8 <- as.numeric(par8)
ox <- x
if (par8 == '') {
if (par2 == 0) {
x <- log(x)
} else {
x <- (x ^ par2 - 1) / par2
}
} else {
x <- log(x,base=par8)
}
if (par3 > 0) x <- diff(x,lag=1,difference=par3)
if (par4 > 0) x <- diff(x,lag=par5,difference=par4)
bitmap(file='picts.png')
op <- par(mfrow=c(2,1))
plot(ox,type='l',main='Original Time Series',xlab='time',ylab='value')
if (par8=='') {
mytitle <- paste('Working Time Series (lambda=',par2,', d=',par3,', D=',par4,')',sep='')
mysub <- paste('(lambda=',par2,', d=',par3,', D=',par4,', CI=', par7, ', CI type=',par6,')',sep='')
} else {
mytitle <- paste('Working Time Series (base=',par8,', d=',par3,', D=',par4,')',sep='')
mysub <- paste('(base=',par8,', d=',par3,', D=',par4,', CI=', par7, ', CI type=',par6,')',sep='')
}
plot(x,type='l', main=mytitle,xlab='time',ylab='value')
par(op)
dev.off()
bitmap(file='pic1.png')
racf <- acf(x, par1, main='Autocorrelation', xlab='time lag', ylab='ACF', ci.type=par6, ci=par7, sub=mysub)
dev.off()
bitmap(file='pic2.png')
rpacf <- pacf(x,par1,main='Partial Autocorrelation',xlab='lags',ylab='PACF',sub=mysub)
dev.off()
(myacf <- c(racf$acf))
(mypacf <- c(rpacf$acf))
lengthx <- length(x)
sqrtn <- sqrt(lengthx)
load(file='createtable')
a<-table.start()
a<-table.row.start(a)
a<-table.element(a,'Autocorrelation Function',4,TRUE)
a<-table.row.end(a)
a<-table.row.start(a)
a<-table.element(a,'Time lag k',header=TRUE)
a<-table.element(a,hyperlink('basics.htm','ACF(k)','click here for more information about the Autocorrelation Function'),header=TRUE)
a<-table.element(a,'T-STAT',header=TRUE)
a<-table.element(a,'P-value',header=TRUE)
a<-table.row.end(a)
for (i in 2:(par1+1)) {
a<-table.row.start(a)
a<-table.element(a,i-1,header=TRUE)
a<-table.element(a,round(myacf[i],6))
mytstat <- myacf[i]*sqrtn
a<-table.element(a,round(mytstat,4))
a<-table.element(a,round(1-pt(abs(mytstat),lengthx),6))
a<-table.row.end(a)
}
a<-table.end(a)
table.save(a,file='mytable.tab')
a<-table.start()
a<-table.row.start(a)
a<-table.element(a,'Partial Autocorrelation Function',4,TRUE)
a<-table.row.end(a)
a<-table.row.start(a)
a<-table.element(a,'Time lag k',header=TRUE)
a<-table.element(a,hyperlink('basics.htm','PACF(k)','click here for more information about the Partial Autocorrelation Function'),header=TRUE)
a<-table.element(a,'T-STAT',header=TRUE)
a<-table.element(a,'P-value',header=TRUE)
a<-table.row.end(a)
for (i in 1:par1) {
a<-table.row.start(a)
a<-table.element(a,i,header=TRUE)
a<-table.element(a,round(mypacf[i],6))
mytstat <- mypacf[i]*sqrtn
a<-table.element(a,round(mytstat,4))
a<-table.element(a,round(1-pt(abs(mytstat),lengthx),6))
a<-table.row.end(a)
}
a<-table.end(a)
table.save(a,file='mytable1.tab')