Free Statistics

of Irreproducible Research!

Author's title

Author*Unverified author*
R Software Modulerwasp_autocorrelation.wasp
Title produced by software(Partial) Autocorrelation Function
Date of computationTue, 20 Aug 2013 10:28:55 -0400
Cite this page as followsStatistical Computations at FreeStatistics.org, Office for Research Development and Education, URL https://freestatistics.org/blog/index.php?v=date/2013/Aug/20/t13770089916b5gac50gpj2yfl.htm/, Retrieved Sat, 27 Apr 2024 08:54:54 +0000
Statistical Computations at FreeStatistics.org, Office for Research Development and Education, URL https://freestatistics.org/blog/index.php?pk=211257, Retrieved Sat, 27 Apr 2024 08:54:54 +0000
QR Codes:

Original text written by user:
IsPrivate?No (this computation is public)
User-defined keywords
Estimated Impact90
Family? (F = Feedback message, R = changed R code, M = changed R Module, P = changed Parameters, D = changed Data)
-       [(Partial) Autocorrelation Function] [] [2013-08-20 14:28:55] [bdb7c0ed7ba273e65f9ee772c5dda4f0] [Current]
Feedback Forum

Post a new message
Dataseries X:
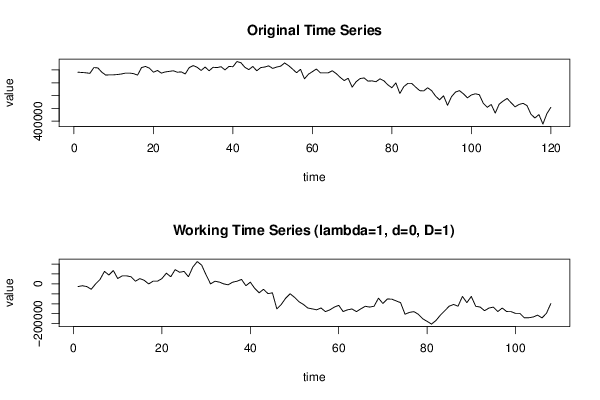
1165010
1160665
1156265
1147162.5
1237238.75
1232481.25
1165010
1120157.5
1124488.75
1124488.75
1129328.75
1138005
1151507.5
1151507.5
1142831.25
1120157.5
1237238.75
1255086.25
1228136.25
1165010
1192015
1151507.5
1169781.25
1178512.5
1187615
1165010
1169781.25
1138005
1237238.75
1268588.75
1241638.75
1192015
1245983.75
1187615
1241638.75
1237238.75
1250755
1201131.25
1255086.25
1250755
1331715
1313441.25
1241638.75
1205462.5
1255086.25
1187615
1237238.75
1245983.75
1264257.5
1223805
1245983.75
1259486.25
1309110
1268588.75
1214633.75
1156265
1210288.75
1061788.75
1133660
1174112.5
1214633.75
1156265
1156265
1156265
1187615
1142831.25
1084036.25
1034838.75
1070533.75
931205
1016578.75
1066188.75
1075305
1025681.25
1030012.5
1016578.75
1061788.75
1030012.5
967381.25
922102.5
998662.5
832383.75
940362.5
989560
989560
931205
877236.25
872905
922102.5
877236.25
791931.25
733136.25
796276.25
647831.25
782760
854562.5
877236.25
827626.25
764926.25
809778.75
827626.25
814110
679126.25
616481.25
661278.75
526350
665678.75
715302.5
755755
688283.75
625157.5
661278.75
679126.25
643431.25
508502.5
449707.5
503676.25
355231.25
517178.75
616481.25


Summary of computational transaction
Raw Inputview raw input (R code)
Raw Outputview raw output of R engine
Computing time3 seconds
R Server'Gertrude Mary Cox' @ cox.wessa.net

\begin{tabular}{lllllllll}
\hline
Summary of computational transaction \tabularnewline
Raw Input & view raw input (R code)  \tabularnewline
Raw Output & view raw output of R engine  \tabularnewline
Computing time & 3 seconds \tabularnewline
R Server & 'Gertrude Mary Cox' @ cox.wessa.net \tabularnewline
\hline
\end{tabular}
%Source: https://freestatistics.org/blog/index.php?pk=211257&T=0

[TABLE]
[ROW][C]Summary of computational transaction[/C][/ROW]
[ROW][C]Raw Input[/C][C]view raw input (R code) [/C][/ROW]
[ROW][C]Raw Output[/C][C]view raw output of R engine [/C][/ROW]
[ROW][C]Computing time[/C][C]3 seconds[/C][/ROW]
[ROW][C]R Server[/C][C]'Gertrude Mary Cox' @ cox.wessa.net[/C][/ROW]
[/TABLE]
Source: https://freestatistics.org/blog/index.php?pk=211257&T=0

Globally Unique Identifier (entire table): ba.freestatistics.org/blog/index.php?pk=211257&T=0

As an alternative you can also use a QR Code:  

The GUIDs for individual cells are displayed in the table below:

Summary of computational transaction
Raw Inputview raw input (R code)
Raw Outputview raw output of R engine
Computing time3 seconds
R Server'Gertrude Mary Cox' @ cox.wessa.net


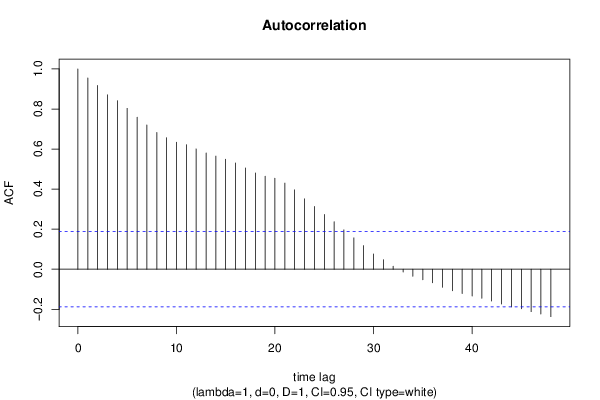
Autocorrelation Function
Time lag kACF(k)T-STATP-value
10.9548379.9230
20.9176789.53680
30.8705499.0470
40.8412258.74230
50.8031668.34670
60.759257.89040
70.7200987.48350
80.683087.09880
90.6568326.8260
100.6337096.58570
110.6212426.45610
120.6007496.24320
130.5803116.03080
140.5647425.8690
150.5489375.70470
160.5300695.50860
170.5052215.25040
180.4806524.99511e-06
190.4641544.82362e-06
200.453994.7184e-06
210.4299474.46811e-05
220.3962174.11763.8e-05
230.3512093.64990.000203
240.3128823.25160.000766
250.2731442.83860.002707
260.2368952.46190.007701
270.1964252.04130.021829
280.1565361.62680.05335
290.1176661.22280.112029
300.0762110.7920.215046
310.0474330.49290.311527
320.0148740.15460.43872
33-0.013901-0.14450.4427
34-0.034811-0.36180.359117
35-0.052717-0.54780.292463
36-0.067504-0.70150.242245
37-0.090085-0.93620.175632
38-0.107221-1.11430.133819
39-0.121522-1.26290.104674
40-0.133656-1.3890.083845
41-0.145006-1.50690.067372
42-0.15874-1.64970.050958
43-0.173695-1.80510.036923
44-0.188224-1.95610.026519
45-0.197612-2.05360.021213
46-0.212012-2.20330.014849
47-0.223453-2.32220.011049
48-0.23691-2.4620.007698

\begin{tabular}{lllllllll}
\hline
Autocorrelation Function \tabularnewline
Time lag k & ACF(k) & T-STAT & P-value \tabularnewline
1 & 0.954837 & 9.923 & 0 \tabularnewline
2 & 0.917678 & 9.5368 & 0 \tabularnewline
3 & 0.870549 & 9.047 & 0 \tabularnewline
4 & 0.841225 & 8.7423 & 0 \tabularnewline
5 & 0.803166 & 8.3467 & 0 \tabularnewline
6 & 0.75925 & 7.8904 & 0 \tabularnewline
7 & 0.720098 & 7.4835 & 0 \tabularnewline
8 & 0.68308 & 7.0988 & 0 \tabularnewline
9 & 0.656832 & 6.826 & 0 \tabularnewline
10 & 0.633709 & 6.5857 & 0 \tabularnewline
11 & 0.621242 & 6.4561 & 0 \tabularnewline
12 & 0.600749 & 6.2432 & 0 \tabularnewline
13 & 0.580311 & 6.0308 & 0 \tabularnewline
14 & 0.564742 & 5.869 & 0 \tabularnewline
15 & 0.548937 & 5.7047 & 0 \tabularnewline
16 & 0.530069 & 5.5086 & 0 \tabularnewline
17 & 0.505221 & 5.2504 & 0 \tabularnewline
18 & 0.480652 & 4.9951 & 1e-06 \tabularnewline
19 & 0.464154 & 4.8236 & 2e-06 \tabularnewline
20 & 0.45399 & 4.718 & 4e-06 \tabularnewline
21 & 0.429947 & 4.4681 & 1e-05 \tabularnewline
22 & 0.396217 & 4.1176 & 3.8e-05 \tabularnewline
23 & 0.351209 & 3.6499 & 0.000203 \tabularnewline
24 & 0.312882 & 3.2516 & 0.000766 \tabularnewline
25 & 0.273144 & 2.8386 & 0.002707 \tabularnewline
26 & 0.236895 & 2.4619 & 0.007701 \tabularnewline
27 & 0.196425 & 2.0413 & 0.021829 \tabularnewline
28 & 0.156536 & 1.6268 & 0.05335 \tabularnewline
29 & 0.117666 & 1.2228 & 0.112029 \tabularnewline
30 & 0.076211 & 0.792 & 0.215046 \tabularnewline
31 & 0.047433 & 0.4929 & 0.311527 \tabularnewline
32 & 0.014874 & 0.1546 & 0.43872 \tabularnewline
33 & -0.013901 & -0.1445 & 0.4427 \tabularnewline
34 & -0.034811 & -0.3618 & 0.359117 \tabularnewline
35 & -0.052717 & -0.5478 & 0.292463 \tabularnewline
36 & -0.067504 & -0.7015 & 0.242245 \tabularnewline
37 & -0.090085 & -0.9362 & 0.175632 \tabularnewline
38 & -0.107221 & -1.1143 & 0.133819 \tabularnewline
39 & -0.121522 & -1.2629 & 0.104674 \tabularnewline
40 & -0.133656 & -1.389 & 0.083845 \tabularnewline
41 & -0.145006 & -1.5069 & 0.067372 \tabularnewline
42 & -0.15874 & -1.6497 & 0.050958 \tabularnewline
43 & -0.173695 & -1.8051 & 0.036923 \tabularnewline
44 & -0.188224 & -1.9561 & 0.026519 \tabularnewline
45 & -0.197612 & -2.0536 & 0.021213 \tabularnewline
46 & -0.212012 & -2.2033 & 0.014849 \tabularnewline
47 & -0.223453 & -2.3222 & 0.011049 \tabularnewline
48 & -0.23691 & -2.462 & 0.007698 \tabularnewline
\hline
\end{tabular}
%Source: https://freestatistics.org/blog/index.php?pk=211257&T=1

[TABLE]
[ROW][C]Autocorrelation Function[/C][/ROW]
[ROW][C]Time lag k[/C][C]ACF(k)[/C][C]T-STAT[/C][C]P-value[/C][/ROW]
[ROW][C]1[/C][C]0.954837[/C][C]9.923[/C][C]0[/C][/ROW]
[ROW][C]2[/C][C]0.917678[/C][C]9.5368[/C][C]0[/C][/ROW]
[ROW][C]3[/C][C]0.870549[/C][C]9.047[/C][C]0[/C][/ROW]
[ROW][C]4[/C][C]0.841225[/C][C]8.7423[/C][C]0[/C][/ROW]
[ROW][C]5[/C][C]0.803166[/C][C]8.3467[/C][C]0[/C][/ROW]
[ROW][C]6[/C][C]0.75925[/C][C]7.8904[/C][C]0[/C][/ROW]
[ROW][C]7[/C][C]0.720098[/C][C]7.4835[/C][C]0[/C][/ROW]
[ROW][C]8[/C][C]0.68308[/C][C]7.0988[/C][C]0[/C][/ROW]
[ROW][C]9[/C][C]0.656832[/C][C]6.826[/C][C]0[/C][/ROW]
[ROW][C]10[/C][C]0.633709[/C][C]6.5857[/C][C]0[/C][/ROW]
[ROW][C]11[/C][C]0.621242[/C][C]6.4561[/C][C]0[/C][/ROW]
[ROW][C]12[/C][C]0.600749[/C][C]6.2432[/C][C]0[/C][/ROW]
[ROW][C]13[/C][C]0.580311[/C][C]6.0308[/C][C]0[/C][/ROW]
[ROW][C]14[/C][C]0.564742[/C][C]5.869[/C][C]0[/C][/ROW]
[ROW][C]15[/C][C]0.548937[/C][C]5.7047[/C][C]0[/C][/ROW]
[ROW][C]16[/C][C]0.530069[/C][C]5.5086[/C][C]0[/C][/ROW]
[ROW][C]17[/C][C]0.505221[/C][C]5.2504[/C][C]0[/C][/ROW]
[ROW][C]18[/C][C]0.480652[/C][C]4.9951[/C][C]1e-06[/C][/ROW]
[ROW][C]19[/C][C]0.464154[/C][C]4.8236[/C][C]2e-06[/C][/ROW]
[ROW][C]20[/C][C]0.45399[/C][C]4.718[/C][C]4e-06[/C][/ROW]
[ROW][C]21[/C][C]0.429947[/C][C]4.4681[/C][C]1e-05[/C][/ROW]
[ROW][C]22[/C][C]0.396217[/C][C]4.1176[/C][C]3.8e-05[/C][/ROW]
[ROW][C]23[/C][C]0.351209[/C][C]3.6499[/C][C]0.000203[/C][/ROW]
[ROW][C]24[/C][C]0.312882[/C][C]3.2516[/C][C]0.000766[/C][/ROW]
[ROW][C]25[/C][C]0.273144[/C][C]2.8386[/C][C]0.002707[/C][/ROW]
[ROW][C]26[/C][C]0.236895[/C][C]2.4619[/C][C]0.007701[/C][/ROW]
[ROW][C]27[/C][C]0.196425[/C][C]2.0413[/C][C]0.021829[/C][/ROW]
[ROW][C]28[/C][C]0.156536[/C][C]1.6268[/C][C]0.05335[/C][/ROW]
[ROW][C]29[/C][C]0.117666[/C][C]1.2228[/C][C]0.112029[/C][/ROW]
[ROW][C]30[/C][C]0.076211[/C][C]0.792[/C][C]0.215046[/C][/ROW]
[ROW][C]31[/C][C]0.047433[/C][C]0.4929[/C][C]0.311527[/C][/ROW]
[ROW][C]32[/C][C]0.014874[/C][C]0.1546[/C][C]0.43872[/C][/ROW]
[ROW][C]33[/C][C]-0.013901[/C][C]-0.1445[/C][C]0.4427[/C][/ROW]
[ROW][C]34[/C][C]-0.034811[/C][C]-0.3618[/C][C]0.359117[/C][/ROW]
[ROW][C]35[/C][C]-0.052717[/C][C]-0.5478[/C][C]0.292463[/C][/ROW]
[ROW][C]36[/C][C]-0.067504[/C][C]-0.7015[/C][C]0.242245[/C][/ROW]
[ROW][C]37[/C][C]-0.090085[/C][C]-0.9362[/C][C]0.175632[/C][/ROW]
[ROW][C]38[/C][C]-0.107221[/C][C]-1.1143[/C][C]0.133819[/C][/ROW]
[ROW][C]39[/C][C]-0.121522[/C][C]-1.2629[/C][C]0.104674[/C][/ROW]
[ROW][C]40[/C][C]-0.133656[/C][C]-1.389[/C][C]0.083845[/C][/ROW]
[ROW][C]41[/C][C]-0.145006[/C][C]-1.5069[/C][C]0.067372[/C][/ROW]
[ROW][C]42[/C][C]-0.15874[/C][C]-1.6497[/C][C]0.050958[/C][/ROW]
[ROW][C]43[/C][C]-0.173695[/C][C]-1.8051[/C][C]0.036923[/C][/ROW]
[ROW][C]44[/C][C]-0.188224[/C][C]-1.9561[/C][C]0.026519[/C][/ROW]
[ROW][C]45[/C][C]-0.197612[/C][C]-2.0536[/C][C]0.021213[/C][/ROW]
[ROW][C]46[/C][C]-0.212012[/C][C]-2.2033[/C][C]0.014849[/C][/ROW]
[ROW][C]47[/C][C]-0.223453[/C][C]-2.3222[/C][C]0.011049[/C][/ROW]
[ROW][C]48[/C][C]-0.23691[/C][C]-2.462[/C][C]0.007698[/C][/ROW]
[/TABLE]
Source: https://freestatistics.org/blog/index.php?pk=211257&T=1

Globally Unique Identifier (entire table): ba.freestatistics.org/blog/index.php?pk=211257&T=1

As an alternative you can also use a QR Code:  

The GUIDs for individual cells are displayed in the table below:

Autocorrelation Function
Time lag kACF(k)T-STATP-value
10.9548379.9230
20.9176789.53680
30.8705499.0470
40.8412258.74230
50.8031668.34670
60.759257.89040
70.7200987.48350
80.683087.09880
90.6568326.8260
100.6337096.58570
110.6212426.45610
120.6007496.24320
130.5803116.03080
140.5647425.8690
150.5489375.70470
160.5300695.50860
170.5052215.25040
180.4806524.99511e-06
190.4641544.82362e-06
200.453994.7184e-06
210.4299474.46811e-05
220.3962174.11763.8e-05
230.3512093.64990.000203
240.3128823.25160.000766
250.2731442.83860.002707
260.2368952.46190.007701
270.1964252.04130.021829
280.1565361.62680.05335
290.1176661.22280.112029
300.0762110.7920.215046
310.0474330.49290.311527
320.0148740.15460.43872
33-0.013901-0.14450.4427
34-0.034811-0.36180.359117
35-0.052717-0.54780.292463
36-0.067504-0.70150.242245
37-0.090085-0.93620.175632
38-0.107221-1.11430.133819
39-0.121522-1.26290.104674
40-0.133656-1.3890.083845
41-0.145006-1.50690.067372
42-0.15874-1.64970.050958
43-0.173695-1.80510.036923
44-0.188224-1.95610.026519
45-0.197612-2.05360.021213
46-0.212012-2.20330.014849
47-0.223453-2.32220.011049
48-0.23691-2.4620.007698


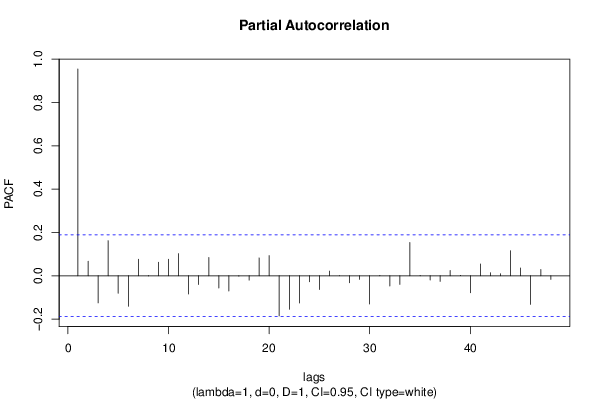
Partial Autocorrelation Function
Time lag kPACF(k)T-STATP-value
10.9548379.9230
20.0675580.70210.242069
3-0.125106-1.30010.09816
40.1622311.6860.047346
5-0.08052-0.83680.202281
6-0.140303-1.45810.073862
70.0765680.79570.213972
8-0.000963-0.010.496018
90.0629460.65420.257203
100.0765980.7960.213882
110.102321.06330.144999
12-0.084384-0.87690.191231
13-0.040119-0.41690.338778
140.0847850.88110.190108
15-0.056558-0.58780.278959
16-0.069981-0.72730.23432
17-0.00174-0.01810.492803
18-0.020033-0.20820.417736
190.0826270.85870.196209
200.0930910.96740.167745
21-0.185054-1.92310.028548
22-0.154529-1.60590.055607
23-0.125556-1.30480.097365
24-0.027677-0.28760.38709
25-0.063231-0.65710.256253
260.0216210.22470.411321
27-0.000509-0.00530.497893
28-0.032332-0.3360.368761
29-0.016745-0.1740.431087
30-0.129956-1.35050.089832
310.0016020.01670.493372
32-0.047267-0.49120.312137
33-0.039753-0.41310.340169
340.1540191.60060.056193
350.0015090.01570.493759
36-0.019235-0.19990.42097
37-0.025792-0.2680.394589
380.0248780.25850.39824
390.0006860.00710.497163
40-0.078432-0.81510.208407
410.0542960.56430.286872
420.0141910.14750.441515
430.009590.09970.460397
440.1156671.2020.115988
450.0361260.37540.354037
46-0.131791-1.36960.086825
470.0293590.30510.380435
48-0.016615-0.17270.431618

\begin{tabular}{lllllllll}
\hline
Partial Autocorrelation Function \tabularnewline
Time lag k & PACF(k) & T-STAT & P-value \tabularnewline
1 & 0.954837 & 9.923 & 0 \tabularnewline
2 & 0.067558 & 0.7021 & 0.242069 \tabularnewline
3 & -0.125106 & -1.3001 & 0.09816 \tabularnewline
4 & 0.162231 & 1.686 & 0.047346 \tabularnewline
5 & -0.08052 & -0.8368 & 0.202281 \tabularnewline
6 & -0.140303 & -1.4581 & 0.073862 \tabularnewline
7 & 0.076568 & 0.7957 & 0.213972 \tabularnewline
8 & -0.000963 & -0.01 & 0.496018 \tabularnewline
9 & 0.062946 & 0.6542 & 0.257203 \tabularnewline
10 & 0.076598 & 0.796 & 0.213882 \tabularnewline
11 & 0.10232 & 1.0633 & 0.144999 \tabularnewline
12 & -0.084384 & -0.8769 & 0.191231 \tabularnewline
13 & -0.040119 & -0.4169 & 0.338778 \tabularnewline
14 & 0.084785 & 0.8811 & 0.190108 \tabularnewline
15 & -0.056558 & -0.5878 & 0.278959 \tabularnewline
16 & -0.069981 & -0.7273 & 0.23432 \tabularnewline
17 & -0.00174 & -0.0181 & 0.492803 \tabularnewline
18 & -0.020033 & -0.2082 & 0.417736 \tabularnewline
19 & 0.082627 & 0.8587 & 0.196209 \tabularnewline
20 & 0.093091 & 0.9674 & 0.167745 \tabularnewline
21 & -0.185054 & -1.9231 & 0.028548 \tabularnewline
22 & -0.154529 & -1.6059 & 0.055607 \tabularnewline
23 & -0.125556 & -1.3048 & 0.097365 \tabularnewline
24 & -0.027677 & -0.2876 & 0.38709 \tabularnewline
25 & -0.063231 & -0.6571 & 0.256253 \tabularnewline
26 & 0.021621 & 0.2247 & 0.411321 \tabularnewline
27 & -0.000509 & -0.0053 & 0.497893 \tabularnewline
28 & -0.032332 & -0.336 & 0.368761 \tabularnewline
29 & -0.016745 & -0.174 & 0.431087 \tabularnewline
30 & -0.129956 & -1.3505 & 0.089832 \tabularnewline
31 & 0.001602 & 0.0167 & 0.493372 \tabularnewline
32 & -0.047267 & -0.4912 & 0.312137 \tabularnewline
33 & -0.039753 & -0.4131 & 0.340169 \tabularnewline
34 & 0.154019 & 1.6006 & 0.056193 \tabularnewline
35 & 0.001509 & 0.0157 & 0.493759 \tabularnewline
36 & -0.019235 & -0.1999 & 0.42097 \tabularnewline
37 & -0.025792 & -0.268 & 0.394589 \tabularnewline
38 & 0.024878 & 0.2585 & 0.39824 \tabularnewline
39 & 0.000686 & 0.0071 & 0.497163 \tabularnewline
40 & -0.078432 & -0.8151 & 0.208407 \tabularnewline
41 & 0.054296 & 0.5643 & 0.286872 \tabularnewline
42 & 0.014191 & 0.1475 & 0.441515 \tabularnewline
43 & 0.00959 & 0.0997 & 0.460397 \tabularnewline
44 & 0.115667 & 1.202 & 0.115988 \tabularnewline
45 & 0.036126 & 0.3754 & 0.354037 \tabularnewline
46 & -0.131791 & -1.3696 & 0.086825 \tabularnewline
47 & 0.029359 & 0.3051 & 0.380435 \tabularnewline
48 & -0.016615 & -0.1727 & 0.431618 \tabularnewline
\hline
\end{tabular}
%Source: https://freestatistics.org/blog/index.php?pk=211257&T=2

[TABLE]
[ROW][C]Partial Autocorrelation Function[/C][/ROW]
[ROW][C]Time lag k[/C][C]PACF(k)[/C][C]T-STAT[/C][C]P-value[/C][/ROW]
[ROW][C]1[/C][C]0.954837[/C][C]9.923[/C][C]0[/C][/ROW]
[ROW][C]2[/C][C]0.067558[/C][C]0.7021[/C][C]0.242069[/C][/ROW]
[ROW][C]3[/C][C]-0.125106[/C][C]-1.3001[/C][C]0.09816[/C][/ROW]
[ROW][C]4[/C][C]0.162231[/C][C]1.686[/C][C]0.047346[/C][/ROW]
[ROW][C]5[/C][C]-0.08052[/C][C]-0.8368[/C][C]0.202281[/C][/ROW]
[ROW][C]6[/C][C]-0.140303[/C][C]-1.4581[/C][C]0.073862[/C][/ROW]
[ROW][C]7[/C][C]0.076568[/C][C]0.7957[/C][C]0.213972[/C][/ROW]
[ROW][C]8[/C][C]-0.000963[/C][C]-0.01[/C][C]0.496018[/C][/ROW]
[ROW][C]9[/C][C]0.062946[/C][C]0.6542[/C][C]0.257203[/C][/ROW]
[ROW][C]10[/C][C]0.076598[/C][C]0.796[/C][C]0.213882[/C][/ROW]
[ROW][C]11[/C][C]0.10232[/C][C]1.0633[/C][C]0.144999[/C][/ROW]
[ROW][C]12[/C][C]-0.084384[/C][C]-0.8769[/C][C]0.191231[/C][/ROW]
[ROW][C]13[/C][C]-0.040119[/C][C]-0.4169[/C][C]0.338778[/C][/ROW]
[ROW][C]14[/C][C]0.084785[/C][C]0.8811[/C][C]0.190108[/C][/ROW]
[ROW][C]15[/C][C]-0.056558[/C][C]-0.5878[/C][C]0.278959[/C][/ROW]
[ROW][C]16[/C][C]-0.069981[/C][C]-0.7273[/C][C]0.23432[/C][/ROW]
[ROW][C]17[/C][C]-0.00174[/C][C]-0.0181[/C][C]0.492803[/C][/ROW]
[ROW][C]18[/C][C]-0.020033[/C][C]-0.2082[/C][C]0.417736[/C][/ROW]
[ROW][C]19[/C][C]0.082627[/C][C]0.8587[/C][C]0.196209[/C][/ROW]
[ROW][C]20[/C][C]0.093091[/C][C]0.9674[/C][C]0.167745[/C][/ROW]
[ROW][C]21[/C][C]-0.185054[/C][C]-1.9231[/C][C]0.028548[/C][/ROW]
[ROW][C]22[/C][C]-0.154529[/C][C]-1.6059[/C][C]0.055607[/C][/ROW]
[ROW][C]23[/C][C]-0.125556[/C][C]-1.3048[/C][C]0.097365[/C][/ROW]
[ROW][C]24[/C][C]-0.027677[/C][C]-0.2876[/C][C]0.38709[/C][/ROW]
[ROW][C]25[/C][C]-0.063231[/C][C]-0.6571[/C][C]0.256253[/C][/ROW]
[ROW][C]26[/C][C]0.021621[/C][C]0.2247[/C][C]0.411321[/C][/ROW]
[ROW][C]27[/C][C]-0.000509[/C][C]-0.0053[/C][C]0.497893[/C][/ROW]
[ROW][C]28[/C][C]-0.032332[/C][C]-0.336[/C][C]0.368761[/C][/ROW]
[ROW][C]29[/C][C]-0.016745[/C][C]-0.174[/C][C]0.431087[/C][/ROW]
[ROW][C]30[/C][C]-0.129956[/C][C]-1.3505[/C][C]0.089832[/C][/ROW]
[ROW][C]31[/C][C]0.001602[/C][C]0.0167[/C][C]0.493372[/C][/ROW]
[ROW][C]32[/C][C]-0.047267[/C][C]-0.4912[/C][C]0.312137[/C][/ROW]
[ROW][C]33[/C][C]-0.039753[/C][C]-0.4131[/C][C]0.340169[/C][/ROW]
[ROW][C]34[/C][C]0.154019[/C][C]1.6006[/C][C]0.056193[/C][/ROW]
[ROW][C]35[/C][C]0.001509[/C][C]0.0157[/C][C]0.493759[/C][/ROW]
[ROW][C]36[/C][C]-0.019235[/C][C]-0.1999[/C][C]0.42097[/C][/ROW]
[ROW][C]37[/C][C]-0.025792[/C][C]-0.268[/C][C]0.394589[/C][/ROW]
[ROW][C]38[/C][C]0.024878[/C][C]0.2585[/C][C]0.39824[/C][/ROW]
[ROW][C]39[/C][C]0.000686[/C][C]0.0071[/C][C]0.497163[/C][/ROW]
[ROW][C]40[/C][C]-0.078432[/C][C]-0.8151[/C][C]0.208407[/C][/ROW]
[ROW][C]41[/C][C]0.054296[/C][C]0.5643[/C][C]0.286872[/C][/ROW]
[ROW][C]42[/C][C]0.014191[/C][C]0.1475[/C][C]0.441515[/C][/ROW]
[ROW][C]43[/C][C]0.00959[/C][C]0.0997[/C][C]0.460397[/C][/ROW]
[ROW][C]44[/C][C]0.115667[/C][C]1.202[/C][C]0.115988[/C][/ROW]
[ROW][C]45[/C][C]0.036126[/C][C]0.3754[/C][C]0.354037[/C][/ROW]
[ROW][C]46[/C][C]-0.131791[/C][C]-1.3696[/C][C]0.086825[/C][/ROW]
[ROW][C]47[/C][C]0.029359[/C][C]0.3051[/C][C]0.380435[/C][/ROW]
[ROW][C]48[/C][C]-0.016615[/C][C]-0.1727[/C][C]0.431618[/C][/ROW]
[/TABLE]
Source: https://freestatistics.org/blog/index.php?pk=211257&T=2

Globally Unique Identifier (entire table): ba.freestatistics.org/blog/index.php?pk=211257&T=2

As an alternative you can also use a QR Code:  

The GUIDs for individual cells are displayed in the table below:

Partial Autocorrelation Function
Time lag kPACF(k)T-STATP-value
10.9548379.9230
20.0675580.70210.242069
3-0.125106-1.30010.09816
40.1622311.6860.047346
5-0.08052-0.83680.202281
6-0.140303-1.45810.073862
70.0765680.79570.213972
8-0.000963-0.010.496018
90.0629460.65420.257203
100.0765980.7960.213882
110.102321.06330.144999
12-0.084384-0.87690.191231
13-0.040119-0.41690.338778
140.0847850.88110.190108
15-0.056558-0.58780.278959
16-0.069981-0.72730.23432
17-0.00174-0.01810.492803
18-0.020033-0.20820.417736
190.0826270.85870.196209
200.0930910.96740.167745
21-0.185054-1.92310.028548
22-0.154529-1.60590.055607
23-0.125556-1.30480.097365
24-0.027677-0.28760.38709
25-0.063231-0.65710.256253
260.0216210.22470.411321
27-0.000509-0.00530.497893
28-0.032332-0.3360.368761
29-0.016745-0.1740.431087
30-0.129956-1.35050.089832
310.0016020.01670.493372
32-0.047267-0.49120.312137
33-0.039753-0.41310.340169
340.1540191.60060.056193
350.0015090.01570.493759
36-0.019235-0.19990.42097
37-0.025792-0.2680.394589
380.0248780.25850.39824
390.0006860.00710.497163
40-0.078432-0.81510.208407
410.0542960.56430.286872
420.0141910.14750.441515
430.009590.09970.460397
440.1156671.2020.115988
450.0361260.37540.354037
46-0.131791-1.36960.086825
470.0293590.30510.380435
48-0.016615-0.17270.431618


Parameters (Session):
par1 = 0.1 ; par2 = 0.9 ; par3 = 0.1 ;
Parameters (R input):
par1 = 48 ; par2 = 1 ; par3 = 0 ; par4 = 1 ; par5 = 12 ; par6 = White Noise ; par7 = 0.95 ; par8 = ;
R code (references can be found in the software module):
par8 <- ''
par7 <- '0.95'
par6 <- 'White Noise'
par5 <- '12'
par4 <- '0'
par3 <- '0'
par2 <- '1'
par1 <- '48'
if (par1 == 'Default') {
par1 = 10*log10(length(x))
} else {
par1 <- as.numeric(par1)
}
par2 <- as.numeric(par2)
par3 <- as.numeric(par3)
par4 <- as.numeric(par4)
par5 <- as.numeric(par5)
if (par6 == 'White Noise') par6 <- 'white' else par6 <- 'ma'
par7 <- as.numeric(par7)
if (par8 != '') par8 <- as.numeric(par8)
ox <- x
if (par8 == '') {
if (par2 == 0) {
x <- log(x)
} else {
x <- (x ^ par2 - 1) / par2
}
} else {
x <- log(x,base=par8)
}
if (par3 > 0) x <- diff(x,lag=1,difference=par3)
if (par4 > 0) x <- diff(x,lag=par5,difference=par4)
bitmap(file='picts.png')
op <- par(mfrow=c(2,1))
plot(ox,type='l',main='Original Time Series',xlab='time',ylab='value')
if (par8=='') {
mytitle <- paste('Working Time Series (lambda=',par2,', d=',par3,', D=',par4,')',sep='')
mysub <- paste('(lambda=',par2,', d=',par3,', D=',par4,', CI=', par7, ', CI type=',par6,')',sep='')
} else {
mytitle <- paste('Working Time Series (base=',par8,', d=',par3,', D=',par4,')',sep='')
mysub <- paste('(base=',par8,', d=',par3,', D=',par4,', CI=', par7, ', CI type=',par6,')',sep='')
}
plot(x,type='l', main=mytitle,xlab='time',ylab='value')
par(op)
dev.off()
bitmap(file='pic1.png')
racf <- acf(x, par1, main='Autocorrelation', xlab='time lag', ylab='ACF', ci.type=par6, ci=par7, sub=mysub)
dev.off()
bitmap(file='pic2.png')
rpacf <- pacf(x,par1,main='Partial Autocorrelation',xlab='lags',ylab='PACF',sub=mysub)
dev.off()
(myacf <- c(racf$acf))
(mypacf <- c(rpacf$acf))
lengthx <- length(x)
sqrtn <- sqrt(lengthx)
load(file='createtable')
a<-table.start()
a<-table.row.start(a)
a<-table.element(a,'Autocorrelation Function',4,TRUE)
a<-table.row.end(a)
a<-table.row.start(a)
a<-table.element(a,'Time lag k',header=TRUE)
a<-table.element(a,hyperlink('basics.htm','ACF(k)','click here for more information about the Autocorrelation Function'),header=TRUE)
a<-table.element(a,'T-STAT',header=TRUE)
a<-table.element(a,'P-value',header=TRUE)
a<-table.row.end(a)
for (i in 2:(par1+1)) {
a<-table.row.start(a)
a<-table.element(a,i-1,header=TRUE)
a<-table.element(a,round(myacf[i],6))
mytstat <- myacf[i]*sqrtn
a<-table.element(a,round(mytstat,4))
a<-table.element(a,round(1-pt(abs(mytstat),lengthx),6))
a<-table.row.end(a)
}
a<-table.end(a)
table.save(a,file='mytable.tab')
a<-table.start()
a<-table.row.start(a)
a<-table.element(a,'Partial Autocorrelation Function',4,TRUE)
a<-table.row.end(a)
a<-table.row.start(a)
a<-table.element(a,'Time lag k',header=TRUE)
a<-table.element(a,hyperlink('basics.htm','PACF(k)','click here for more information about the Partial Autocorrelation Function'),header=TRUE)
a<-table.element(a,'T-STAT',header=TRUE)
a<-table.element(a,'P-value',header=TRUE)
a<-table.row.end(a)
for (i in 1:par1) {
a<-table.row.start(a)
a<-table.element(a,i,header=TRUE)
a<-table.element(a,round(mypacf[i],6))
mytstat <- mypacf[i]*sqrtn
a<-table.element(a,round(mytstat,4))
a<-table.element(a,round(1-pt(abs(mytstat),lengthx),6))
a<-table.row.end(a)
}
a<-table.end(a)
table.save(a,file='mytable1.tab')