Free Statistics

of Irreproducible Research!

Author's title

Author*Unverified author*
R Software Modulerwasp_autocorrelation.wasp
Title produced by software(Partial) Autocorrelation Function
Date of computationTue, 20 Aug 2013 20:01:39 -0400
Cite this page as followsStatistical Computations at FreeStatistics.org, Office for Research Development and Education, URL https://freestatistics.org/blog/index.php?v=date/2013/Aug/20/t1377043586cp9ms70xm8r6u74.htm/, Retrieved Sat, 27 Apr 2024 08:42:10 +0000
Statistical Computations at FreeStatistics.org, Office for Research Development and Education, URL https://freestatistics.org/blog/index.php?pk=211267, Retrieved Sat, 27 Apr 2024 08:42:10 +0000
QR Codes:

Original text written by user:
IsPrivate?No (this computation is public)
User-defined keywordsRaedts Mathias
Estimated Impact85
Family? (F = Feedback message, R = changed R code, M = changed R Module, P = changed Parameters, D = changed Data)
-       [(Partial) Autocorrelation Function] [Tijdreeks A - Sta...] [2013-08-21 00:01:39] [e2e43c39163d7563005e2a800525cced] [Current]
Feedback Forum

Post a new message
Dataseries X:
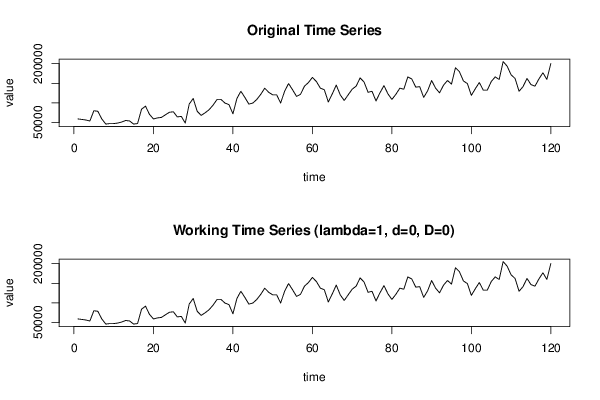
58896
57616
56232
53708
79784
78524
58896
45848
47112
47112
48372
51040
54968
53708
45848
47112
83716
91572
70664
58896
61548
62828
69404
75856
77260
64088
65476
48372
96888
111200
78524
68016
74596
82452
94220
108656
108656
99412
95484
71928
111200
129564
113848
96888
99412
108656
121704
137420
126896
120444
120444
99412
129564
149188
133492
116516
121704
142612
151856
164888
154380
137420
133492
102080
122968
145260
120444
106008
120444
134756
142612
163624
153120
126896
129564
104744
125636
144000
122968
108656
121704
137420
134756
166168
160976
140068
141332
113848
130824
157048
137420
125636
145260
157048
147928
189724
179340
155784
149188
119056
136140
151856
132212
132212
154380
166168
159696
205420
193652
171484
162240
129564
141332
162240
146524
142612
160976
176672
159696
200228


Summary of computational transaction
Raw Inputview raw input (R code)
Raw Outputview raw output of R engine
Computing time2 seconds
R Server'George Udny Yule' @ yule.wessa.net

\begin{tabular}{lllllllll}
\hline
Summary of computational transaction \tabularnewline
Raw Input & view raw input (R code)  \tabularnewline
Raw Output & view raw output of R engine  \tabularnewline
Computing time & 2 seconds \tabularnewline
R Server & 'George Udny Yule' @ yule.wessa.net \tabularnewline
\hline
\end{tabular}
%Source: https://freestatistics.org/blog/index.php?pk=211267&T=0

[TABLE]
[ROW][C]Summary of computational transaction[/C][/ROW]
[ROW][C]Raw Input[/C][C]view raw input (R code) [/C][/ROW]
[ROW][C]Raw Output[/C][C]view raw output of R engine [/C][/ROW]
[ROW][C]Computing time[/C][C]2 seconds[/C][/ROW]
[ROW][C]R Server[/C][C]'George Udny Yule' @ yule.wessa.net[/C][/ROW]
[/TABLE]
Source: https://freestatistics.org/blog/index.php?pk=211267&T=0

Globally Unique Identifier (entire table): ba.freestatistics.org/blog/index.php?pk=211267&T=0

As an alternative you can also use a QR Code:  

The GUIDs for individual cells are displayed in the table below:

Summary of computational transaction
Raw Inputview raw input (R code)
Raw Outputview raw output of R engine
Computing time2 seconds
R Server'George Udny Yule' @ yule.wessa.net


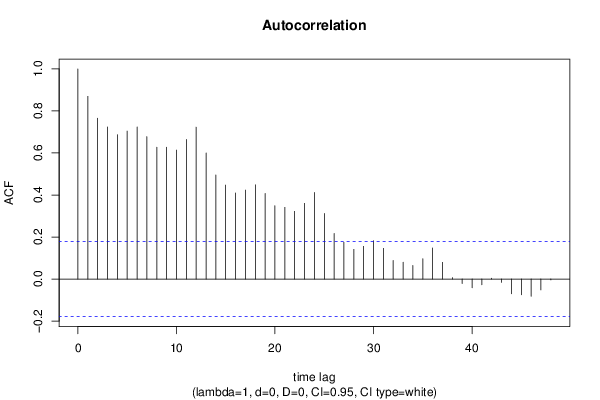
Autocorrelation Function
Time lag kACF(k)T-STATP-value
10.8693969.52380
20.7655398.38610
30.7234517.9250
40.6869497.52520
50.7041367.71340
60.7237887.92870
70.6777777.42470
80.6272066.87070
90.6274676.87360
100.6137866.72370
110.6640127.27390
120.7229787.91980
130.6004016.57710
140.4949685.42210
150.4472464.89932e-06
160.4097244.48838e-06
170.4234844.6394e-06
180.4483454.91141e-06
190.4073354.46219e-06
200.3487523.82040.000106
210.3413683.73950.000142
220.322113.52850.000297
230.3603843.94786.7e-05
240.4124174.51787e-06
250.3117333.41490.000436
260.2168062.3750.009567
270.175291.92020.028602
280.1413181.54810.06212
290.1555481.70390.04549
300.1822051.9960.024102
310.1462611.60220.055869
320.0882580.96680.167791
330.0801050.87750.190984
340.0645920.70760.240292
350.0968591.0610.145401
360.1477741.61880.05406
370.0795050.87090.192766
380.006880.07540.470023
39-0.021283-0.23310.408023
40-0.041528-0.45490.324997
41-0.026787-0.29340.384847
420.0035060.03840.484714
43-0.01582-0.17330.431354
44-0.069877-0.76550.222749
45-0.07476-0.8190.207219
46-0.081933-0.89750.185615
47-0.051566-0.56490.286606
48-0.00412-0.04510.482039

\begin{tabular}{lllllllll}
\hline
Autocorrelation Function \tabularnewline
Time lag k & ACF(k) & T-STAT & P-value \tabularnewline
1 & 0.869396 & 9.5238 & 0 \tabularnewline
2 & 0.765539 & 8.3861 & 0 \tabularnewline
3 & 0.723451 & 7.925 & 0 \tabularnewline
4 & 0.686949 & 7.5252 & 0 \tabularnewline
5 & 0.704136 & 7.7134 & 0 \tabularnewline
6 & 0.723788 & 7.9287 & 0 \tabularnewline
7 & 0.677777 & 7.4247 & 0 \tabularnewline
8 & 0.627206 & 6.8707 & 0 \tabularnewline
9 & 0.627467 & 6.8736 & 0 \tabularnewline
10 & 0.613786 & 6.7237 & 0 \tabularnewline
11 & 0.664012 & 7.2739 & 0 \tabularnewline
12 & 0.722978 & 7.9198 & 0 \tabularnewline
13 & 0.600401 & 6.5771 & 0 \tabularnewline
14 & 0.494968 & 5.4221 & 0 \tabularnewline
15 & 0.447246 & 4.8993 & 2e-06 \tabularnewline
16 & 0.409724 & 4.4883 & 8e-06 \tabularnewline
17 & 0.423484 & 4.639 & 4e-06 \tabularnewline
18 & 0.448345 & 4.9114 & 1e-06 \tabularnewline
19 & 0.407335 & 4.4621 & 9e-06 \tabularnewline
20 & 0.348752 & 3.8204 & 0.000106 \tabularnewline
21 & 0.341368 & 3.7395 & 0.000142 \tabularnewline
22 & 0.32211 & 3.5285 & 0.000297 \tabularnewline
23 & 0.360384 & 3.9478 & 6.7e-05 \tabularnewline
24 & 0.412417 & 4.5178 & 7e-06 \tabularnewline
25 & 0.311733 & 3.4149 & 0.000436 \tabularnewline
26 & 0.216806 & 2.375 & 0.009567 \tabularnewline
27 & 0.17529 & 1.9202 & 0.028602 \tabularnewline
28 & 0.141318 & 1.5481 & 0.06212 \tabularnewline
29 & 0.155548 & 1.7039 & 0.04549 \tabularnewline
30 & 0.182205 & 1.996 & 0.024102 \tabularnewline
31 & 0.146261 & 1.6022 & 0.055869 \tabularnewline
32 & 0.088258 & 0.9668 & 0.167791 \tabularnewline
33 & 0.080105 & 0.8775 & 0.190984 \tabularnewline
34 & 0.064592 & 0.7076 & 0.240292 \tabularnewline
35 & 0.096859 & 1.061 & 0.145401 \tabularnewline
36 & 0.147774 & 1.6188 & 0.05406 \tabularnewline
37 & 0.079505 & 0.8709 & 0.192766 \tabularnewline
38 & 0.00688 & 0.0754 & 0.470023 \tabularnewline
39 & -0.021283 & -0.2331 & 0.408023 \tabularnewline
40 & -0.041528 & -0.4549 & 0.324997 \tabularnewline
41 & -0.026787 & -0.2934 & 0.384847 \tabularnewline
42 & 0.003506 & 0.0384 & 0.484714 \tabularnewline
43 & -0.01582 & -0.1733 & 0.431354 \tabularnewline
44 & -0.069877 & -0.7655 & 0.222749 \tabularnewline
45 & -0.07476 & -0.819 & 0.207219 \tabularnewline
46 & -0.081933 & -0.8975 & 0.185615 \tabularnewline
47 & -0.051566 & -0.5649 & 0.286606 \tabularnewline
48 & -0.00412 & -0.0451 & 0.482039 \tabularnewline
\hline
\end{tabular}
%Source: https://freestatistics.org/blog/index.php?pk=211267&T=1

[TABLE]
[ROW][C]Autocorrelation Function[/C][/ROW]
[ROW][C]Time lag k[/C][C]ACF(k)[/C][C]T-STAT[/C][C]P-value[/C][/ROW]
[ROW][C]1[/C][C]0.869396[/C][C]9.5238[/C][C]0[/C][/ROW]
[ROW][C]2[/C][C]0.765539[/C][C]8.3861[/C][C]0[/C][/ROW]
[ROW][C]3[/C][C]0.723451[/C][C]7.925[/C][C]0[/C][/ROW]
[ROW][C]4[/C][C]0.686949[/C][C]7.5252[/C][C]0[/C][/ROW]
[ROW][C]5[/C][C]0.704136[/C][C]7.7134[/C][C]0[/C][/ROW]
[ROW][C]6[/C][C]0.723788[/C][C]7.9287[/C][C]0[/C][/ROW]
[ROW][C]7[/C][C]0.677777[/C][C]7.4247[/C][C]0[/C][/ROW]
[ROW][C]8[/C][C]0.627206[/C][C]6.8707[/C][C]0[/C][/ROW]
[ROW][C]9[/C][C]0.627467[/C][C]6.8736[/C][C]0[/C][/ROW]
[ROW][C]10[/C][C]0.613786[/C][C]6.7237[/C][C]0[/C][/ROW]
[ROW][C]11[/C][C]0.664012[/C][C]7.2739[/C][C]0[/C][/ROW]
[ROW][C]12[/C][C]0.722978[/C][C]7.9198[/C][C]0[/C][/ROW]
[ROW][C]13[/C][C]0.600401[/C][C]6.5771[/C][C]0[/C][/ROW]
[ROW][C]14[/C][C]0.494968[/C][C]5.4221[/C][C]0[/C][/ROW]
[ROW][C]15[/C][C]0.447246[/C][C]4.8993[/C][C]2e-06[/C][/ROW]
[ROW][C]16[/C][C]0.409724[/C][C]4.4883[/C][C]8e-06[/C][/ROW]
[ROW][C]17[/C][C]0.423484[/C][C]4.639[/C][C]4e-06[/C][/ROW]
[ROW][C]18[/C][C]0.448345[/C][C]4.9114[/C][C]1e-06[/C][/ROW]
[ROW][C]19[/C][C]0.407335[/C][C]4.4621[/C][C]9e-06[/C][/ROW]
[ROW][C]20[/C][C]0.348752[/C][C]3.8204[/C][C]0.000106[/C][/ROW]
[ROW][C]21[/C][C]0.341368[/C][C]3.7395[/C][C]0.000142[/C][/ROW]
[ROW][C]22[/C][C]0.32211[/C][C]3.5285[/C][C]0.000297[/C][/ROW]
[ROW][C]23[/C][C]0.360384[/C][C]3.9478[/C][C]6.7e-05[/C][/ROW]
[ROW][C]24[/C][C]0.412417[/C][C]4.5178[/C][C]7e-06[/C][/ROW]
[ROW][C]25[/C][C]0.311733[/C][C]3.4149[/C][C]0.000436[/C][/ROW]
[ROW][C]26[/C][C]0.216806[/C][C]2.375[/C][C]0.009567[/C][/ROW]
[ROW][C]27[/C][C]0.17529[/C][C]1.9202[/C][C]0.028602[/C][/ROW]
[ROW][C]28[/C][C]0.141318[/C][C]1.5481[/C][C]0.06212[/C][/ROW]
[ROW][C]29[/C][C]0.155548[/C][C]1.7039[/C][C]0.04549[/C][/ROW]
[ROW][C]30[/C][C]0.182205[/C][C]1.996[/C][C]0.024102[/C][/ROW]
[ROW][C]31[/C][C]0.146261[/C][C]1.6022[/C][C]0.055869[/C][/ROW]
[ROW][C]32[/C][C]0.088258[/C][C]0.9668[/C][C]0.167791[/C][/ROW]
[ROW][C]33[/C][C]0.080105[/C][C]0.8775[/C][C]0.190984[/C][/ROW]
[ROW][C]34[/C][C]0.064592[/C][C]0.7076[/C][C]0.240292[/C][/ROW]
[ROW][C]35[/C][C]0.096859[/C][C]1.061[/C][C]0.145401[/C][/ROW]
[ROW][C]36[/C][C]0.147774[/C][C]1.6188[/C][C]0.05406[/C][/ROW]
[ROW][C]37[/C][C]0.079505[/C][C]0.8709[/C][C]0.192766[/C][/ROW]
[ROW][C]38[/C][C]0.00688[/C][C]0.0754[/C][C]0.470023[/C][/ROW]
[ROW][C]39[/C][C]-0.021283[/C][C]-0.2331[/C][C]0.408023[/C][/ROW]
[ROW][C]40[/C][C]-0.041528[/C][C]-0.4549[/C][C]0.324997[/C][/ROW]
[ROW][C]41[/C][C]-0.026787[/C][C]-0.2934[/C][C]0.384847[/C][/ROW]
[ROW][C]42[/C][C]0.003506[/C][C]0.0384[/C][C]0.484714[/C][/ROW]
[ROW][C]43[/C][C]-0.01582[/C][C]-0.1733[/C][C]0.431354[/C][/ROW]
[ROW][C]44[/C][C]-0.069877[/C][C]-0.7655[/C][C]0.222749[/C][/ROW]
[ROW][C]45[/C][C]-0.07476[/C][C]-0.819[/C][C]0.207219[/C][/ROW]
[ROW][C]46[/C][C]-0.081933[/C][C]-0.8975[/C][C]0.185615[/C][/ROW]
[ROW][C]47[/C][C]-0.051566[/C][C]-0.5649[/C][C]0.286606[/C][/ROW]
[ROW][C]48[/C][C]-0.00412[/C][C]-0.0451[/C][C]0.482039[/C][/ROW]
[/TABLE]
Source: https://freestatistics.org/blog/index.php?pk=211267&T=1

Globally Unique Identifier (entire table): ba.freestatistics.org/blog/index.php?pk=211267&T=1

As an alternative you can also use a QR Code:  

The GUIDs for individual cells are displayed in the table below:

Autocorrelation Function
Time lag kACF(k)T-STATP-value
10.8693969.52380
20.7655398.38610
30.7234517.9250
40.6869497.52520
50.7041367.71340
60.7237887.92870
70.6777777.42470
80.6272066.87070
90.6274676.87360
100.6137866.72370
110.6640127.27390
120.7229787.91980
130.6004016.57710
140.4949685.42210
150.4472464.89932e-06
160.4097244.48838e-06
170.4234844.6394e-06
180.4483454.91141e-06
190.4073354.46219e-06
200.3487523.82040.000106
210.3413683.73950.000142
220.322113.52850.000297
230.3603843.94786.7e-05
240.4124174.51787e-06
250.3117333.41490.000436
260.2168062.3750.009567
270.175291.92020.028602
280.1413181.54810.06212
290.1555481.70390.04549
300.1822051.9960.024102
310.1462611.60220.055869
320.0882580.96680.167791
330.0801050.87750.190984
340.0645920.70760.240292
350.0968591.0610.145401
360.1477741.61880.05406
370.0795050.87090.192766
380.006880.07540.470023
39-0.021283-0.23310.408023
40-0.041528-0.45490.324997
41-0.026787-0.29340.384847
420.0035060.03840.484714
43-0.01582-0.17330.431354
44-0.069877-0.76550.222749
45-0.07476-0.8190.207219
46-0.081933-0.89750.185615
47-0.051566-0.56490.286606
48-0.00412-0.04510.482039


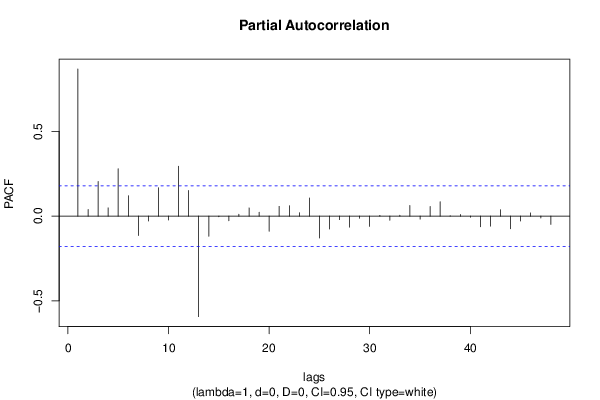
Partial Autocorrelation Function
Time lag kPACF(k)T-STATP-value
10.8693969.52380
20.0396850.43470.332271
30.2043132.23810.013528
40.0487450.5340.297172
50.2796213.06310.001352
60.1203751.31860.094901
7-0.114178-1.25080.106729
8-0.02916-0.31940.374977
90.1672941.83260.034669
10-0.022763-0.24940.401755
110.2945783.22690.000807
120.1510911.65510.050256
13-0.593769-6.50440
14-0.118956-1.30310.097518
15-0.003852-0.04220.483205
16-0.027315-0.29920.382645
170.0106670.11690.453585
180.0486080.53250.297691
190.0228460.25030.401406
20-0.089413-0.97950.164659
210.0578970.63420.26357
220.0614470.67310.251085
230.0201760.2210.412729
240.1066891.16870.122416
25-0.129249-1.41590.079705
26-0.076162-0.83430.202881
27-0.020823-0.22810.409978
28-0.065233-0.71460.238123
29-0.012682-0.13890.444872
30-0.060623-0.66410.253953
310.0046680.05110.47965
32-0.024694-0.27050.393616
330.005350.05860.476681
340.0626440.68620.246947
35-0.017711-0.1940.423246
360.0565080.6190.26854
370.0851650.93290.176363
380.0026190.02870.488579
390.0092770.10160.459611
40-0.00658-0.07210.471328
41-0.063247-0.69280.244876
42-0.059174-0.64820.259043
430.0374520.41030.34117
44-0.074516-0.81630.207977
45-0.028465-0.31180.377859
460.0191120.20940.417261
47-0.011512-0.12610.449931
48-0.048798-0.53460.296972

\begin{tabular}{lllllllll}
\hline
Partial Autocorrelation Function \tabularnewline
Time lag k & PACF(k) & T-STAT & P-value \tabularnewline
1 & 0.869396 & 9.5238 & 0 \tabularnewline
2 & 0.039685 & 0.4347 & 0.332271 \tabularnewline
3 & 0.204313 & 2.2381 & 0.013528 \tabularnewline
4 & 0.048745 & 0.534 & 0.297172 \tabularnewline
5 & 0.279621 & 3.0631 & 0.001352 \tabularnewline
6 & 0.120375 & 1.3186 & 0.094901 \tabularnewline
7 & -0.114178 & -1.2508 & 0.106729 \tabularnewline
8 & -0.02916 & -0.3194 & 0.374977 \tabularnewline
9 & 0.167294 & 1.8326 & 0.034669 \tabularnewline
10 & -0.022763 & -0.2494 & 0.401755 \tabularnewline
11 & 0.294578 & 3.2269 & 0.000807 \tabularnewline
12 & 0.151091 & 1.6551 & 0.050256 \tabularnewline
13 & -0.593769 & -6.5044 & 0 \tabularnewline
14 & -0.118956 & -1.3031 & 0.097518 \tabularnewline
15 & -0.003852 & -0.0422 & 0.483205 \tabularnewline
16 & -0.027315 & -0.2992 & 0.382645 \tabularnewline
17 & 0.010667 & 0.1169 & 0.453585 \tabularnewline
18 & 0.048608 & 0.5325 & 0.297691 \tabularnewline
19 & 0.022846 & 0.2503 & 0.401406 \tabularnewline
20 & -0.089413 & -0.9795 & 0.164659 \tabularnewline
21 & 0.057897 & 0.6342 & 0.26357 \tabularnewline
22 & 0.061447 & 0.6731 & 0.251085 \tabularnewline
23 & 0.020176 & 0.221 & 0.412729 \tabularnewline
24 & 0.106689 & 1.1687 & 0.122416 \tabularnewline
25 & -0.129249 & -1.4159 & 0.079705 \tabularnewline
26 & -0.076162 & -0.8343 & 0.202881 \tabularnewline
27 & -0.020823 & -0.2281 & 0.409978 \tabularnewline
28 & -0.065233 & -0.7146 & 0.238123 \tabularnewline
29 & -0.012682 & -0.1389 & 0.444872 \tabularnewline
30 & -0.060623 & -0.6641 & 0.253953 \tabularnewline
31 & 0.004668 & 0.0511 & 0.47965 \tabularnewline
32 & -0.024694 & -0.2705 & 0.393616 \tabularnewline
33 & 0.00535 & 0.0586 & 0.476681 \tabularnewline
34 & 0.062644 & 0.6862 & 0.246947 \tabularnewline
35 & -0.017711 & -0.194 & 0.423246 \tabularnewline
36 & 0.056508 & 0.619 & 0.26854 \tabularnewline
37 & 0.085165 & 0.9329 & 0.176363 \tabularnewline
38 & 0.002619 & 0.0287 & 0.488579 \tabularnewline
39 & 0.009277 & 0.1016 & 0.459611 \tabularnewline
40 & -0.00658 & -0.0721 & 0.471328 \tabularnewline
41 & -0.063247 & -0.6928 & 0.244876 \tabularnewline
42 & -0.059174 & -0.6482 & 0.259043 \tabularnewline
43 & 0.037452 & 0.4103 & 0.34117 \tabularnewline
44 & -0.074516 & -0.8163 & 0.207977 \tabularnewline
45 & -0.028465 & -0.3118 & 0.377859 \tabularnewline
46 & 0.019112 & 0.2094 & 0.417261 \tabularnewline
47 & -0.011512 & -0.1261 & 0.449931 \tabularnewline
48 & -0.048798 & -0.5346 & 0.296972 \tabularnewline
\hline
\end{tabular}
%Source: https://freestatistics.org/blog/index.php?pk=211267&T=2

[TABLE]
[ROW][C]Partial Autocorrelation Function[/C][/ROW]
[ROW][C]Time lag k[/C][C]PACF(k)[/C][C]T-STAT[/C][C]P-value[/C][/ROW]
[ROW][C]1[/C][C]0.869396[/C][C]9.5238[/C][C]0[/C][/ROW]
[ROW][C]2[/C][C]0.039685[/C][C]0.4347[/C][C]0.332271[/C][/ROW]
[ROW][C]3[/C][C]0.204313[/C][C]2.2381[/C][C]0.013528[/C][/ROW]
[ROW][C]4[/C][C]0.048745[/C][C]0.534[/C][C]0.297172[/C][/ROW]
[ROW][C]5[/C][C]0.279621[/C][C]3.0631[/C][C]0.001352[/C][/ROW]
[ROW][C]6[/C][C]0.120375[/C][C]1.3186[/C][C]0.094901[/C][/ROW]
[ROW][C]7[/C][C]-0.114178[/C][C]-1.2508[/C][C]0.106729[/C][/ROW]
[ROW][C]8[/C][C]-0.02916[/C][C]-0.3194[/C][C]0.374977[/C][/ROW]
[ROW][C]9[/C][C]0.167294[/C][C]1.8326[/C][C]0.034669[/C][/ROW]
[ROW][C]10[/C][C]-0.022763[/C][C]-0.2494[/C][C]0.401755[/C][/ROW]
[ROW][C]11[/C][C]0.294578[/C][C]3.2269[/C][C]0.000807[/C][/ROW]
[ROW][C]12[/C][C]0.151091[/C][C]1.6551[/C][C]0.050256[/C][/ROW]
[ROW][C]13[/C][C]-0.593769[/C][C]-6.5044[/C][C]0[/C][/ROW]
[ROW][C]14[/C][C]-0.118956[/C][C]-1.3031[/C][C]0.097518[/C][/ROW]
[ROW][C]15[/C][C]-0.003852[/C][C]-0.0422[/C][C]0.483205[/C][/ROW]
[ROW][C]16[/C][C]-0.027315[/C][C]-0.2992[/C][C]0.382645[/C][/ROW]
[ROW][C]17[/C][C]0.010667[/C][C]0.1169[/C][C]0.453585[/C][/ROW]
[ROW][C]18[/C][C]0.048608[/C][C]0.5325[/C][C]0.297691[/C][/ROW]
[ROW][C]19[/C][C]0.022846[/C][C]0.2503[/C][C]0.401406[/C][/ROW]
[ROW][C]20[/C][C]-0.089413[/C][C]-0.9795[/C][C]0.164659[/C][/ROW]
[ROW][C]21[/C][C]0.057897[/C][C]0.6342[/C][C]0.26357[/C][/ROW]
[ROW][C]22[/C][C]0.061447[/C][C]0.6731[/C][C]0.251085[/C][/ROW]
[ROW][C]23[/C][C]0.020176[/C][C]0.221[/C][C]0.412729[/C][/ROW]
[ROW][C]24[/C][C]0.106689[/C][C]1.1687[/C][C]0.122416[/C][/ROW]
[ROW][C]25[/C][C]-0.129249[/C][C]-1.4159[/C][C]0.079705[/C][/ROW]
[ROW][C]26[/C][C]-0.076162[/C][C]-0.8343[/C][C]0.202881[/C][/ROW]
[ROW][C]27[/C][C]-0.020823[/C][C]-0.2281[/C][C]0.409978[/C][/ROW]
[ROW][C]28[/C][C]-0.065233[/C][C]-0.7146[/C][C]0.238123[/C][/ROW]
[ROW][C]29[/C][C]-0.012682[/C][C]-0.1389[/C][C]0.444872[/C][/ROW]
[ROW][C]30[/C][C]-0.060623[/C][C]-0.6641[/C][C]0.253953[/C][/ROW]
[ROW][C]31[/C][C]0.004668[/C][C]0.0511[/C][C]0.47965[/C][/ROW]
[ROW][C]32[/C][C]-0.024694[/C][C]-0.2705[/C][C]0.393616[/C][/ROW]
[ROW][C]33[/C][C]0.00535[/C][C]0.0586[/C][C]0.476681[/C][/ROW]
[ROW][C]34[/C][C]0.062644[/C][C]0.6862[/C][C]0.246947[/C][/ROW]
[ROW][C]35[/C][C]-0.017711[/C][C]-0.194[/C][C]0.423246[/C][/ROW]
[ROW][C]36[/C][C]0.056508[/C][C]0.619[/C][C]0.26854[/C][/ROW]
[ROW][C]37[/C][C]0.085165[/C][C]0.9329[/C][C]0.176363[/C][/ROW]
[ROW][C]38[/C][C]0.002619[/C][C]0.0287[/C][C]0.488579[/C][/ROW]
[ROW][C]39[/C][C]0.009277[/C][C]0.1016[/C][C]0.459611[/C][/ROW]
[ROW][C]40[/C][C]-0.00658[/C][C]-0.0721[/C][C]0.471328[/C][/ROW]
[ROW][C]41[/C][C]-0.063247[/C][C]-0.6928[/C][C]0.244876[/C][/ROW]
[ROW][C]42[/C][C]-0.059174[/C][C]-0.6482[/C][C]0.259043[/C][/ROW]
[ROW][C]43[/C][C]0.037452[/C][C]0.4103[/C][C]0.34117[/C][/ROW]
[ROW][C]44[/C][C]-0.074516[/C][C]-0.8163[/C][C]0.207977[/C][/ROW]
[ROW][C]45[/C][C]-0.028465[/C][C]-0.3118[/C][C]0.377859[/C][/ROW]
[ROW][C]46[/C][C]0.019112[/C][C]0.2094[/C][C]0.417261[/C][/ROW]
[ROW][C]47[/C][C]-0.011512[/C][C]-0.1261[/C][C]0.449931[/C][/ROW]
[ROW][C]48[/C][C]-0.048798[/C][C]-0.5346[/C][C]0.296972[/C][/ROW]
[/TABLE]
Source: https://freestatistics.org/blog/index.php?pk=211267&T=2

Globally Unique Identifier (entire table): ba.freestatistics.org/blog/index.php?pk=211267&T=2

As an alternative you can also use a QR Code:  

The GUIDs for individual cells are displayed in the table below:

Partial Autocorrelation Function
Time lag kPACF(k)T-STATP-value
10.8693969.52380
20.0396850.43470.332271
30.2043132.23810.013528
40.0487450.5340.297172
50.2796213.06310.001352
60.1203751.31860.094901
7-0.114178-1.25080.106729
8-0.02916-0.31940.374977
90.1672941.83260.034669
10-0.022763-0.24940.401755
110.2945783.22690.000807
120.1510911.65510.050256
13-0.593769-6.50440
14-0.118956-1.30310.097518
15-0.003852-0.04220.483205
16-0.027315-0.29920.382645
170.0106670.11690.453585
180.0486080.53250.297691
190.0228460.25030.401406
20-0.089413-0.97950.164659
210.0578970.63420.26357
220.0614470.67310.251085
230.0201760.2210.412729
240.1066891.16870.122416
25-0.129249-1.41590.079705
26-0.076162-0.83430.202881
27-0.020823-0.22810.409978
28-0.065233-0.71460.238123
29-0.012682-0.13890.444872
30-0.060623-0.66410.253953
310.0046680.05110.47965
32-0.024694-0.27050.393616
330.005350.05860.476681
340.0626440.68620.246947
35-0.017711-0.1940.423246
360.0565080.6190.26854
370.0851650.93290.176363
380.0026190.02870.488579
390.0092770.10160.459611
40-0.00658-0.07210.471328
41-0.063247-0.69280.244876
42-0.059174-0.64820.259043
430.0374520.41030.34117
44-0.074516-0.81630.207977
45-0.028465-0.31180.377859
460.0191120.20940.417261
47-0.011512-0.12610.449931
48-0.048798-0.53460.296972


Parameters (Session):
par1 = 22 ; par2 = grey ; par3 = FALSE ; par4 = Unknown ;
Parameters (R input):
par1 = 48 ; par2 = 1 ; par3 = 0 ; par4 = 0 ; par5 = 12 ; par6 = White Noise ; par7 = 0.95 ; par8 = ;
R code (references can be found in the software module):
if (par1 == 'Default') {
par1 = 10*log10(length(x))
} else {
par1 <- as.numeric(par1)
}
par2 <- as.numeric(par2)
par3 <- as.numeric(par3)
par4 <- as.numeric(par4)
par5 <- as.numeric(par5)
if (par6 == 'White Noise') par6 <- 'white' else par6 <- 'ma'
par7 <- as.numeric(par7)
if (par8 != '') par8 <- as.numeric(par8)
ox <- x
if (par8 == '') {
if (par2 == 0) {
x <- log(x)
} else {
x <- (x ^ par2 - 1) / par2
}
} else {
x <- log(x,base=par8)
}
if (par3 > 0) x <- diff(x,lag=1,difference=par3)
if (par4 > 0) x <- diff(x,lag=par5,difference=par4)
bitmap(file='picts.png')
op <- par(mfrow=c(2,1))
plot(ox,type='l',main='Original Time Series',xlab='time',ylab='value')
if (par8=='') {
mytitle <- paste('Working Time Series (lambda=',par2,', d=',par3,', D=',par4,')',sep='')
mysub <- paste('(lambda=',par2,', d=',par3,', D=',par4,', CI=', par7, ', CI type=',par6,')',sep='')
} else {
mytitle <- paste('Working Time Series (base=',par8,', d=',par3,', D=',par4,')',sep='')
mysub <- paste('(base=',par8,', d=',par3,', D=',par4,', CI=', par7, ', CI type=',par6,')',sep='')
}
plot(x,type='l', main=mytitle,xlab='time',ylab='value')
par(op)
dev.off()
bitmap(file='pic1.png')
racf <- acf(x, par1, main='Autocorrelation', xlab='time lag', ylab='ACF', ci.type=par6, ci=par7, sub=mysub)
dev.off()
bitmap(file='pic2.png')
rpacf <- pacf(x,par1,main='Partial Autocorrelation',xlab='lags',ylab='PACF',sub=mysub)
dev.off()
(myacf <- c(racf$acf))
(mypacf <- c(rpacf$acf))
lengthx <- length(x)
sqrtn <- sqrt(lengthx)
load(file='createtable')
a<-table.start()
a<-table.row.start(a)
a<-table.element(a,'Autocorrelation Function',4,TRUE)
a<-table.row.end(a)
a<-table.row.start(a)
a<-table.element(a,'Time lag k',header=TRUE)
a<-table.element(a,hyperlink('basics.htm','ACF(k)','click here for more information about the Autocorrelation Function'),header=TRUE)
a<-table.element(a,'T-STAT',header=TRUE)
a<-table.element(a,'P-value',header=TRUE)
a<-table.row.end(a)
for (i in 2:(par1+1)) {
a<-table.row.start(a)
a<-table.element(a,i-1,header=TRUE)
a<-table.element(a,round(myacf[i],6))
mytstat <- myacf[i]*sqrtn
a<-table.element(a,round(mytstat,4))
a<-table.element(a,round(1-pt(abs(mytstat),lengthx),6))
a<-table.row.end(a)
}
a<-table.end(a)
table.save(a,file='mytable.tab')
a<-table.start()
a<-table.row.start(a)
a<-table.element(a,'Partial Autocorrelation Function',4,TRUE)
a<-table.row.end(a)
a<-table.row.start(a)
a<-table.element(a,'Time lag k',header=TRUE)
a<-table.element(a,hyperlink('basics.htm','PACF(k)','click here for more information about the Partial Autocorrelation Function'),header=TRUE)
a<-table.element(a,'T-STAT',header=TRUE)
a<-table.element(a,'P-value',header=TRUE)
a<-table.row.end(a)
for (i in 1:par1) {
a<-table.row.start(a)
a<-table.element(a,i,header=TRUE)
a<-table.element(a,round(mypacf[i],6))
mytstat <- mypacf[i]*sqrtn
a<-table.element(a,round(mytstat,4))
a<-table.element(a,round(1-pt(abs(mytstat),lengthx),6))
a<-table.row.end(a)
}
a<-table.end(a)
table.save(a,file='mytable1.tab')