Free Statistics

of Irreproducible Research!

Author's title

Author*Unverified author*
R Software Modulerwasp_autocorrelation.wasp
Title produced by software(Partial) Autocorrelation Function
Date of computationTue, 20 Aug 2013 22:10:59 -0400
Cite this page as followsStatistical Computations at FreeStatistics.org, Office for Research Development and Education, URL https://freestatistics.org/blog/index.php?v=date/2013/Aug/20/t1377051182kcl5u5nt8a372d7.htm/, Retrieved Sat, 27 Apr 2024 09:55:25 +0000
Statistical Computations at FreeStatistics.org, Office for Research Development and Education, URL https://freestatistics.org/blog/index.php?pk=211278, Retrieved Sat, 27 Apr 2024 09:55:25 +0000
QR Codes:

Original text written by user:
IsPrivate?No (this computation is public)
User-defined keywordsRaedts Mathias
Estimated Impact94
Family? (F = Feedback message, R = changed R code, M = changed R Module, P = changed Parameters, D = changed Data)
-       [(Partial) Autocorrelation Function] [Tijdreeks B - Sta...] [2013-08-21 02:10:59] [e2e43c39163d7563005e2a800525cced] [Current]
Feedback Forum

Post a new message
Dataseries X:
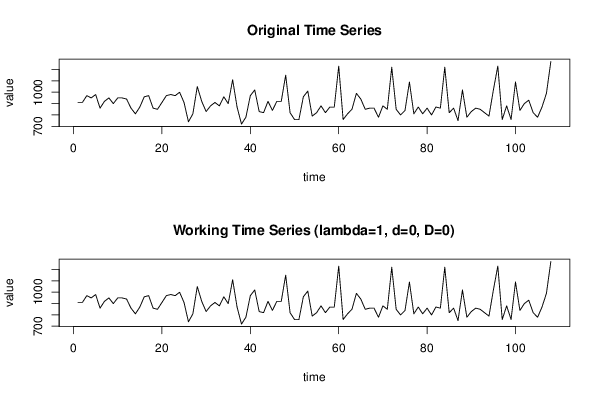
910
910
970
950
980
860
920
950
900
950
950
940
860
810
870
960
970
860
850
910
970
980
970
1000
910
740
810
1050
920
830
880
910
880
960
900
1110
870
720
780
970
1020
830
820
920
840
920
920
1150
820
760
760
960
1010
790
820
880
820
870
870
1230
760
810
850
990
940
850
860
860
780
880
850
1220
850
800
840
1090
810
870
810
860
800
870
860
1220
820
860
750
1020
780
830
860
850
820
790
1020
1230
760
880
760
1090
840
900
930
820
780
870
990
1270


Summary of computational transaction
Raw Inputview raw input (R code)
Raw Outputview raw output of R engine
Computing time2 seconds
R Server'Sir Ronald Aylmer Fisher' @ fisher.wessa.net

\begin{tabular}{lllllllll}
\hline
Summary of computational transaction \tabularnewline
Raw Input & view raw input (R code)  \tabularnewline
Raw Output & view raw output of R engine  \tabularnewline
Computing time & 2 seconds \tabularnewline
R Server & 'Sir Ronald Aylmer Fisher' @ fisher.wessa.net \tabularnewline
\hline
\end{tabular}
%Source: https://freestatistics.org/blog/index.php?pk=211278&T=0

[TABLE]
[ROW][C]Summary of computational transaction[/C][/ROW]
[ROW][C]Raw Input[/C][C]view raw input (R code) [/C][/ROW]
[ROW][C]Raw Output[/C][C]view raw output of R engine [/C][/ROW]
[ROW][C]Computing time[/C][C]2 seconds[/C][/ROW]
[ROW][C]R Server[/C][C]'Sir Ronald Aylmer Fisher' @ fisher.wessa.net[/C][/ROW]
[/TABLE]
Source: https://freestatistics.org/blog/index.php?pk=211278&T=0

Globally Unique Identifier (entire table): ba.freestatistics.org/blog/index.php?pk=211278&T=0

As an alternative you can also use a QR Code:  

The GUIDs for individual cells are displayed in the table below:

Summary of computational transaction
Raw Inputview raw input (R code)
Raw Outputview raw output of R engine
Computing time2 seconds
R Server'Sir Ronald Aylmer Fisher' @ fisher.wessa.net


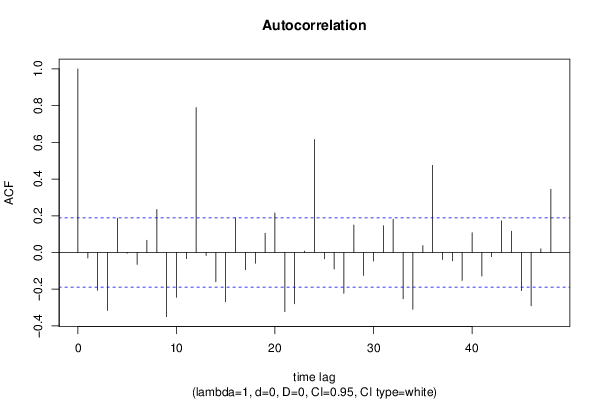
Autocorrelation Function
Time lag kACF(k)T-STATP-value
1-0.030577-0.31780.375639
2-0.205846-2.13920.017336
3-0.316247-3.28650.000684
40.1868081.94140.02741
5-0.004253-0.04420.482416
6-0.064827-0.67370.250969
70.0669510.69580.244031
80.2339712.43150.008341
9-0.349633-3.63350.000215
10-0.243985-2.53560.006329
11-0.033589-0.34910.36386
120.78958.20470
13-0.016239-0.16880.43315
14-0.159289-1.65540.050375
15-0.268617-2.79160.003102
160.1885041.9590.026346
17-0.094554-0.98260.163993
18-0.058524-0.60820.272166
190.1049011.09020.139034
200.2149532.23390.013777
21-0.322309-3.34950.000558
22-0.279085-2.90030.002259
230.00730.07590.469834
240.6153816.39520
25-0.034159-0.3550.361643
26-0.090149-0.93690.175461
27-0.222073-2.30790.011456
280.1493741.55230.061753
29-0.124802-1.2970.098701
30-0.046378-0.4820.315398
310.1455451.51250.066658
320.1815741.8870.030924
33-0.251862-2.61740.005065
34-0.30951-3.21650.000856
350.0375770.39050.348463
360.4745354.93151e-06
37-0.038701-0.40220.34417
38-0.045374-0.47150.319102
39-0.152082-1.58050.05846
400.1078951.12130.132329
41-0.128255-1.33290.092691
42-0.02262-0.23510.407298
430.1724671.79230.03794
440.1154591.19990.116404
45-0.20802-2.16180.01642
46-0.289945-3.01320.00161
470.0195790.20350.419573
480.3441273.57630.000261

\begin{tabular}{lllllllll}
\hline
Autocorrelation Function \tabularnewline
Time lag k & ACF(k) & T-STAT & P-value \tabularnewline
1 & -0.030577 & -0.3178 & 0.375639 \tabularnewline
2 & -0.205846 & -2.1392 & 0.017336 \tabularnewline
3 & -0.316247 & -3.2865 & 0.000684 \tabularnewline
4 & 0.186808 & 1.9414 & 0.02741 \tabularnewline
5 & -0.004253 & -0.0442 & 0.482416 \tabularnewline
6 & -0.064827 & -0.6737 & 0.250969 \tabularnewline
7 & 0.066951 & 0.6958 & 0.244031 \tabularnewline
8 & 0.233971 & 2.4315 & 0.008341 \tabularnewline
9 & -0.349633 & -3.6335 & 0.000215 \tabularnewline
10 & -0.243985 & -2.5356 & 0.006329 \tabularnewline
11 & -0.033589 & -0.3491 & 0.36386 \tabularnewline
12 & 0.7895 & 8.2047 & 0 \tabularnewline
13 & -0.016239 & -0.1688 & 0.43315 \tabularnewline
14 & -0.159289 & -1.6554 & 0.050375 \tabularnewline
15 & -0.268617 & -2.7916 & 0.003102 \tabularnewline
16 & 0.188504 & 1.959 & 0.026346 \tabularnewline
17 & -0.094554 & -0.9826 & 0.163993 \tabularnewline
18 & -0.058524 & -0.6082 & 0.272166 \tabularnewline
19 & 0.104901 & 1.0902 & 0.139034 \tabularnewline
20 & 0.214953 & 2.2339 & 0.013777 \tabularnewline
21 & -0.322309 & -3.3495 & 0.000558 \tabularnewline
22 & -0.279085 & -2.9003 & 0.002259 \tabularnewline
23 & 0.0073 & 0.0759 & 0.469834 \tabularnewline
24 & 0.615381 & 6.3952 & 0 \tabularnewline
25 & -0.034159 & -0.355 & 0.361643 \tabularnewline
26 & -0.090149 & -0.9369 & 0.175461 \tabularnewline
27 & -0.222073 & -2.3079 & 0.011456 \tabularnewline
28 & 0.149374 & 1.5523 & 0.061753 \tabularnewline
29 & -0.124802 & -1.297 & 0.098701 \tabularnewline
30 & -0.046378 & -0.482 & 0.315398 \tabularnewline
31 & 0.145545 & 1.5125 & 0.066658 \tabularnewline
32 & 0.181574 & 1.887 & 0.030924 \tabularnewline
33 & -0.251862 & -2.6174 & 0.005065 \tabularnewline
34 & -0.30951 & -3.2165 & 0.000856 \tabularnewline
35 & 0.037577 & 0.3905 & 0.348463 \tabularnewline
36 & 0.474535 & 4.9315 & 1e-06 \tabularnewline
37 & -0.038701 & -0.4022 & 0.34417 \tabularnewline
38 & -0.045374 & -0.4715 & 0.319102 \tabularnewline
39 & -0.152082 & -1.5805 & 0.05846 \tabularnewline
40 & 0.107895 & 1.1213 & 0.132329 \tabularnewline
41 & -0.128255 & -1.3329 & 0.092691 \tabularnewline
42 & -0.02262 & -0.2351 & 0.407298 \tabularnewline
43 & 0.172467 & 1.7923 & 0.03794 \tabularnewline
44 & 0.115459 & 1.1999 & 0.116404 \tabularnewline
45 & -0.20802 & -2.1618 & 0.01642 \tabularnewline
46 & -0.289945 & -3.0132 & 0.00161 \tabularnewline
47 & 0.019579 & 0.2035 & 0.419573 \tabularnewline
48 & 0.344127 & 3.5763 & 0.000261 \tabularnewline
\hline
\end{tabular}
%Source: https://freestatistics.org/blog/index.php?pk=211278&T=1

[TABLE]
[ROW][C]Autocorrelation Function[/C][/ROW]
[ROW][C]Time lag k[/C][C]ACF(k)[/C][C]T-STAT[/C][C]P-value[/C][/ROW]
[ROW][C]1[/C][C]-0.030577[/C][C]-0.3178[/C][C]0.375639[/C][/ROW]
[ROW][C]2[/C][C]-0.205846[/C][C]-2.1392[/C][C]0.017336[/C][/ROW]
[ROW][C]3[/C][C]-0.316247[/C][C]-3.2865[/C][C]0.000684[/C][/ROW]
[ROW][C]4[/C][C]0.186808[/C][C]1.9414[/C][C]0.02741[/C][/ROW]
[ROW][C]5[/C][C]-0.004253[/C][C]-0.0442[/C][C]0.482416[/C][/ROW]
[ROW][C]6[/C][C]-0.064827[/C][C]-0.6737[/C][C]0.250969[/C][/ROW]
[ROW][C]7[/C][C]0.066951[/C][C]0.6958[/C][C]0.244031[/C][/ROW]
[ROW][C]8[/C][C]0.233971[/C][C]2.4315[/C][C]0.008341[/C][/ROW]
[ROW][C]9[/C][C]-0.349633[/C][C]-3.6335[/C][C]0.000215[/C][/ROW]
[ROW][C]10[/C][C]-0.243985[/C][C]-2.5356[/C][C]0.006329[/C][/ROW]
[ROW][C]11[/C][C]-0.033589[/C][C]-0.3491[/C][C]0.36386[/C][/ROW]
[ROW][C]12[/C][C]0.7895[/C][C]8.2047[/C][C]0[/C][/ROW]
[ROW][C]13[/C][C]-0.016239[/C][C]-0.1688[/C][C]0.43315[/C][/ROW]
[ROW][C]14[/C][C]-0.159289[/C][C]-1.6554[/C][C]0.050375[/C][/ROW]
[ROW][C]15[/C][C]-0.268617[/C][C]-2.7916[/C][C]0.003102[/C][/ROW]
[ROW][C]16[/C][C]0.188504[/C][C]1.959[/C][C]0.026346[/C][/ROW]
[ROW][C]17[/C][C]-0.094554[/C][C]-0.9826[/C][C]0.163993[/C][/ROW]
[ROW][C]18[/C][C]-0.058524[/C][C]-0.6082[/C][C]0.272166[/C][/ROW]
[ROW][C]19[/C][C]0.104901[/C][C]1.0902[/C][C]0.139034[/C][/ROW]
[ROW][C]20[/C][C]0.214953[/C][C]2.2339[/C][C]0.013777[/C][/ROW]
[ROW][C]21[/C][C]-0.322309[/C][C]-3.3495[/C][C]0.000558[/C][/ROW]
[ROW][C]22[/C][C]-0.279085[/C][C]-2.9003[/C][C]0.002259[/C][/ROW]
[ROW][C]23[/C][C]0.0073[/C][C]0.0759[/C][C]0.469834[/C][/ROW]
[ROW][C]24[/C][C]0.615381[/C][C]6.3952[/C][C]0[/C][/ROW]
[ROW][C]25[/C][C]-0.034159[/C][C]-0.355[/C][C]0.361643[/C][/ROW]
[ROW][C]26[/C][C]-0.090149[/C][C]-0.9369[/C][C]0.175461[/C][/ROW]
[ROW][C]27[/C][C]-0.222073[/C][C]-2.3079[/C][C]0.011456[/C][/ROW]
[ROW][C]28[/C][C]0.149374[/C][C]1.5523[/C][C]0.061753[/C][/ROW]
[ROW][C]29[/C][C]-0.124802[/C][C]-1.297[/C][C]0.098701[/C][/ROW]
[ROW][C]30[/C][C]-0.046378[/C][C]-0.482[/C][C]0.315398[/C][/ROW]
[ROW][C]31[/C][C]0.145545[/C][C]1.5125[/C][C]0.066658[/C][/ROW]
[ROW][C]32[/C][C]0.181574[/C][C]1.887[/C][C]0.030924[/C][/ROW]
[ROW][C]33[/C][C]-0.251862[/C][C]-2.6174[/C][C]0.005065[/C][/ROW]
[ROW][C]34[/C][C]-0.30951[/C][C]-3.2165[/C][C]0.000856[/C][/ROW]
[ROW][C]35[/C][C]0.037577[/C][C]0.3905[/C][C]0.348463[/C][/ROW]
[ROW][C]36[/C][C]0.474535[/C][C]4.9315[/C][C]1e-06[/C][/ROW]
[ROW][C]37[/C][C]-0.038701[/C][C]-0.4022[/C][C]0.34417[/C][/ROW]
[ROW][C]38[/C][C]-0.045374[/C][C]-0.4715[/C][C]0.319102[/C][/ROW]
[ROW][C]39[/C][C]-0.152082[/C][C]-1.5805[/C][C]0.05846[/C][/ROW]
[ROW][C]40[/C][C]0.107895[/C][C]1.1213[/C][C]0.132329[/C][/ROW]
[ROW][C]41[/C][C]-0.128255[/C][C]-1.3329[/C][C]0.092691[/C][/ROW]
[ROW][C]42[/C][C]-0.02262[/C][C]-0.2351[/C][C]0.407298[/C][/ROW]
[ROW][C]43[/C][C]0.172467[/C][C]1.7923[/C][C]0.03794[/C][/ROW]
[ROW][C]44[/C][C]0.115459[/C][C]1.1999[/C][C]0.116404[/C][/ROW]
[ROW][C]45[/C][C]-0.20802[/C][C]-2.1618[/C][C]0.01642[/C][/ROW]
[ROW][C]46[/C][C]-0.289945[/C][C]-3.0132[/C][C]0.00161[/C][/ROW]
[ROW][C]47[/C][C]0.019579[/C][C]0.2035[/C][C]0.419573[/C][/ROW]
[ROW][C]48[/C][C]0.344127[/C][C]3.5763[/C][C]0.000261[/C][/ROW]
[/TABLE]
Source: https://freestatistics.org/blog/index.php?pk=211278&T=1

Globally Unique Identifier (entire table): ba.freestatistics.org/blog/index.php?pk=211278&T=1

As an alternative you can also use a QR Code:  

The GUIDs for individual cells are displayed in the table below:

Autocorrelation Function
Time lag kACF(k)T-STATP-value
1-0.030577-0.31780.375639
2-0.205846-2.13920.017336
3-0.316247-3.28650.000684
40.1868081.94140.02741
5-0.004253-0.04420.482416
6-0.064827-0.67370.250969
70.0669510.69580.244031
80.2339712.43150.008341
9-0.349633-3.63350.000215
10-0.243985-2.53560.006329
11-0.033589-0.34910.36386
120.78958.20470
13-0.016239-0.16880.43315
14-0.159289-1.65540.050375
15-0.268617-2.79160.003102
160.1885041.9590.026346
17-0.094554-0.98260.163993
18-0.058524-0.60820.272166
190.1049011.09020.139034
200.2149532.23390.013777
21-0.322309-3.34950.000558
22-0.279085-2.90030.002259
230.00730.07590.469834
240.6153816.39520
25-0.034159-0.3550.361643
26-0.090149-0.93690.175461
27-0.222073-2.30790.011456
280.1493741.55230.061753
29-0.124802-1.2970.098701
30-0.046378-0.4820.315398
310.1455451.51250.066658
320.1815741.8870.030924
33-0.251862-2.61740.005065
34-0.30951-3.21650.000856
350.0375770.39050.348463
360.4745354.93151e-06
37-0.038701-0.40220.34417
38-0.045374-0.47150.319102
39-0.152082-1.58050.05846
400.1078951.12130.132329
41-0.128255-1.33290.092691
42-0.02262-0.23510.407298
430.1724671.79230.03794
440.1154591.19990.116404
45-0.20802-2.16180.01642
46-0.289945-3.01320.00161
470.0195790.20350.419573
480.3441273.57630.000261


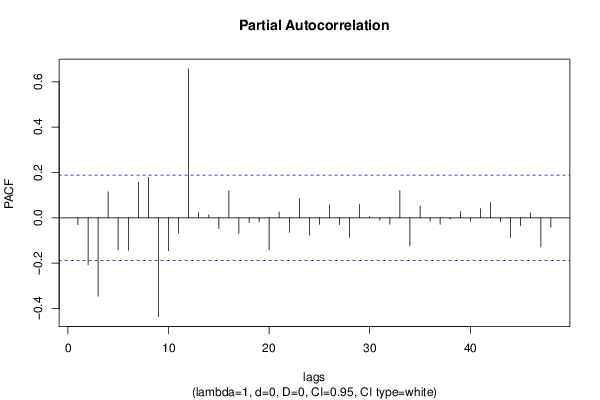
Partial Autocorrelation Function
Time lag kPACF(k)T-STATP-value
1-0.030577-0.31780.375639
2-0.206974-2.15090.016855
3-0.345272-3.58820.000251
40.1148711.19380.117592
5-0.141874-1.47440.071642
6-0.143142-1.48760.069888
70.1572171.63380.052601
80.1784181.85420.033221
9-0.435862-4.52968e-06
10-0.144801-1.50480.067645
11-0.06723-0.69870.243128
120.656526.82280
130.0238220.24760.40247
140.0133160.13840.445097
15-0.047784-0.49660.310245
160.1188911.23560.109652
17-0.069592-0.72320.235554
18-0.02145-0.22290.41201
19-0.017822-0.18520.426705
20-0.140174-1.45670.074046
210.0260720.27090.393476
22-0.064245-0.66770.252889
230.0841010.8740.192029
24-0.075929-0.78910.215897
25-0.028684-0.29810.383104
260.0567820.59010.278179
27-0.029909-0.31080.378268
28-0.085561-0.88920.187941
290.0600490.6240.266957
300.005890.06120.475652
31-0.010348-0.10750.457281
32-0.027931-0.29030.386085
330.1196971.24390.108109
34-0.123974-1.28840.100185
350.0520950.54140.294678
36-0.014024-0.14570.442198
37-0.028409-0.29520.384189
38-0.004883-0.05070.479812
390.0272550.28320.388766
40-0.015372-0.15970.436689
410.0400630.41630.338991
420.0676620.70320.241732
43-0.017791-0.18490.42683
44-0.086873-0.90280.184318
45-0.034635-0.35990.359799
460.0209950.21820.413846
47-0.128616-1.33660.092078
48-0.04131-0.42930.334278

\begin{tabular}{lllllllll}
\hline
Partial Autocorrelation Function \tabularnewline
Time lag k & PACF(k) & T-STAT & P-value \tabularnewline
1 & -0.030577 & -0.3178 & 0.375639 \tabularnewline
2 & -0.206974 & -2.1509 & 0.016855 \tabularnewline
3 & -0.345272 & -3.5882 & 0.000251 \tabularnewline
4 & 0.114871 & 1.1938 & 0.117592 \tabularnewline
5 & -0.141874 & -1.4744 & 0.071642 \tabularnewline
6 & -0.143142 & -1.4876 & 0.069888 \tabularnewline
7 & 0.157217 & 1.6338 & 0.052601 \tabularnewline
8 & 0.178418 & 1.8542 & 0.033221 \tabularnewline
9 & -0.435862 & -4.5296 & 8e-06 \tabularnewline
10 & -0.144801 & -1.5048 & 0.067645 \tabularnewline
11 & -0.06723 & -0.6987 & 0.243128 \tabularnewline
12 & 0.65652 & 6.8228 & 0 \tabularnewline
13 & 0.023822 & 0.2476 & 0.40247 \tabularnewline
14 & 0.013316 & 0.1384 & 0.445097 \tabularnewline
15 & -0.047784 & -0.4966 & 0.310245 \tabularnewline
16 & 0.118891 & 1.2356 & 0.109652 \tabularnewline
17 & -0.069592 & -0.7232 & 0.235554 \tabularnewline
18 & -0.02145 & -0.2229 & 0.41201 \tabularnewline
19 & -0.017822 & -0.1852 & 0.426705 \tabularnewline
20 & -0.140174 & -1.4567 & 0.074046 \tabularnewline
21 & 0.026072 & 0.2709 & 0.393476 \tabularnewline
22 & -0.064245 & -0.6677 & 0.252889 \tabularnewline
23 & 0.084101 & 0.874 & 0.192029 \tabularnewline
24 & -0.075929 & -0.7891 & 0.215897 \tabularnewline
25 & -0.028684 & -0.2981 & 0.383104 \tabularnewline
26 & 0.056782 & 0.5901 & 0.278179 \tabularnewline
27 & -0.029909 & -0.3108 & 0.378268 \tabularnewline
28 & -0.085561 & -0.8892 & 0.187941 \tabularnewline
29 & 0.060049 & 0.624 & 0.266957 \tabularnewline
30 & 0.00589 & 0.0612 & 0.475652 \tabularnewline
31 & -0.010348 & -0.1075 & 0.457281 \tabularnewline
32 & -0.027931 & -0.2903 & 0.386085 \tabularnewline
33 & 0.119697 & 1.2439 & 0.108109 \tabularnewline
34 & -0.123974 & -1.2884 & 0.100185 \tabularnewline
35 & 0.052095 & 0.5414 & 0.294678 \tabularnewline
36 & -0.014024 & -0.1457 & 0.442198 \tabularnewline
37 & -0.028409 & -0.2952 & 0.384189 \tabularnewline
38 & -0.004883 & -0.0507 & 0.479812 \tabularnewline
39 & 0.027255 & 0.2832 & 0.388766 \tabularnewline
40 & -0.015372 & -0.1597 & 0.436689 \tabularnewline
41 & 0.040063 & 0.4163 & 0.338991 \tabularnewline
42 & 0.067662 & 0.7032 & 0.241732 \tabularnewline
43 & -0.017791 & -0.1849 & 0.42683 \tabularnewline
44 & -0.086873 & -0.9028 & 0.184318 \tabularnewline
45 & -0.034635 & -0.3599 & 0.359799 \tabularnewline
46 & 0.020995 & 0.2182 & 0.413846 \tabularnewline
47 & -0.128616 & -1.3366 & 0.092078 \tabularnewline
48 & -0.04131 & -0.4293 & 0.334278 \tabularnewline
\hline
\end{tabular}
%Source: https://freestatistics.org/blog/index.php?pk=211278&T=2

[TABLE]
[ROW][C]Partial Autocorrelation Function[/C][/ROW]
[ROW][C]Time lag k[/C][C]PACF(k)[/C][C]T-STAT[/C][C]P-value[/C][/ROW]
[ROW][C]1[/C][C]-0.030577[/C][C]-0.3178[/C][C]0.375639[/C][/ROW]
[ROW][C]2[/C][C]-0.206974[/C][C]-2.1509[/C][C]0.016855[/C][/ROW]
[ROW][C]3[/C][C]-0.345272[/C][C]-3.5882[/C][C]0.000251[/C][/ROW]
[ROW][C]4[/C][C]0.114871[/C][C]1.1938[/C][C]0.117592[/C][/ROW]
[ROW][C]5[/C][C]-0.141874[/C][C]-1.4744[/C][C]0.071642[/C][/ROW]
[ROW][C]6[/C][C]-0.143142[/C][C]-1.4876[/C][C]0.069888[/C][/ROW]
[ROW][C]7[/C][C]0.157217[/C][C]1.6338[/C][C]0.052601[/C][/ROW]
[ROW][C]8[/C][C]0.178418[/C][C]1.8542[/C][C]0.033221[/C][/ROW]
[ROW][C]9[/C][C]-0.435862[/C][C]-4.5296[/C][C]8e-06[/C][/ROW]
[ROW][C]10[/C][C]-0.144801[/C][C]-1.5048[/C][C]0.067645[/C][/ROW]
[ROW][C]11[/C][C]-0.06723[/C][C]-0.6987[/C][C]0.243128[/C][/ROW]
[ROW][C]12[/C][C]0.65652[/C][C]6.8228[/C][C]0[/C][/ROW]
[ROW][C]13[/C][C]0.023822[/C][C]0.2476[/C][C]0.40247[/C][/ROW]
[ROW][C]14[/C][C]0.013316[/C][C]0.1384[/C][C]0.445097[/C][/ROW]
[ROW][C]15[/C][C]-0.047784[/C][C]-0.4966[/C][C]0.310245[/C][/ROW]
[ROW][C]16[/C][C]0.118891[/C][C]1.2356[/C][C]0.109652[/C][/ROW]
[ROW][C]17[/C][C]-0.069592[/C][C]-0.7232[/C][C]0.235554[/C][/ROW]
[ROW][C]18[/C][C]-0.02145[/C][C]-0.2229[/C][C]0.41201[/C][/ROW]
[ROW][C]19[/C][C]-0.017822[/C][C]-0.1852[/C][C]0.426705[/C][/ROW]
[ROW][C]20[/C][C]-0.140174[/C][C]-1.4567[/C][C]0.074046[/C][/ROW]
[ROW][C]21[/C][C]0.026072[/C][C]0.2709[/C][C]0.393476[/C][/ROW]
[ROW][C]22[/C][C]-0.064245[/C][C]-0.6677[/C][C]0.252889[/C][/ROW]
[ROW][C]23[/C][C]0.084101[/C][C]0.874[/C][C]0.192029[/C][/ROW]
[ROW][C]24[/C][C]-0.075929[/C][C]-0.7891[/C][C]0.215897[/C][/ROW]
[ROW][C]25[/C][C]-0.028684[/C][C]-0.2981[/C][C]0.383104[/C][/ROW]
[ROW][C]26[/C][C]0.056782[/C][C]0.5901[/C][C]0.278179[/C][/ROW]
[ROW][C]27[/C][C]-0.029909[/C][C]-0.3108[/C][C]0.378268[/C][/ROW]
[ROW][C]28[/C][C]-0.085561[/C][C]-0.8892[/C][C]0.187941[/C][/ROW]
[ROW][C]29[/C][C]0.060049[/C][C]0.624[/C][C]0.266957[/C][/ROW]
[ROW][C]30[/C][C]0.00589[/C][C]0.0612[/C][C]0.475652[/C][/ROW]
[ROW][C]31[/C][C]-0.010348[/C][C]-0.1075[/C][C]0.457281[/C][/ROW]
[ROW][C]32[/C][C]-0.027931[/C][C]-0.2903[/C][C]0.386085[/C][/ROW]
[ROW][C]33[/C][C]0.119697[/C][C]1.2439[/C][C]0.108109[/C][/ROW]
[ROW][C]34[/C][C]-0.123974[/C][C]-1.2884[/C][C]0.100185[/C][/ROW]
[ROW][C]35[/C][C]0.052095[/C][C]0.5414[/C][C]0.294678[/C][/ROW]
[ROW][C]36[/C][C]-0.014024[/C][C]-0.1457[/C][C]0.442198[/C][/ROW]
[ROW][C]37[/C][C]-0.028409[/C][C]-0.2952[/C][C]0.384189[/C][/ROW]
[ROW][C]38[/C][C]-0.004883[/C][C]-0.0507[/C][C]0.479812[/C][/ROW]
[ROW][C]39[/C][C]0.027255[/C][C]0.2832[/C][C]0.388766[/C][/ROW]
[ROW][C]40[/C][C]-0.015372[/C][C]-0.1597[/C][C]0.436689[/C][/ROW]
[ROW][C]41[/C][C]0.040063[/C][C]0.4163[/C][C]0.338991[/C][/ROW]
[ROW][C]42[/C][C]0.067662[/C][C]0.7032[/C][C]0.241732[/C][/ROW]
[ROW][C]43[/C][C]-0.017791[/C][C]-0.1849[/C][C]0.42683[/C][/ROW]
[ROW][C]44[/C][C]-0.086873[/C][C]-0.9028[/C][C]0.184318[/C][/ROW]
[ROW][C]45[/C][C]-0.034635[/C][C]-0.3599[/C][C]0.359799[/C][/ROW]
[ROW][C]46[/C][C]0.020995[/C][C]0.2182[/C][C]0.413846[/C][/ROW]
[ROW][C]47[/C][C]-0.128616[/C][C]-1.3366[/C][C]0.092078[/C][/ROW]
[ROW][C]48[/C][C]-0.04131[/C][C]-0.4293[/C][C]0.334278[/C][/ROW]
[/TABLE]
Source: https://freestatistics.org/blog/index.php?pk=211278&T=2

Globally Unique Identifier (entire table): ba.freestatistics.org/blog/index.php?pk=211278&T=2

As an alternative you can also use a QR Code:  

The GUIDs for individual cells are displayed in the table below:

Partial Autocorrelation Function
Time lag kPACF(k)T-STATP-value
1-0.030577-0.31780.375639
2-0.206974-2.15090.016855
3-0.345272-3.58820.000251
40.1148711.19380.117592
5-0.141874-1.47440.071642
6-0.143142-1.48760.069888
70.1572171.63380.052601
80.1784181.85420.033221
9-0.435862-4.52968e-06
10-0.144801-1.50480.067645
11-0.06723-0.69870.243128
120.656526.82280
130.0238220.24760.40247
140.0133160.13840.445097
15-0.047784-0.49660.310245
160.1188911.23560.109652
17-0.069592-0.72320.235554
18-0.02145-0.22290.41201
19-0.017822-0.18520.426705
20-0.140174-1.45670.074046
210.0260720.27090.393476
22-0.064245-0.66770.252889
230.0841010.8740.192029
24-0.075929-0.78910.215897
25-0.028684-0.29810.383104
260.0567820.59010.278179
27-0.029909-0.31080.378268
28-0.085561-0.88920.187941
290.0600490.6240.266957
300.005890.06120.475652
31-0.010348-0.10750.457281
32-0.027931-0.29030.386085
330.1196971.24390.108109
34-0.123974-1.28840.100185
350.0520950.54140.294678
36-0.014024-0.14570.442198
37-0.028409-0.29520.384189
38-0.004883-0.05070.479812
390.0272550.28320.388766
40-0.015372-0.15970.436689
410.0400630.41630.338991
420.0676620.70320.241732
43-0.017791-0.18490.42683
44-0.086873-0.90280.184318
45-0.034635-0.35990.359799
460.0209950.21820.413846
47-0.128616-1.33660.092078
48-0.04131-0.42930.334278


Parameters (Session):
par1 = 22 ; par2 = grey ; par3 = FALSE ; par4 = Unknown ;
Parameters (R input):
par1 = 48 ; par2 = 1 ; par3 = 0 ; par4 = 0 ; par5 = 12 ; par6 = White Noise ; par7 = 0.95 ; par8 = ;
R code (references can be found in the software module):
if (par1 == 'Default') {
par1 = 10*log10(length(x))
} else {
par1 <- as.numeric(par1)
}
par2 <- as.numeric(par2)
par3 <- as.numeric(par3)
par4 <- as.numeric(par4)
par5 <- as.numeric(par5)
if (par6 == 'White Noise') par6 <- 'white' else par6 <- 'ma'
par7 <- as.numeric(par7)
if (par8 != '') par8 <- as.numeric(par8)
ox <- x
if (par8 == '') {
if (par2 == 0) {
x <- log(x)
} else {
x <- (x ^ par2 - 1) / par2
}
} else {
x <- log(x,base=par8)
}
if (par3 > 0) x <- diff(x,lag=1,difference=par3)
if (par4 > 0) x <- diff(x,lag=par5,difference=par4)
bitmap(file='picts.png')
op <- par(mfrow=c(2,1))
plot(ox,type='l',main='Original Time Series',xlab='time',ylab='value')
if (par8=='') {
mytitle <- paste('Working Time Series (lambda=',par2,', d=',par3,', D=',par4,')',sep='')
mysub <- paste('(lambda=',par2,', d=',par3,', D=',par4,', CI=', par7, ', CI type=',par6,')',sep='')
} else {
mytitle <- paste('Working Time Series (base=',par8,', d=',par3,', D=',par4,')',sep='')
mysub <- paste('(base=',par8,', d=',par3,', D=',par4,', CI=', par7, ', CI type=',par6,')',sep='')
}
plot(x,type='l', main=mytitle,xlab='time',ylab='value')
par(op)
dev.off()
bitmap(file='pic1.png')
racf <- acf(x, par1, main='Autocorrelation', xlab='time lag', ylab='ACF', ci.type=par6, ci=par7, sub=mysub)
dev.off()
bitmap(file='pic2.png')
rpacf <- pacf(x,par1,main='Partial Autocorrelation',xlab='lags',ylab='PACF',sub=mysub)
dev.off()
(myacf <- c(racf$acf))
(mypacf <- c(rpacf$acf))
lengthx <- length(x)
sqrtn <- sqrt(lengthx)
load(file='createtable')
a<-table.start()
a<-table.row.start(a)
a<-table.element(a,'Autocorrelation Function',4,TRUE)
a<-table.row.end(a)
a<-table.row.start(a)
a<-table.element(a,'Time lag k',header=TRUE)
a<-table.element(a,hyperlink('basics.htm','ACF(k)','click here for more information about the Autocorrelation Function'),header=TRUE)
a<-table.element(a,'T-STAT',header=TRUE)
a<-table.element(a,'P-value',header=TRUE)
a<-table.row.end(a)
for (i in 2:(par1+1)) {
a<-table.row.start(a)
a<-table.element(a,i-1,header=TRUE)
a<-table.element(a,round(myacf[i],6))
mytstat <- myacf[i]*sqrtn
a<-table.element(a,round(mytstat,4))
a<-table.element(a,round(1-pt(abs(mytstat),lengthx),6))
a<-table.row.end(a)
}
a<-table.end(a)
table.save(a,file='mytable.tab')
a<-table.start()
a<-table.row.start(a)
a<-table.element(a,'Partial Autocorrelation Function',4,TRUE)
a<-table.row.end(a)
a<-table.row.start(a)
a<-table.element(a,'Time lag k',header=TRUE)
a<-table.element(a,hyperlink('basics.htm','PACF(k)','click here for more information about the Partial Autocorrelation Function'),header=TRUE)
a<-table.element(a,'T-STAT',header=TRUE)
a<-table.element(a,'P-value',header=TRUE)
a<-table.row.end(a)
for (i in 1:par1) {
a<-table.row.start(a)
a<-table.element(a,i,header=TRUE)
a<-table.element(a,round(mypacf[i],6))
mytstat <- mypacf[i]*sqrtn
a<-table.element(a,round(mytstat,4))
a<-table.element(a,round(1-pt(abs(mytstat),lengthx),6))
a<-table.row.end(a)
}
a<-table.end(a)
table.save(a,file='mytable1.tab')