Free Statistics

of Irreproducible Research!

Author's title

Author*Unverified author*
R Software Modulerwasp_autocorrelation.wasp
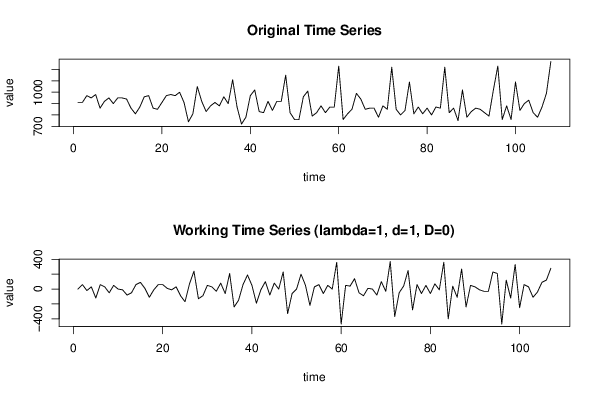
Title produced by software(Partial) Autocorrelation Function
Date of computationTue, 20 Aug 2013 22:15:41 -0400
Cite this page as followsStatistical Computations at FreeStatistics.org, Office for Research Development and Education, URL https://freestatistics.org/blog/index.php?v=date/2013/Aug/20/t1377051409m98pc2v1i3bnesm.htm/, Retrieved Sat, 27 Apr 2024 08:53:46 +0000
Statistical Computations at FreeStatistics.org, Office for Research Development and Education, URL https://freestatistics.org/blog/index.php?pk=211279, Retrieved Sat, 27 Apr 2024 08:53:46 +0000
QR Codes:

Original text written by user:
IsPrivate?No (this computation is public)
User-defined keywordsRaedts Mathias
Estimated Impact92
Family? (F = Feedback message, R = changed R code, M = changed R Module, P = changed Parameters, D = changed Data)
-       [(Partial) Autocorrelation Function] [Tijdreeks B - Sta...] [2013-08-21 02:15:41] [e2e43c39163d7563005e2a800525cced] [Current]
Feedback Forum

Post a new message
Dataseries X:
910
910
970
950
980
860
920
950
900
950
950
940
860
810
870
960
970
860
850
910
970
980
970
1000
910
740
810
1050
920
830
880
910
880
960
900
1110
870
720
780
970
1020
830
820
920
840
920
920
1150
820
760
760
960
1010
790
820
880
820
870
870
1230
760
810
850
990
940
850
860
860
780
880
850
1220
850
800
840
1090
810
870
810
860
800
870
860
1220
820
860
750
1020
780
830
860
850
820
790
1020
1230
760
880
760
1090
840
900
930
820
780
870
990
1270


Summary of computational transaction
Raw Inputview raw input (R code)
Raw Outputview raw output of R engine
Computing time3 seconds
R Server'Gertrude Mary Cox' @ cox.wessa.net

\begin{tabular}{lllllllll}
\hline
Summary of computational transaction \tabularnewline
Raw Input & view raw input (R code)  \tabularnewline
Raw Output & view raw output of R engine  \tabularnewline
Computing time & 3 seconds \tabularnewline
R Server & 'Gertrude Mary Cox' @ cox.wessa.net \tabularnewline
\hline
\end{tabular}
%Source: https://freestatistics.org/blog/index.php?pk=211279&T=0

[TABLE]
[ROW][C]Summary of computational transaction[/C][/ROW]
[ROW][C]Raw Input[/C][C]view raw input (R code) [/C][/ROW]
[ROW][C]Raw Output[/C][C]view raw output of R engine [/C][/ROW]
[ROW][C]Computing time[/C][C]3 seconds[/C][/ROW]
[ROW][C]R Server[/C][C]'Gertrude Mary Cox' @ cox.wessa.net[/C][/ROW]
[/TABLE]
Source: https://freestatistics.org/blog/index.php?pk=211279&T=0

Globally Unique Identifier (entire table): ba.freestatistics.org/blog/index.php?pk=211279&T=0

As an alternative you can also use a QR Code:  

The GUIDs for individual cells are displayed in the table below:

Summary of computational transaction
Raw Inputview raw input (R code)
Raw Outputview raw output of R engine
Computing time3 seconds
R Server'Gertrude Mary Cox' @ cox.wessa.net


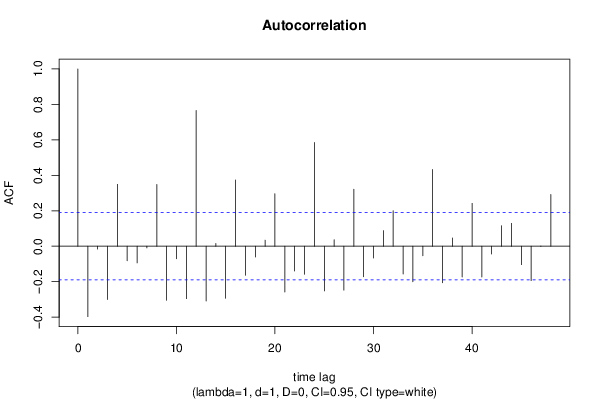
Autocorrelation Function
Time lag kACF(k)T-STATP-value
1-0.397379-4.11053.9e-05
2-0.016282-0.16840.433286
3-0.3003-3.10630.001213
40.3489053.60910.000235
5-0.081852-0.84670.19953
6-0.094205-0.97450.166013
7-0.009523-0.09850.460856
80.3479413.59910.000243
9-0.305385-3.15890.001029
10-0.070377-0.7280.234106
11-0.295734-3.05910.001403
120.7652277.91560
13-0.308938-3.19570.000917
140.0150680.15590.438218
15-0.2937-3.03810.001496
160.3738063.86679.5e-05
17-0.164052-1.6970.046305
18-0.060842-0.62930.265231
190.0341880.35360.36215
200.2963413.06540.001376
21-0.258169-2.67050.004378
22-0.139616-1.44420.075802
23-0.158609-1.64070.051902
240.5855996.05750
25-0.251984-2.60650.005225
260.0369340.3820.351592
27-0.247808-2.56330.005878
280.3216433.32710.000602
29-0.172795-1.78740.038351
30-0.066718-0.69010.245802
310.0879670.90990.18245
320.1999292.06810.020522
33-0.156894-1.62290.053774
34-0.200853-2.07760.020068
35-0.053495-0.55340.290586
360.4332544.48169e-06
37-0.206285-2.13380.017571
380.046350.47950.316298
39-0.173728-1.79710.037573
400.2419292.50250.006922
41-0.174097-1.80090.03727
42-0.044455-0.45980.323279
430.1154791.19450.117457
440.1289181.33350.092593
45-0.103982-1.07560.142263
46-0.194316-2.010.023473
47-0.001116-0.01150.495404
480.2915513.01580.001601

\begin{tabular}{lllllllll}
\hline
Autocorrelation Function \tabularnewline
Time lag k & ACF(k) & T-STAT & P-value \tabularnewline
1 & -0.397379 & -4.1105 & 3.9e-05 \tabularnewline
2 & -0.016282 & -0.1684 & 0.433286 \tabularnewline
3 & -0.3003 & -3.1063 & 0.001213 \tabularnewline
4 & 0.348905 & 3.6091 & 0.000235 \tabularnewline
5 & -0.081852 & -0.8467 & 0.19953 \tabularnewline
6 & -0.094205 & -0.9745 & 0.166013 \tabularnewline
7 & -0.009523 & -0.0985 & 0.460856 \tabularnewline
8 & 0.347941 & 3.5991 & 0.000243 \tabularnewline
9 & -0.305385 & -3.1589 & 0.001029 \tabularnewline
10 & -0.070377 & -0.728 & 0.234106 \tabularnewline
11 & -0.295734 & -3.0591 & 0.001403 \tabularnewline
12 & 0.765227 & 7.9156 & 0 \tabularnewline
13 & -0.308938 & -3.1957 & 0.000917 \tabularnewline
14 & 0.015068 & 0.1559 & 0.438218 \tabularnewline
15 & -0.2937 & -3.0381 & 0.001496 \tabularnewline
16 & 0.373806 & 3.8667 & 9.5e-05 \tabularnewline
17 & -0.164052 & -1.697 & 0.046305 \tabularnewline
18 & -0.060842 & -0.6293 & 0.265231 \tabularnewline
19 & 0.034188 & 0.3536 & 0.36215 \tabularnewline
20 & 0.296341 & 3.0654 & 0.001376 \tabularnewline
21 & -0.258169 & -2.6705 & 0.004378 \tabularnewline
22 & -0.139616 & -1.4442 & 0.075802 \tabularnewline
23 & -0.158609 & -1.6407 & 0.051902 \tabularnewline
24 & 0.585599 & 6.0575 & 0 \tabularnewline
25 & -0.251984 & -2.6065 & 0.005225 \tabularnewline
26 & 0.036934 & 0.382 & 0.351592 \tabularnewline
27 & -0.247808 & -2.5633 & 0.005878 \tabularnewline
28 & 0.321643 & 3.3271 & 0.000602 \tabularnewline
29 & -0.172795 & -1.7874 & 0.038351 \tabularnewline
30 & -0.066718 & -0.6901 & 0.245802 \tabularnewline
31 & 0.087967 & 0.9099 & 0.18245 \tabularnewline
32 & 0.199929 & 2.0681 & 0.020522 \tabularnewline
33 & -0.156894 & -1.6229 & 0.053774 \tabularnewline
34 & -0.200853 & -2.0776 & 0.020068 \tabularnewline
35 & -0.053495 & -0.5534 & 0.290586 \tabularnewline
36 & 0.433254 & 4.4816 & 9e-06 \tabularnewline
37 & -0.206285 & -2.1338 & 0.017571 \tabularnewline
38 & 0.04635 & 0.4795 & 0.316298 \tabularnewline
39 & -0.173728 & -1.7971 & 0.037573 \tabularnewline
40 & 0.241929 & 2.5025 & 0.006922 \tabularnewline
41 & -0.174097 & -1.8009 & 0.03727 \tabularnewline
42 & -0.044455 & -0.4598 & 0.323279 \tabularnewline
43 & 0.115479 & 1.1945 & 0.117457 \tabularnewline
44 & 0.128918 & 1.3335 & 0.092593 \tabularnewline
45 & -0.103982 & -1.0756 & 0.142263 \tabularnewline
46 & -0.194316 & -2.01 & 0.023473 \tabularnewline
47 & -0.001116 & -0.0115 & 0.495404 \tabularnewline
48 & 0.291551 & 3.0158 & 0.001601 \tabularnewline
\hline
\end{tabular}
%Source: https://freestatistics.org/blog/index.php?pk=211279&T=1

[TABLE]
[ROW][C]Autocorrelation Function[/C][/ROW]
[ROW][C]Time lag k[/C][C]ACF(k)[/C][C]T-STAT[/C][C]P-value[/C][/ROW]
[ROW][C]1[/C][C]-0.397379[/C][C]-4.1105[/C][C]3.9e-05[/C][/ROW]
[ROW][C]2[/C][C]-0.016282[/C][C]-0.1684[/C][C]0.433286[/C][/ROW]
[ROW][C]3[/C][C]-0.3003[/C][C]-3.1063[/C][C]0.001213[/C][/ROW]
[ROW][C]4[/C][C]0.348905[/C][C]3.6091[/C][C]0.000235[/C][/ROW]
[ROW][C]5[/C][C]-0.081852[/C][C]-0.8467[/C][C]0.19953[/C][/ROW]
[ROW][C]6[/C][C]-0.094205[/C][C]-0.9745[/C][C]0.166013[/C][/ROW]
[ROW][C]7[/C][C]-0.009523[/C][C]-0.0985[/C][C]0.460856[/C][/ROW]
[ROW][C]8[/C][C]0.347941[/C][C]3.5991[/C][C]0.000243[/C][/ROW]
[ROW][C]9[/C][C]-0.305385[/C][C]-3.1589[/C][C]0.001029[/C][/ROW]
[ROW][C]10[/C][C]-0.070377[/C][C]-0.728[/C][C]0.234106[/C][/ROW]
[ROW][C]11[/C][C]-0.295734[/C][C]-3.0591[/C][C]0.001403[/C][/ROW]
[ROW][C]12[/C][C]0.765227[/C][C]7.9156[/C][C]0[/C][/ROW]
[ROW][C]13[/C][C]-0.308938[/C][C]-3.1957[/C][C]0.000917[/C][/ROW]
[ROW][C]14[/C][C]0.015068[/C][C]0.1559[/C][C]0.438218[/C][/ROW]
[ROW][C]15[/C][C]-0.2937[/C][C]-3.0381[/C][C]0.001496[/C][/ROW]
[ROW][C]16[/C][C]0.373806[/C][C]3.8667[/C][C]9.5e-05[/C][/ROW]
[ROW][C]17[/C][C]-0.164052[/C][C]-1.697[/C][C]0.046305[/C][/ROW]
[ROW][C]18[/C][C]-0.060842[/C][C]-0.6293[/C][C]0.265231[/C][/ROW]
[ROW][C]19[/C][C]0.034188[/C][C]0.3536[/C][C]0.36215[/C][/ROW]
[ROW][C]20[/C][C]0.296341[/C][C]3.0654[/C][C]0.001376[/C][/ROW]
[ROW][C]21[/C][C]-0.258169[/C][C]-2.6705[/C][C]0.004378[/C][/ROW]
[ROW][C]22[/C][C]-0.139616[/C][C]-1.4442[/C][C]0.075802[/C][/ROW]
[ROW][C]23[/C][C]-0.158609[/C][C]-1.6407[/C][C]0.051902[/C][/ROW]
[ROW][C]24[/C][C]0.585599[/C][C]6.0575[/C][C]0[/C][/ROW]
[ROW][C]25[/C][C]-0.251984[/C][C]-2.6065[/C][C]0.005225[/C][/ROW]
[ROW][C]26[/C][C]0.036934[/C][C]0.382[/C][C]0.351592[/C][/ROW]
[ROW][C]27[/C][C]-0.247808[/C][C]-2.5633[/C][C]0.005878[/C][/ROW]
[ROW][C]28[/C][C]0.321643[/C][C]3.3271[/C][C]0.000602[/C][/ROW]
[ROW][C]29[/C][C]-0.172795[/C][C]-1.7874[/C][C]0.038351[/C][/ROW]
[ROW][C]30[/C][C]-0.066718[/C][C]-0.6901[/C][C]0.245802[/C][/ROW]
[ROW][C]31[/C][C]0.087967[/C][C]0.9099[/C][C]0.18245[/C][/ROW]
[ROW][C]32[/C][C]0.199929[/C][C]2.0681[/C][C]0.020522[/C][/ROW]
[ROW][C]33[/C][C]-0.156894[/C][C]-1.6229[/C][C]0.053774[/C][/ROW]
[ROW][C]34[/C][C]-0.200853[/C][C]-2.0776[/C][C]0.020068[/C][/ROW]
[ROW][C]35[/C][C]-0.053495[/C][C]-0.5534[/C][C]0.290586[/C][/ROW]
[ROW][C]36[/C][C]0.433254[/C][C]4.4816[/C][C]9e-06[/C][/ROW]
[ROW][C]37[/C][C]-0.206285[/C][C]-2.1338[/C][C]0.017571[/C][/ROW]
[ROW][C]38[/C][C]0.04635[/C][C]0.4795[/C][C]0.316298[/C][/ROW]
[ROW][C]39[/C][C]-0.173728[/C][C]-1.7971[/C][C]0.037573[/C][/ROW]
[ROW][C]40[/C][C]0.241929[/C][C]2.5025[/C][C]0.006922[/C][/ROW]
[ROW][C]41[/C][C]-0.174097[/C][C]-1.8009[/C][C]0.03727[/C][/ROW]
[ROW][C]42[/C][C]-0.044455[/C][C]-0.4598[/C][C]0.323279[/C][/ROW]
[ROW][C]43[/C][C]0.115479[/C][C]1.1945[/C][C]0.117457[/C][/ROW]
[ROW][C]44[/C][C]0.128918[/C][C]1.3335[/C][C]0.092593[/C][/ROW]
[ROW][C]45[/C][C]-0.103982[/C][C]-1.0756[/C][C]0.142263[/C][/ROW]
[ROW][C]46[/C][C]-0.194316[/C][C]-2.01[/C][C]0.023473[/C][/ROW]
[ROW][C]47[/C][C]-0.001116[/C][C]-0.0115[/C][C]0.495404[/C][/ROW]
[ROW][C]48[/C][C]0.291551[/C][C]3.0158[/C][C]0.001601[/C][/ROW]
[/TABLE]
Source: https://freestatistics.org/blog/index.php?pk=211279&T=1

Globally Unique Identifier (entire table): ba.freestatistics.org/blog/index.php?pk=211279&T=1

As an alternative you can also use a QR Code:  

The GUIDs for individual cells are displayed in the table below:

Autocorrelation Function
Time lag kACF(k)T-STATP-value
1-0.397379-4.11053.9e-05
2-0.016282-0.16840.433286
3-0.3003-3.10630.001213
40.3489053.60910.000235
5-0.081852-0.84670.19953
6-0.094205-0.97450.166013
7-0.009523-0.09850.460856
80.3479413.59910.000243
9-0.305385-3.15890.001029
10-0.070377-0.7280.234106
11-0.295734-3.05910.001403
120.7652277.91560
13-0.308938-3.19570.000917
140.0150680.15590.438218
15-0.2937-3.03810.001496
160.3738063.86679.5e-05
17-0.164052-1.6970.046305
18-0.060842-0.62930.265231
190.0341880.35360.36215
200.2963413.06540.001376
21-0.258169-2.67050.004378
22-0.139616-1.44420.075802
23-0.158609-1.64070.051902
240.5855996.05750
25-0.251984-2.60650.005225
260.0369340.3820.351592
27-0.247808-2.56330.005878
280.3216433.32710.000602
29-0.172795-1.78740.038351
30-0.066718-0.69010.245802
310.0879670.90990.18245
320.1999292.06810.020522
33-0.156894-1.62290.053774
34-0.200853-2.07760.020068
35-0.053495-0.55340.290586
360.4332544.48169e-06
37-0.206285-2.13380.017571
380.046350.47950.316298
39-0.173728-1.79710.037573
400.2419292.50250.006922
41-0.174097-1.80090.03727
42-0.044455-0.45980.323279
430.1154791.19450.117457
440.1289181.33350.092593
45-0.103982-1.07560.142263
46-0.194316-2.010.023473
47-0.001116-0.01150.495404
480.2915513.01580.001601


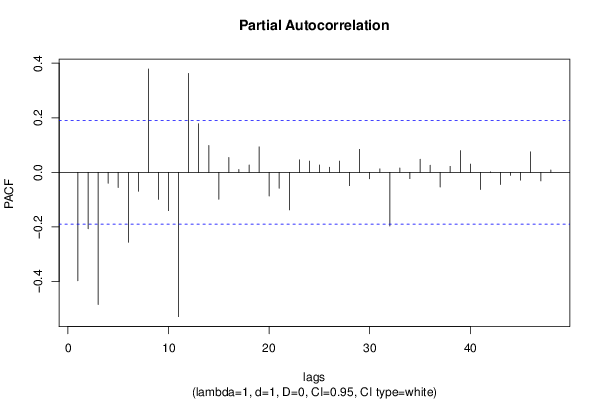
Partial Autocorrelation Function
Time lag kPACF(k)T-STATP-value
1-0.397379-4.11053.9e-05
2-0.206857-2.13970.017324
3-0.48422-5.00881e-06
4-0.040125-0.41510.339464
5-0.055435-0.57340.283782
6-0.256431-2.65250.004602
7-0.069446-0.71840.237052
80.3790263.92077.8e-05
9-0.099176-1.02590.153629
10-0.14047-1.4530.07457
11-0.528992-5.47190
120.3627073.75190.000143
130.1779241.84050.034236
140.0986991.0210.15479
15-0.098804-1.0220.154535
160.0543020.56170.287745
170.0104590.10820.457026
180.0270840.28020.389948
190.093360.96570.168179
20-0.086771-0.89760.185717
21-0.058312-0.60320.273832
22-0.137652-1.42390.078694
230.0458860.47470.318001
240.0410930.42510.335819
250.0267230.27640.391379
260.0188880.19540.422734
270.0412820.4270.335111
28-0.048608-0.50280.308068
290.0843840.87290.192344
30-0.023804-0.24620.402989
310.0127840.13220.447523
32-0.196751-2.03520.022151
330.0162670.16830.433347
34-0.023178-0.23980.405487
350.0477830.49430.311063
360.0261850.27090.393511
37-0.053733-0.55580.289748
380.0220440.2280.410031
390.0797490.82490.205623
400.0301090.31140.378034
41-0.062663-0.64820.259124
420.0018980.01960.492188
43-0.044303-0.45830.323844
44-0.011279-0.11670.45367
45-0.02858-0.29560.384041
460.0751960.77780.219192
47-0.031258-0.32330.373536
480.0089340.09240.463271

\begin{tabular}{lllllllll}
\hline
Partial Autocorrelation Function \tabularnewline
Time lag k & PACF(k) & T-STAT & P-value \tabularnewline
1 & -0.397379 & -4.1105 & 3.9e-05 \tabularnewline
2 & -0.206857 & -2.1397 & 0.017324 \tabularnewline
3 & -0.48422 & -5.0088 & 1e-06 \tabularnewline
4 & -0.040125 & -0.4151 & 0.339464 \tabularnewline
5 & -0.055435 & -0.5734 & 0.283782 \tabularnewline
6 & -0.256431 & -2.6525 & 0.004602 \tabularnewline
7 & -0.069446 & -0.7184 & 0.237052 \tabularnewline
8 & 0.379026 & 3.9207 & 7.8e-05 \tabularnewline
9 & -0.099176 & -1.0259 & 0.153629 \tabularnewline
10 & -0.14047 & -1.453 & 0.07457 \tabularnewline
11 & -0.528992 & -5.4719 & 0 \tabularnewline
12 & 0.362707 & 3.7519 & 0.000143 \tabularnewline
13 & 0.177924 & 1.8405 & 0.034236 \tabularnewline
14 & 0.098699 & 1.021 & 0.15479 \tabularnewline
15 & -0.098804 & -1.022 & 0.154535 \tabularnewline
16 & 0.054302 & 0.5617 & 0.287745 \tabularnewline
17 & 0.010459 & 0.1082 & 0.457026 \tabularnewline
18 & 0.027084 & 0.2802 & 0.389948 \tabularnewline
19 & 0.09336 & 0.9657 & 0.168179 \tabularnewline
20 & -0.086771 & -0.8976 & 0.185717 \tabularnewline
21 & -0.058312 & -0.6032 & 0.273832 \tabularnewline
22 & -0.137652 & -1.4239 & 0.078694 \tabularnewline
23 & 0.045886 & 0.4747 & 0.318001 \tabularnewline
24 & 0.041093 & 0.4251 & 0.335819 \tabularnewline
25 & 0.026723 & 0.2764 & 0.391379 \tabularnewline
26 & 0.018888 & 0.1954 & 0.422734 \tabularnewline
27 & 0.041282 & 0.427 & 0.335111 \tabularnewline
28 & -0.048608 & -0.5028 & 0.308068 \tabularnewline
29 & 0.084384 & 0.8729 & 0.192344 \tabularnewline
30 & -0.023804 & -0.2462 & 0.402989 \tabularnewline
31 & 0.012784 & 0.1322 & 0.447523 \tabularnewline
32 & -0.196751 & -2.0352 & 0.022151 \tabularnewline
33 & 0.016267 & 0.1683 & 0.433347 \tabularnewline
34 & -0.023178 & -0.2398 & 0.405487 \tabularnewline
35 & 0.047783 & 0.4943 & 0.311063 \tabularnewline
36 & 0.026185 & 0.2709 & 0.393511 \tabularnewline
37 & -0.053733 & -0.5558 & 0.289748 \tabularnewline
38 & 0.022044 & 0.228 & 0.410031 \tabularnewline
39 & 0.079749 & 0.8249 & 0.205623 \tabularnewline
40 & 0.030109 & 0.3114 & 0.378034 \tabularnewline
41 & -0.062663 & -0.6482 & 0.259124 \tabularnewline
42 & 0.001898 & 0.0196 & 0.492188 \tabularnewline
43 & -0.044303 & -0.4583 & 0.323844 \tabularnewline
44 & -0.011279 & -0.1167 & 0.45367 \tabularnewline
45 & -0.02858 & -0.2956 & 0.384041 \tabularnewline
46 & 0.075196 & 0.7778 & 0.219192 \tabularnewline
47 & -0.031258 & -0.3233 & 0.373536 \tabularnewline
48 & 0.008934 & 0.0924 & 0.463271 \tabularnewline
\hline
\end{tabular}
%Source: https://freestatistics.org/blog/index.php?pk=211279&T=2

[TABLE]
[ROW][C]Partial Autocorrelation Function[/C][/ROW]
[ROW][C]Time lag k[/C][C]PACF(k)[/C][C]T-STAT[/C][C]P-value[/C][/ROW]
[ROW][C]1[/C][C]-0.397379[/C][C]-4.1105[/C][C]3.9e-05[/C][/ROW]
[ROW][C]2[/C][C]-0.206857[/C][C]-2.1397[/C][C]0.017324[/C][/ROW]
[ROW][C]3[/C][C]-0.48422[/C][C]-5.0088[/C][C]1e-06[/C][/ROW]
[ROW][C]4[/C][C]-0.040125[/C][C]-0.4151[/C][C]0.339464[/C][/ROW]
[ROW][C]5[/C][C]-0.055435[/C][C]-0.5734[/C][C]0.283782[/C][/ROW]
[ROW][C]6[/C][C]-0.256431[/C][C]-2.6525[/C][C]0.004602[/C][/ROW]
[ROW][C]7[/C][C]-0.069446[/C][C]-0.7184[/C][C]0.237052[/C][/ROW]
[ROW][C]8[/C][C]0.379026[/C][C]3.9207[/C][C]7.8e-05[/C][/ROW]
[ROW][C]9[/C][C]-0.099176[/C][C]-1.0259[/C][C]0.153629[/C][/ROW]
[ROW][C]10[/C][C]-0.14047[/C][C]-1.453[/C][C]0.07457[/C][/ROW]
[ROW][C]11[/C][C]-0.528992[/C][C]-5.4719[/C][C]0[/C][/ROW]
[ROW][C]12[/C][C]0.362707[/C][C]3.7519[/C][C]0.000143[/C][/ROW]
[ROW][C]13[/C][C]0.177924[/C][C]1.8405[/C][C]0.034236[/C][/ROW]
[ROW][C]14[/C][C]0.098699[/C][C]1.021[/C][C]0.15479[/C][/ROW]
[ROW][C]15[/C][C]-0.098804[/C][C]-1.022[/C][C]0.154535[/C][/ROW]
[ROW][C]16[/C][C]0.054302[/C][C]0.5617[/C][C]0.287745[/C][/ROW]
[ROW][C]17[/C][C]0.010459[/C][C]0.1082[/C][C]0.457026[/C][/ROW]
[ROW][C]18[/C][C]0.027084[/C][C]0.2802[/C][C]0.389948[/C][/ROW]
[ROW][C]19[/C][C]0.09336[/C][C]0.9657[/C][C]0.168179[/C][/ROW]
[ROW][C]20[/C][C]-0.086771[/C][C]-0.8976[/C][C]0.185717[/C][/ROW]
[ROW][C]21[/C][C]-0.058312[/C][C]-0.6032[/C][C]0.273832[/C][/ROW]
[ROW][C]22[/C][C]-0.137652[/C][C]-1.4239[/C][C]0.078694[/C][/ROW]
[ROW][C]23[/C][C]0.045886[/C][C]0.4747[/C][C]0.318001[/C][/ROW]
[ROW][C]24[/C][C]0.041093[/C][C]0.4251[/C][C]0.335819[/C][/ROW]
[ROW][C]25[/C][C]0.026723[/C][C]0.2764[/C][C]0.391379[/C][/ROW]
[ROW][C]26[/C][C]0.018888[/C][C]0.1954[/C][C]0.422734[/C][/ROW]
[ROW][C]27[/C][C]0.041282[/C][C]0.427[/C][C]0.335111[/C][/ROW]
[ROW][C]28[/C][C]-0.048608[/C][C]-0.5028[/C][C]0.308068[/C][/ROW]
[ROW][C]29[/C][C]0.084384[/C][C]0.8729[/C][C]0.192344[/C][/ROW]
[ROW][C]30[/C][C]-0.023804[/C][C]-0.2462[/C][C]0.402989[/C][/ROW]
[ROW][C]31[/C][C]0.012784[/C][C]0.1322[/C][C]0.447523[/C][/ROW]
[ROW][C]32[/C][C]-0.196751[/C][C]-2.0352[/C][C]0.022151[/C][/ROW]
[ROW][C]33[/C][C]0.016267[/C][C]0.1683[/C][C]0.433347[/C][/ROW]
[ROW][C]34[/C][C]-0.023178[/C][C]-0.2398[/C][C]0.405487[/C][/ROW]
[ROW][C]35[/C][C]0.047783[/C][C]0.4943[/C][C]0.311063[/C][/ROW]
[ROW][C]36[/C][C]0.026185[/C][C]0.2709[/C][C]0.393511[/C][/ROW]
[ROW][C]37[/C][C]-0.053733[/C][C]-0.5558[/C][C]0.289748[/C][/ROW]
[ROW][C]38[/C][C]0.022044[/C][C]0.228[/C][C]0.410031[/C][/ROW]
[ROW][C]39[/C][C]0.079749[/C][C]0.8249[/C][C]0.205623[/C][/ROW]
[ROW][C]40[/C][C]0.030109[/C][C]0.3114[/C][C]0.378034[/C][/ROW]
[ROW][C]41[/C][C]-0.062663[/C][C]-0.6482[/C][C]0.259124[/C][/ROW]
[ROW][C]42[/C][C]0.001898[/C][C]0.0196[/C][C]0.492188[/C][/ROW]
[ROW][C]43[/C][C]-0.044303[/C][C]-0.4583[/C][C]0.323844[/C][/ROW]
[ROW][C]44[/C][C]-0.011279[/C][C]-0.1167[/C][C]0.45367[/C][/ROW]
[ROW][C]45[/C][C]-0.02858[/C][C]-0.2956[/C][C]0.384041[/C][/ROW]
[ROW][C]46[/C][C]0.075196[/C][C]0.7778[/C][C]0.219192[/C][/ROW]
[ROW][C]47[/C][C]-0.031258[/C][C]-0.3233[/C][C]0.373536[/C][/ROW]
[ROW][C]48[/C][C]0.008934[/C][C]0.0924[/C][C]0.463271[/C][/ROW]
[/TABLE]
Source: https://freestatistics.org/blog/index.php?pk=211279&T=2

Globally Unique Identifier (entire table): ba.freestatistics.org/blog/index.php?pk=211279&T=2

As an alternative you can also use a QR Code:  

The GUIDs for individual cells are displayed in the table below:

Partial Autocorrelation Function
Time lag kPACF(k)T-STATP-value
1-0.397379-4.11053.9e-05
2-0.206857-2.13970.017324
3-0.48422-5.00881e-06
4-0.040125-0.41510.339464
5-0.055435-0.57340.283782
6-0.256431-2.65250.004602
7-0.069446-0.71840.237052
80.3790263.92077.8e-05
9-0.099176-1.02590.153629
10-0.14047-1.4530.07457
11-0.528992-5.47190
120.3627073.75190.000143
130.1779241.84050.034236
140.0986991.0210.15479
15-0.098804-1.0220.154535
160.0543020.56170.287745
170.0104590.10820.457026
180.0270840.28020.389948
190.093360.96570.168179
20-0.086771-0.89760.185717
21-0.058312-0.60320.273832
22-0.137652-1.42390.078694
230.0458860.47470.318001
240.0410930.42510.335819
250.0267230.27640.391379
260.0188880.19540.422734
270.0412820.4270.335111
28-0.048608-0.50280.308068
290.0843840.87290.192344
30-0.023804-0.24620.402989
310.0127840.13220.447523
32-0.196751-2.03520.022151
330.0162670.16830.433347
34-0.023178-0.23980.405487
350.0477830.49430.311063
360.0261850.27090.393511
37-0.053733-0.55580.289748
380.0220440.2280.410031
390.0797490.82490.205623
400.0301090.31140.378034
41-0.062663-0.64820.259124
420.0018980.01960.492188
43-0.044303-0.45830.323844
44-0.011279-0.11670.45367
45-0.02858-0.29560.384041
460.0751960.77780.219192
47-0.031258-0.32330.373536
480.0089340.09240.463271


Parameters (Session):
par1 = 22 ; par2 = grey ; par3 = FALSE ; par4 = Unknown ;
Parameters (R input):
par1 = 48 ; par2 = 1 ; par3 = 1 ; par4 = 0 ; par5 = 12 ; par6 = White Noise ; par7 = 0.95 ; par8 = ;
R code (references can be found in the software module):
par8 <- ''
par7 <- '0.95'
par6 <- 'White Noise'
par5 <- '12'
par4 <- '0'
par3 <- '0'
par2 <- '1'
par1 <- '48'
if (par1 == 'Default') {
par1 = 10*log10(length(x))
} else {
par1 <- as.numeric(par1)
}
par2 <- as.numeric(par2)
par3 <- as.numeric(par3)
par4 <- as.numeric(par4)
par5 <- as.numeric(par5)
if (par6 == 'White Noise') par6 <- 'white' else par6 <- 'ma'
par7 <- as.numeric(par7)
if (par8 != '') par8 <- as.numeric(par8)
ox <- x
if (par8 == '') {
if (par2 == 0) {
x <- log(x)
} else {
x <- (x ^ par2 - 1) / par2
}
} else {
x <- log(x,base=par8)
}
if (par3 > 0) x <- diff(x,lag=1,difference=par3)
if (par4 > 0) x <- diff(x,lag=par5,difference=par4)
bitmap(file='picts.png')
op <- par(mfrow=c(2,1))
plot(ox,type='l',main='Original Time Series',xlab='time',ylab='value')
if (par8=='') {
mytitle <- paste('Working Time Series (lambda=',par2,', d=',par3,', D=',par4,')',sep='')
mysub <- paste('(lambda=',par2,', d=',par3,', D=',par4,', CI=', par7, ', CI type=',par6,')',sep='')
} else {
mytitle <- paste('Working Time Series (base=',par8,', d=',par3,', D=',par4,')',sep='')
mysub <- paste('(base=',par8,', d=',par3,', D=',par4,', CI=', par7, ', CI type=',par6,')',sep='')
}
plot(x,type='l', main=mytitle,xlab='time',ylab='value')
par(op)
dev.off()
bitmap(file='pic1.png')
racf <- acf(x, par1, main='Autocorrelation', xlab='time lag', ylab='ACF', ci.type=par6, ci=par7, sub=mysub)
dev.off()
bitmap(file='pic2.png')
rpacf <- pacf(x,par1,main='Partial Autocorrelation',xlab='lags',ylab='PACF',sub=mysub)
dev.off()
(myacf <- c(racf$acf))
(mypacf <- c(rpacf$acf))
lengthx <- length(x)
sqrtn <- sqrt(lengthx)
load(file='createtable')
a<-table.start()
a<-table.row.start(a)
a<-table.element(a,'Autocorrelation Function',4,TRUE)
a<-table.row.end(a)
a<-table.row.start(a)
a<-table.element(a,'Time lag k',header=TRUE)
a<-table.element(a,hyperlink('basics.htm','ACF(k)','click here for more information about the Autocorrelation Function'),header=TRUE)
a<-table.element(a,'T-STAT',header=TRUE)
a<-table.element(a,'P-value',header=TRUE)
a<-table.row.end(a)
for (i in 2:(par1+1)) {
a<-table.row.start(a)
a<-table.element(a,i-1,header=TRUE)
a<-table.element(a,round(myacf[i],6))
mytstat <- myacf[i]*sqrtn
a<-table.element(a,round(mytstat,4))
a<-table.element(a,round(1-pt(abs(mytstat),lengthx),6))
a<-table.row.end(a)
}
a<-table.end(a)
table.save(a,file='mytable.tab')
a<-table.start()
a<-table.row.start(a)
a<-table.element(a,'Partial Autocorrelation Function',4,TRUE)
a<-table.row.end(a)
a<-table.row.start(a)
a<-table.element(a,'Time lag k',header=TRUE)
a<-table.element(a,hyperlink('basics.htm','PACF(k)','click here for more information about the Partial Autocorrelation Function'),header=TRUE)
a<-table.element(a,'T-STAT',header=TRUE)
a<-table.element(a,'P-value',header=TRUE)
a<-table.row.end(a)
for (i in 1:par1) {
a<-table.row.start(a)
a<-table.element(a,i,header=TRUE)
a<-table.element(a,round(mypacf[i],6))
mytstat <- mypacf[i]*sqrtn
a<-table.element(a,round(mytstat,4))
a<-table.element(a,round(1-pt(abs(mytstat),lengthx),6))
a<-table.row.end(a)
}
a<-table.end(a)
table.save(a,file='mytable1.tab')