Free Statistics

of Irreproducible Research!

Author's title

Author*Unverified author*
R Software Modulerwasp_smp.wasp
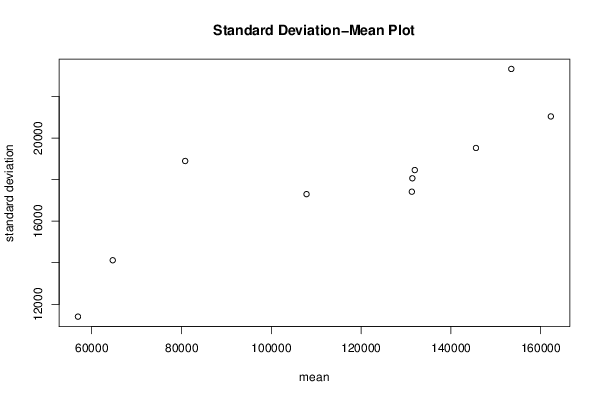
Title produced by softwareStandard Deviation-Mean Plot
Date of computationTue, 20 Aug 2013 23:10:55 -0400
Cite this page as followsStatistical Computations at FreeStatistics.org, Office for Research Development and Education, URL https://freestatistics.org/blog/index.php?v=date/2013/Aug/20/t1377055601bf78ky7oa0dy91z.htm/, Retrieved Sat, 27 Apr 2024 06:18:41 +0000
Statistical Computations at FreeStatistics.org, Office for Research Development and Education, URL https://freestatistics.org/blog/index.php?pk=211281, Retrieved Sat, 27 Apr 2024 06:18:41 +0000
QR Codes:

Original text written by user:
IsPrivate?No (this computation is public)
User-defined keywordsRaedts Mathias
Estimated Impact61
Family? (F = Feedback message, R = changed R code, M = changed R Module, P = changed Parameters, D = changed Data)
-       [Standard Deviation-Mean Plot] [Tijdreeks A - Sta...] [2013-08-21 03:10:55] [e2e43c39163d7563005e2a800525cced] [Current]
Feedback Forum

Post a new message
Dataseries X:
58896
57616
56232
53708
79784
78524
58896
45848
47112
47112
48372
51040
54968
53708
45848
47112
83716
91572
70664
58896
61548
62828
69404
75856
77260
64088
65476
48372
96888
111200
78524
68016
74596
82452
94220
108656
108656
99412
95484
71928
111200
129564
113848
96888
99412
108656
121704
137420
126896
120444
120444
99412
129564
149188
133492
116516
121704
142612
151856
164888
154380
137420
133492
102080
122968
145260
120444
106008
120444
134756
142612
163624
153120
126896
129564
104744
125636
144000
122968
108656
121704
137420
134756
166168
160976
140068
141332
113848
130824
157048
137420
125636
145260
157048
147928
189724
179340
155784
149188
119056
136140
151856
132212
132212
154380
166168
159696
205420
193652
171484
162240
129564
141332
162240
146524
142612
160976
176672
159696
200228


Summary of computational transaction
Raw Inputview raw input (R code)
Raw Outputview raw output of R engine
Computing time3 seconds
R Server'Herman Ole Andreas Wold' @ wold.wessa.net

\begin{tabular}{lllllllll}
\hline
Summary of computational transaction \tabularnewline
Raw Input & view raw input (R code)  \tabularnewline
Raw Output & view raw output of R engine  \tabularnewline
Computing time & 3 seconds \tabularnewline
R Server & 'Herman Ole Andreas Wold' @ wold.wessa.net \tabularnewline
\hline
\end{tabular}
%Source: https://freestatistics.org/blog/index.php?pk=211281&T=0

[TABLE]
[ROW][C]Summary of computational transaction[/C][/ROW]
[ROW][C]Raw Input[/C][C]view raw input (R code) [/C][/ROW]
[ROW][C]Raw Output[/C][C]view raw output of R engine [/C][/ROW]
[ROW][C]Computing time[/C][C]3 seconds[/C][/ROW]
[ROW][C]R Server[/C][C]'Herman Ole Andreas Wold' @ wold.wessa.net[/C][/ROW]
[/TABLE]
Source: https://freestatistics.org/blog/index.php?pk=211281&T=0

Globally Unique Identifier (entire table): ba.freestatistics.org/blog/index.php?pk=211281&T=0

As an alternative you can also use a QR Code:  

The GUIDs for individual cells are displayed in the table below:

Summary of computational transaction
Raw Inputview raw input (R code)
Raw Outputview raw output of R engine
Computing time3 seconds
R Server'Herman Ole Andreas Wold' @ wold.wessa.net


Standard Deviation-Mean Plot
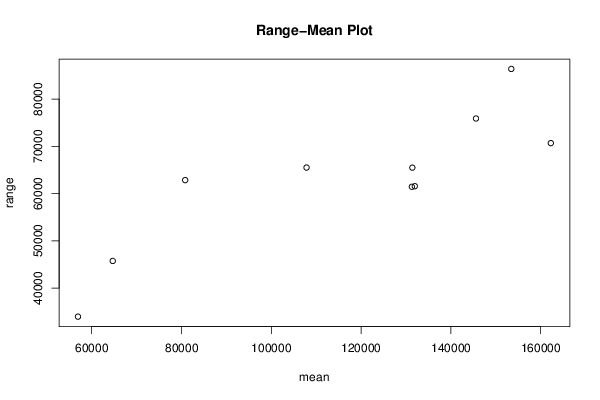
SectionMeanStandard DeviationRange
156928.333333333311406.552943839233936
264676.666666666714120.445507608245724
380812.333333333318894.653670637462828
4107847.66666666717299.99184095165492
513141818062.747561059165476
6131957.33333333318458.823548316461544
7131302.66666666717416.150275656361424
8145592.66666666719521.104948855875876
9153454.33333333323323.104764991986364
10162268.33333333321038.303869299270664

\begin{tabular}{lllllllll}
\hline
Standard Deviation-Mean Plot \tabularnewline
Section & Mean & Standard Deviation & Range \tabularnewline
1 & 56928.3333333333 & 11406.5529438392 & 33936 \tabularnewline
2 & 64676.6666666667 & 14120.4455076082 & 45724 \tabularnewline
3 & 80812.3333333333 & 18894.6536706374 & 62828 \tabularnewline
4 & 107847.666666667 & 17299.991840951 & 65492 \tabularnewline
5 & 131418 & 18062.7475610591 & 65476 \tabularnewline
6 & 131957.333333333 & 18458.8235483164 & 61544 \tabularnewline
7 & 131302.666666667 & 17416.1502756563 & 61424 \tabularnewline
8 & 145592.666666667 & 19521.1049488558 & 75876 \tabularnewline
9 & 153454.333333333 & 23323.1047649919 & 86364 \tabularnewline
10 & 162268.333333333 & 21038.3038692992 & 70664 \tabularnewline
\hline
\end{tabular}
%Source: https://freestatistics.org/blog/index.php?pk=211281&T=1

[TABLE]
[ROW][C]Standard Deviation-Mean Plot[/C][/ROW]
[ROW][C]Section[/C][C]Mean[/C][C]Standard Deviation[/C][C]Range[/C][/ROW]
[ROW][C]1[/C][C]56928.3333333333[/C][C]11406.5529438392[/C][C]33936[/C][/ROW]
[ROW][C]2[/C][C]64676.6666666667[/C][C]14120.4455076082[/C][C]45724[/C][/ROW]
[ROW][C]3[/C][C]80812.3333333333[/C][C]18894.6536706374[/C][C]62828[/C][/ROW]
[ROW][C]4[/C][C]107847.666666667[/C][C]17299.991840951[/C][C]65492[/C][/ROW]
[ROW][C]5[/C][C]131418[/C][C]18062.7475610591[/C][C]65476[/C][/ROW]
[ROW][C]6[/C][C]131957.333333333[/C][C]18458.8235483164[/C][C]61544[/C][/ROW]
[ROW][C]7[/C][C]131302.666666667[/C][C]17416.1502756563[/C][C]61424[/C][/ROW]
[ROW][C]8[/C][C]145592.666666667[/C][C]19521.1049488558[/C][C]75876[/C][/ROW]
[ROW][C]9[/C][C]153454.333333333[/C][C]23323.1047649919[/C][C]86364[/C][/ROW]
[ROW][C]10[/C][C]162268.333333333[/C][C]21038.3038692992[/C][C]70664[/C][/ROW]
[/TABLE]
Source: https://freestatistics.org/blog/index.php?pk=211281&T=1

Globally Unique Identifier (entire table): ba.freestatistics.org/blog/index.php?pk=211281&T=1

As an alternative you can also use a QR Code:  

The GUIDs for individual cells are displayed in the table below:

Standard Deviation-Mean Plot
SectionMeanStandard DeviationRange
156928.333333333311406.552943839233936
264676.666666666714120.445507608245724
380812.333333333318894.653670637462828
4107847.66666666717299.99184095165492
513141818062.747561059165476
6131957.33333333318458.823548316461544
7131302.66666666717416.150275656361424
8145592.66666666719521.104948855875876
9153454.33333333323323.104764991986364
10162268.33333333321038.303869299270664


Regression: S.E.(k) = alpha + beta * Mean(k)
alpha9163.9062249573
beta0.0753716515194388
S.D.0.0169291902138178
T-STAT4.45217110608866
p-value0.00213313507645315

\begin{tabular}{lllllllll}
\hline
Regression: S.E.(k) = alpha + beta * Mean(k) \tabularnewline
alpha & 9163.9062249573 \tabularnewline
beta & 0.0753716515194388 \tabularnewline
S.D. & 0.0169291902138178 \tabularnewline
T-STAT & 4.45217110608866 \tabularnewline
p-value & 0.00213313507645315 \tabularnewline
\hline
\end{tabular}
%Source: https://freestatistics.org/blog/index.php?pk=211281&T=2

[TABLE]
[ROW][C]Regression: S.E.(k) = alpha + beta * Mean(k)[/C][/ROW]
[ROW][C]alpha[/C][C]9163.9062249573[/C][/ROW]
[ROW][C]beta[/C][C]0.0753716515194388[/C][/ROW]
[ROW][C]S.D.[/C][C]0.0169291902138178[/C][/ROW]
[ROW][C]T-STAT[/C][C]4.45217110608866[/C][/ROW]
[ROW][C]p-value[/C][C]0.00213313507645315[/C][/ROW]
[/TABLE]
Source: https://freestatistics.org/blog/index.php?pk=211281&T=2

Globally Unique Identifier (entire table): ba.freestatistics.org/blog/index.php?pk=211281&T=2

As an alternative you can also use a QR Code:  

The GUIDs for individual cells are displayed in the table below:

Regression: S.E.(k) = alpha + beta * Mean(k)
alpha9163.9062249573
beta0.0753716515194388
S.D.0.0169291902138178
T-STAT4.45217110608866
p-value0.00213313507645315


Regression: ln S.E.(k) = alpha + beta * ln Mean(k)
alpha4.33939155835027
beta0.468453961525005
S.D.0.0964665506847875
T-STAT4.85612845281176
p-value0.00126199092221765
Lambda0.531546038474995

\begin{tabular}{lllllllll}
\hline
Regression: ln S.E.(k) = alpha + beta * ln Mean(k) \tabularnewline
alpha & 4.33939155835027 \tabularnewline
beta & 0.468453961525005 \tabularnewline
S.D. & 0.0964665506847875 \tabularnewline
T-STAT & 4.85612845281176 \tabularnewline
p-value & 0.00126199092221765 \tabularnewline
Lambda & 0.531546038474995 \tabularnewline
\hline
\end{tabular}
%Source: https://freestatistics.org/blog/index.php?pk=211281&T=3

[TABLE]
[ROW][C]Regression: ln S.E.(k) = alpha + beta * ln Mean(k)[/C][/ROW]
[ROW][C]alpha[/C][C]4.33939155835027[/C][/ROW]
[ROW][C]beta[/C][C]0.468453961525005[/C][/ROW]
[ROW][C]S.D.[/C][C]0.0964665506847875[/C][/ROW]
[ROW][C]T-STAT[/C][C]4.85612845281176[/C][/ROW]
[ROW][C]p-value[/C][C]0.00126199092221765[/C][/ROW]
[ROW][C]Lambda[/C][C]0.531546038474995[/C][/ROW]
[/TABLE]
Source: https://freestatistics.org/blog/index.php?pk=211281&T=3

Globally Unique Identifier (entire table): ba.freestatistics.org/blog/index.php?pk=211281&T=3

As an alternative you can also use a QR Code:  

The GUIDs for individual cells are displayed in the table below:

Regression: ln S.E.(k) = alpha + beta * ln Mean(k)
alpha4.33939155835027
beta0.468453961525005
S.D.0.0964665506847875
T-STAT4.85612845281176
p-value0.00126199092221765
Lambda0.531546038474995


Parameters (Session):
par1 = 22 ; par2 = grey ; par3 = FALSE ; par4 = Unknown ;
Parameters (R input):
par1 = 12 ;
R code (references can be found in the software module):
par1 <- as.numeric(par1)
(n <- length(x))
(np <- floor(n / par1))
arr <- array(NA,dim=c(par1,np))
j <- 0
k <- 1
for (i in 1:(np*par1))
{
j = j + 1
arr[j,k] <- x[i]
if (j == par1) {
j = 0
k=k+1
}
}
arr
arr.mean <- array(NA,dim=np)
arr.sd <- array(NA,dim=np)
arr.range <- array(NA,dim=np)
for (j in 1:np)
{
arr.mean[j] <- mean(arr[,j],na.rm=TRUE)
arr.sd[j] <- sd(arr[,j],na.rm=TRUE)
arr.range[j] <- max(arr[,j],na.rm=TRUE) - min(arr[,j],na.rm=TRUE)
}
arr.mean
arr.sd
arr.range
(lm1 <- lm(arr.sd~arr.mean))
(lnlm1 <- lm(log(arr.sd)~log(arr.mean)))
(lm2 <- lm(arr.range~arr.mean))
bitmap(file='test1.png')
plot(arr.mean,arr.sd,main='Standard Deviation-Mean Plot',xlab='mean',ylab='standard deviation')
dev.off()
bitmap(file='test2.png')
plot(arr.mean,arr.range,main='Range-Mean Plot',xlab='mean',ylab='range')
dev.off()
load(file='createtable')
a<-table.start()
a<-table.row.start(a)
a<-table.element(a,'Standard Deviation-Mean Plot',4,TRUE)
a<-table.row.end(a)
a<-table.row.start(a)
a<-table.element(a,'Section',header=TRUE)
a<-table.element(a,'Mean',header=TRUE)
a<-table.element(a,'Standard Deviation',header=TRUE)
a<-table.element(a,'Range',header=TRUE)
a<-table.row.end(a)
for (j in 1:np) {
a<-table.row.start(a)
a<-table.element(a,j,header=TRUE)
a<-table.element(a,arr.mean[j])
a<-table.element(a,arr.sd[j] )
a<-table.element(a,arr.range[j] )
a<-table.row.end(a)
}
a<-table.end(a)
table.save(a,file='mytable.tab')
a<-table.start()
a<-table.row.start(a)
a<-table.element(a,'Regression: S.E.(k) = alpha + beta * Mean(k)',2,TRUE)
a<-table.row.end(a)
a<-table.row.start(a)
a<-table.element(a,'alpha',header=TRUE)
a<-table.element(a,lm1$coefficients[[1]])
a<-table.row.end(a)
a<-table.row.start(a)
a<-table.element(a,'beta',header=TRUE)
a<-table.element(a,lm1$coefficients[[2]])
a<-table.row.end(a)
a<-table.row.start(a)
a<-table.element(a,'S.D.',header=TRUE)
a<-table.element(a,summary(lm1)$coefficients[2,2])
a<-table.row.end(a)
a<-table.row.start(a)
a<-table.element(a,'T-STAT',header=TRUE)
a<-table.element(a,summary(lm1)$coefficients[2,3])
a<-table.row.end(a)
a<-table.row.start(a)
a<-table.element(a,'p-value',header=TRUE)
a<-table.element(a,summary(lm1)$coefficients[2,4])
a<-table.row.end(a)
a<-table.end(a)
table.save(a,file='mytable1.tab')
a<-table.start()
a<-table.row.start(a)
a<-table.element(a,'Regression: ln S.E.(k) = alpha + beta * ln Mean(k)',2,TRUE)
a<-table.row.end(a)
a<-table.row.start(a)
a<-table.element(a,'alpha',header=TRUE)
a<-table.element(a,lnlm1$coefficients[[1]])
a<-table.row.end(a)
a<-table.row.start(a)
a<-table.element(a,'beta',header=TRUE)
a<-table.element(a,lnlm1$coefficients[[2]])
a<-table.row.end(a)
a<-table.row.start(a)
a<-table.element(a,'S.D.',header=TRUE)
a<-table.element(a,summary(lnlm1)$coefficients[2,2])
a<-table.row.end(a)
a<-table.row.start(a)
a<-table.element(a,'T-STAT',header=TRUE)
a<-table.element(a,summary(lnlm1)$coefficients[2,3])
a<-table.row.end(a)
a<-table.row.start(a)
a<-table.element(a,'p-value',header=TRUE)
a<-table.element(a,summary(lnlm1)$coefficients[2,4])
a<-table.row.end(a)
a<-table.row.start(a)
a<-table.element(a,'Lambda',header=TRUE)
a<-table.element(a,1-lnlm1$coefficients[[2]])
a<-table.row.end(a)
a<-table.end(a)
table.save(a,file='mytable2.tab')