Free Statistics
of Irreproducible Research!
Description of Statistical Computation | |||||||||||||||||||||||||||||||||||||||||
|---|---|---|---|---|---|---|---|---|---|---|---|---|---|---|---|---|---|---|---|---|---|---|---|---|---|---|---|---|---|---|---|---|---|---|---|---|---|---|---|---|---|
| Author's title | |||||||||||||||||||||||||||||||||||||||||
| Author | *Unverified author* | ||||||||||||||||||||||||||||||||||||||||
| R Software Module | rwasp_univariatedataseries.wasp | ||||||||||||||||||||||||||||||||||||||||
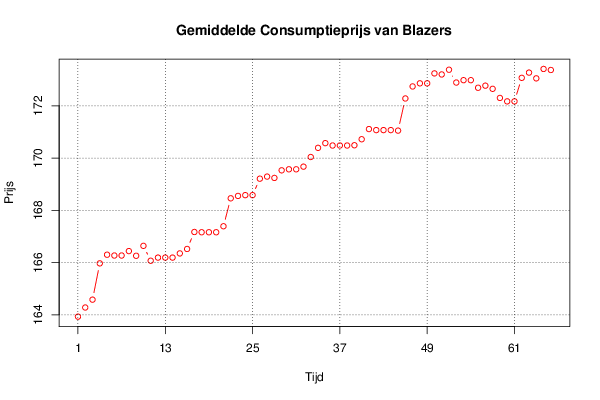
| Title produced by software | Univariate Data Series | ||||||||||||||||||||||||||||||||||||||||
| Date of computation | Fri, 01 Feb 2013 09:19:21 -0500 | ||||||||||||||||||||||||||||||||||||||||
| Cite this page as follows | Statistical Computations at FreeStatistics.org, Office for Research Development and Education, URL https://freestatistics.org/blog/index.php?v=date/2013/Feb/01/t1359728519j0zwm1bpoa2yhbm.htm/, Retrieved Thu, 02 May 2024 14:04:25 +0000 | ||||||||||||||||||||||||||||||||||||||||
| Statistical Computations at FreeStatistics.org, Office for Research Development and Education, URL https://freestatistics.org/blog/index.php?pk=206002, Retrieved Thu, 02 May 2024 14:04:25 +0000 | |||||||||||||||||||||||||||||||||||||||||
| QR Codes: | |||||||||||||||||||||||||||||||||||||||||
|
| |||||||||||||||||||||||||||||||||||||||||
| Original text written by user: | |||||||||||||||||||||||||||||||||||||||||
| IsPrivate? | No (this computation is public) | ||||||||||||||||||||||||||||||||||||||||
| User-defined keywords | Consumptieprijs; Blazers | ||||||||||||||||||||||||||||||||||||||||
| Estimated Impact | 178 | ||||||||||||||||||||||||||||||||||||||||
Tree of Dependent Computations | |||||||||||||||||||||||||||||||||||||||||
| Family? (F = Feedback message, R = changed R code, M = changed R Module, P = changed Parameters, D = changed Data) | |||||||||||||||||||||||||||||||||||||||||
| - [Univariate Data Series] [Gemiddelde Consum...] [2013-02-01 14:19:21] [2a3542871793008b9eb9a15b7c7c93cc] [Current] - R D [Univariate Data Series] [Gemiddelde Consum...] [2013-02-10 17:22:22] [89c9b82b41e693431e396d698e51eda0] - RMP [Histogram] [Gemiddelde Consum...] [2013-02-11 14:18:53] [89c9b82b41e693431e396d698e51eda0] - RMP [Histogram] [Gemiddelde Consum...] [2013-02-11 14:21:24] [89c9b82b41e693431e396d698e51eda0] - RMP [Histogram] [Gemiddelde Consum...] [2013-02-11 14:29:39] [89c9b82b41e693431e396d698e51eda0] - RMP [Kernel Density Estimation] [Gemiddelde Consum...] [2013-02-11 14:32:56] [89c9b82b41e693431e396d698e51eda0] - R PD [Univariate Data Series] [Maximumprijs tick...] [2013-02-10 19:46:37] [89c9b82b41e693431e396d698e51eda0] - RMPD [Histogram] [Maximumprijs tick...] [2013-02-10 20:00:49] [89c9b82b41e693431e396d698e51eda0] - RMPD [Histogram] [Maximumprijs tick...] [2013-02-10 20:12:19] [89c9b82b41e693431e396d698e51eda0] - RMPD [Histogram] [Maximumprijs tick...] [2013-02-10 20:23:32] [89c9b82b41e693431e396d698e51eda0] | |||||||||||||||||||||||||||||||||||||||||
| Feedback Forum | |||||||||||||||||||||||||||||||||||||||||
Post a new message | |||||||||||||||||||||||||||||||||||||||||
Dataset | |||||||||||||||||||||||||||||||||||||||||
| Dataseries X: | |||||||||||||||||||||||||||||||||||||||||
163.93 164.28 164.58 165.97 166.3 166.27 166.27 166.44 166.26 166.64 166.07 166.19 166.19 166.19 166.35 166.52 167.17 167.16 167.16 167.16 167.39 168.46 168.55 168.58 168.58 169.21 169.29 169.24 169.53 169.57 169.57 169.67 170.04 170.39 170.57 170.48 170.48 170.48 170.49 170.72 171.11 171.07 171.07 171.07 171.05 172.28 172.74 172.86 172.86 173.24 173.2 173.38 172.89 172.98 172.98 172.69 172.77 172.65 172.3 172.17 172.17 173.07 173.27 173.05 173.41 173.37 | |||||||||||||||||||||||||||||||||||||||||
Tables (Output of Computation) | |||||||||||||||||||||||||||||||||||||||||
| |||||||||||||||||||||||||||||||||||||||||
Figures (Output of Computation) | |||||||||||||||||||||||||||||||||||||||||
Input Parameters & R Code | |||||||||||||||||||||||||||||||||||||||||
| Parameters (Session): | |||||||||||||||||||||||||||||||||||||||||
| par1 = Gemiddelde Consumptieprijs van Blazers ; par2 = BelgoStat ; par3 = Gemiddelde Consumptieprijs van Blazers ; par4 = 12 ; | |||||||||||||||||||||||||||||||||||||||||
| Parameters (R input): | |||||||||||||||||||||||||||||||||||||||||
| par1 = Gemiddelde Consumptieprijs van Blazers ; par2 = BelgoStat ; par3 = Gemiddelde Consumptieprijs van Blazers ; par4 = 12 ; | |||||||||||||||||||||||||||||||||||||||||
| R code (references can be found in the software module): | |||||||||||||||||||||||||||||||||||||||||
if (par4 != 'No season') { | |||||||||||||||||||||||||||||||||||||||||