Free Statistics

of Irreproducible Research!

Author's title

Author*Unverified author*
R Software Modulerwasp_CARE Data Boxplot.wasp
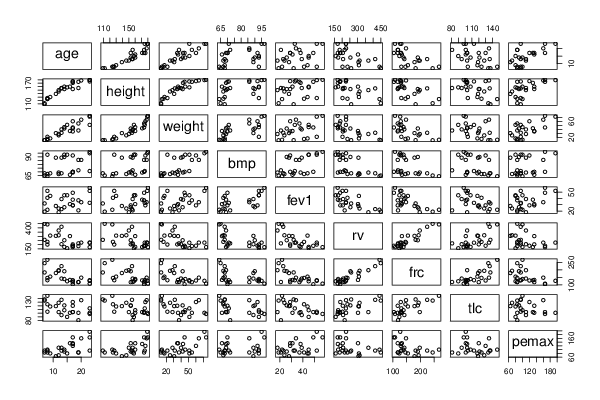
Title produced by softwareCARE Data - Boxplots and Scatterplot Matrix
Date of computationFri, 01 Feb 2013 12:25:41 -0500
Cite this page as followsStatistical Computations at FreeStatistics.org, Office for Research Development and Education, URL https://freestatistics.org/blog/index.php?v=date/2013/Feb/01/t1359739669adm6te3aizbirz4.htm/, Retrieved Thu, 02 May 2024 16:07:58 +0000
Statistical Computations at FreeStatistics.org, Office for Research Development and Education, URL https://freestatistics.org/blog/index.php?pk=206004, Retrieved Thu, 02 May 2024 16:07:58 +0000
QR Codes:

Original text written by user:
IsPrivate?No (this computation is public)
User-defined keywords
Estimated Impact178
Family? (F = Feedback message, R = changed R code, M = changed R Module, P = changed Parameters, D = changed Data)
-     [CARE Data - Boxplots and Scatterplot Matrix] [Kirpatrick and Fe...] [2013-01-29 22:26:12] [98fd0e87c3eb04e0cc2efde01dbafab6]
- R  D    [CARE Data - Boxplots and Scatterplot Matrix] [Factors affecting...] [2013-02-01 17:25:41] [d41d8cd98f00b204e9800998ecf8427e] [Current]
Feedback Forum

Post a new message
Dataseries X:
7	109	13.1	68	32	258	183	137	95
7	112	12.9	65	19	449	245	134	85
8	124	14.1	64	22	441	268	147	100
8	125	16.2	67	41	234	146	124	85
8	127	21.5	93	52	202	131	104	95
9	130	17.5	68	44	308	155	118	80
11	139	30.7	89	28	305	179	119	65
12	150	28.4	69	18	369	198	103	110
12	146	25.1	67	24	312	194	128	70
13	155	31.5	68	23	413	225	136	95
13	156	39.9	89	39	206	142	95	110
14	153	42.1	90	26	253	191	121	90
14	160	45.6	93	45	174	139	108	100
15	158	51.2	93	45	158	124	90	80
16	160	35.9	66	31	302	133	101	134
17	153	34.8	70	29	204	118	120	134
17	174	44.7	70	49	187	104	103	165
17	176	60.1	92	29	188	129	130	120
17	171	42.6	69	38	172	130	103	130
19	156	37.2	72	21	216	119	81	85
19	174	54.6	86	37	184	118	101	85
20	178	64	86	34	225	148	135	160
23	180	73.8	97	57	171	108	98	165
23	175	51.1	71	33	224	131	113	95
23	179	71.5	95	52	225	127	101	195


Summary of computational transaction
Raw Inputview raw input (R code)
Raw Outputview raw output of R engine
Computing time3 seconds
R Server'Sir Ronald Aylmer Fisher' @ fisher.wessa.net

\begin{tabular}{lllllllll}
\hline
Summary of computational transaction \tabularnewline
Raw Input & view raw input (R code)  \tabularnewline
Raw Output & view raw output of R engine  \tabularnewline
Computing time & 3 seconds \tabularnewline
R Server & 'Sir Ronald Aylmer Fisher' @ fisher.wessa.net \tabularnewline
\hline
\end{tabular}
%Source: https://freestatistics.org/blog/index.php?pk=206004&T=0

[TABLE]
[ROW][C]Summary of computational transaction[/C][/ROW]
[ROW][C]Raw Input[/C][C]view raw input (R code) [/C][/ROW]
[ROW][C]Raw Output[/C][C]view raw output of R engine [/C][/ROW]
[ROW][C]Computing time[/C][C]3 seconds[/C][/ROW]
[ROW][C]R Server[/C][C]'Sir Ronald Aylmer Fisher' @ fisher.wessa.net[/C][/ROW]
[/TABLE]
Source: https://freestatistics.org/blog/index.php?pk=206004&T=0

Globally Unique Identifier (entire table): ba.freestatistics.org/blog/index.php?pk=206004&T=0

As an alternative you can also use a QR Code:  

The GUIDs for individual cells are displayed in the table below:

Summary of computational transaction
Raw Inputview raw input (R code)
Raw Outputview raw output of R engine
Computing time3 seconds
R Server'Sir Ronald Aylmer Fisher' @ fisher.wessa.net


Boxplot statistics
Variablelower whiskerlower hingemedianupper hingeupper whisker
age711141723
height109139156174180
weight12.925.137.251.173.8
bmp6468719097
fev11826334457
rv158188225305449
frc104127139183245
tlc81101113128147
pemax658595130195

\begin{tabular}{lllllllll}
\hline
Boxplot statistics \tabularnewline
Variable & lower whisker & lower hinge & median & upper hinge & upper whisker \tabularnewline
age & 7 & 11 & 14 & 17 & 23 \tabularnewline
height & 109 & 139 & 156 & 174 & 180 \tabularnewline
weight & 12.9 & 25.1 & 37.2 & 51.1 & 73.8 \tabularnewline
bmp & 64 & 68 & 71 & 90 & 97 \tabularnewline
fev1 & 18 & 26 & 33 & 44 & 57 \tabularnewline
rv & 158 & 188 & 225 & 305 & 449 \tabularnewline
frc & 104 & 127 & 139 & 183 & 245 \tabularnewline
tlc & 81 & 101 & 113 & 128 & 147 \tabularnewline
pemax & 65 & 85 & 95 & 130 & 195 \tabularnewline
\hline
\end{tabular}
%Source: https://freestatistics.org/blog/index.php?pk=206004&T=1

[TABLE]
[ROW][C]Boxplot statistics[/C][/ROW]
[ROW][C]Variable[/C][C]lower whisker[/C][C]lower hinge[/C][C]median[/C][C]upper hinge[/C][C]upper whisker[/C][/ROW]
[ROW][C]age[/C][C]7[/C][C]11[/C][C]14[/C][C]17[/C][C]23[/C][/ROW]
[ROW][C]height[/C][C]109[/C][C]139[/C][C]156[/C][C]174[/C][C]180[/C][/ROW]
[ROW][C]weight[/C][C]12.9[/C][C]25.1[/C][C]37.2[/C][C]51.1[/C][C]73.8[/C][/ROW]
[ROW][C]bmp[/C][C]64[/C][C]68[/C][C]71[/C][C]90[/C][C]97[/C][/ROW]
[ROW][C]fev1[/C][C]18[/C][C]26[/C][C]33[/C][C]44[/C][C]57[/C][/ROW]
[ROW][C]rv[/C][C]158[/C][C]188[/C][C]225[/C][C]305[/C][C]449[/C][/ROW]
[ROW][C]frc[/C][C]104[/C][C]127[/C][C]139[/C][C]183[/C][C]245[/C][/ROW]
[ROW][C]tlc[/C][C]81[/C][C]101[/C][C]113[/C][C]128[/C][C]147[/C][/ROW]
[ROW][C]pemax[/C][C]65[/C][C]85[/C][C]95[/C][C]130[/C][C]195[/C][/ROW]
[/TABLE]
Source: https://freestatistics.org/blog/index.php?pk=206004&T=1

Globally Unique Identifier (entire table): ba.freestatistics.org/blog/index.php?pk=206004&T=1

As an alternative you can also use a QR Code:  

The GUIDs for individual cells are displayed in the table below:

Boxplot statistics
Variablelower whiskerlower hingemedianupper hingeupper whisker
age711141723
height109139156174180
weight12.925.137.251.173.8
bmp6468719097
fev11826334457
rv158188225305449
frc104127139183245
tlc81101113128147
pemax658595130195


Boxplot Notches
Variablelower boundmedianupper bound
age12.11415.9
height144.9156167.1
weight28.9837.245.42
bmp64.057177.95
fev127.313338.69
rv188225262
frc121.3139156.7
tlc104.5113121.5
pemax80.7895109.2

\begin{tabular}{lllllllll}
\hline
Boxplot Notches \tabularnewline
Variable & lower bound & median & upper bound \tabularnewline
age & 12.1 & 14 & 15.9 \tabularnewline
height & 144.9 & 156 & 167.1 \tabularnewline
weight & 28.98 & 37.2 & 45.42 \tabularnewline
bmp & 64.05 & 71 & 77.95 \tabularnewline
fev1 & 27.31 & 33 & 38.69 \tabularnewline
rv & 188 & 225 & 262 \tabularnewline
frc & 121.3 & 139 & 156.7 \tabularnewline
tlc & 104.5 & 113 & 121.5 \tabularnewline
pemax & 80.78 & 95 & 109.2 \tabularnewline
\hline
\end{tabular}
%Source: https://freestatistics.org/blog/index.php?pk=206004&T=2

[TABLE]
[ROW][C]Boxplot Notches[/C][/ROW]
[ROW][C]Variable[/C][C]lower bound[/C][C]median[/C][C]upper bound[/C][/ROW]
[ROW][C]age[/C][C]12.1[/C][C]14[/C][C]15.9[/C][/ROW]
[ROW][C]height[/C][C]144.9[/C][C]156[/C][C]167.1[/C][/ROW]
[ROW][C]weight[/C][C]28.98[/C][C]37.2[/C][C]45.42[/C][/ROW]
[ROW][C]bmp[/C][C]64.05[/C][C]71[/C][C]77.95[/C][/ROW]
[ROW][C]fev1[/C][C]27.31[/C][C]33[/C][C]38.69[/C][/ROW]
[ROW][C]rv[/C][C]188[/C][C]225[/C][C]262[/C][/ROW]
[ROW][C]frc[/C][C]121.3[/C][C]139[/C][C]156.7[/C][/ROW]
[ROW][C]tlc[/C][C]104.5[/C][C]113[/C][C]121.5[/C][/ROW]
[ROW][C]pemax[/C][C]80.78[/C][C]95[/C][C]109.2[/C][/ROW]
[/TABLE]
Source: https://freestatistics.org/blog/index.php?pk=206004&T=2

Globally Unique Identifier (entire table): ba.freestatistics.org/blog/index.php?pk=206004&T=2

As an alternative you can also use a QR Code:  

The GUIDs for individual cells are displayed in the table below:

Boxplot Notches
Variablelower boundmedianupper bound
age12.11415.9
height144.9156167.1
weight28.9837.245.42
bmp64.057177.95
fev127.313338.69
rv188225262
frc121.3139156.7
tlc104.5113121.5
pemax80.7895109.2


Boxplot Means
Variabletrimmed meanunbiased SD
age14.485.059
height152.821.5
weight38.417.9
bmp78.2812.01
fev134.7211.2
rv255.286.02
frc155.443.72
tlc11416.97
pemax109.133.44

\begin{tabular}{lllllllll}
\hline
Boxplot Means \tabularnewline
Variable & trimmed mean & unbiased SD \tabularnewline
age & 14.48 & 5.059 \tabularnewline
height & 152.8 & 21.5 \tabularnewline
weight & 38.4 & 17.9 \tabularnewline
bmp & 78.28 & 12.01 \tabularnewline
fev1 & 34.72 & 11.2 \tabularnewline
rv & 255.2 & 86.02 \tabularnewline
frc & 155.4 & 43.72 \tabularnewline
tlc & 114 & 16.97 \tabularnewline
pemax & 109.1 & 33.44 \tabularnewline
\hline
\end{tabular}
%Source: https://freestatistics.org/blog/index.php?pk=206004&T=3

[TABLE]
[ROW][C]Boxplot Means[/C][/ROW]
[ROW][C]Variable[/C][C]trimmed mean[/C][C]unbiased SD[/C][/ROW]
[ROW][C]age[/C][C]14.48[/C][C]5.059[/C][/ROW]
[ROW][C]height[/C][C]152.8[/C][C]21.5[/C][/ROW]
[ROW][C]weight[/C][C]38.4[/C][C]17.9[/C][/ROW]
[ROW][C]bmp[/C][C]78.28[/C][C]12.01[/C][/ROW]
[ROW][C]fev1[/C][C]34.72[/C][C]11.2[/C][/ROW]
[ROW][C]rv[/C][C]255.2[/C][C]86.02[/C][/ROW]
[ROW][C]frc[/C][C]155.4[/C][C]43.72[/C][/ROW]
[ROW][C]tlc[/C][C]114[/C][C]16.97[/C][/ROW]
[ROW][C]pemax[/C][C]109.1[/C][C]33.44[/C][/ROW]
[/TABLE]
Source: https://freestatistics.org/blog/index.php?pk=206004&T=3

Globally Unique Identifier (entire table): ba.freestatistics.org/blog/index.php?pk=206004&T=3

As an alternative you can also use a QR Code:  

The GUIDs for individual cells are displayed in the table below:

Boxplot Means
Variabletrimmed meanunbiased SD
age14.485.059
height152.821.5
weight38.417.9
bmp78.2812.01
fev134.7211.2
rv255.286.02
frc155.443.72
tlc11416.97
pemax109.133.44


Parameters (Session):
par1 = 3 ; par2 = TRUE ; par3 = 0 ;
Parameters (R input):
par1 = 3 ; par2 = TRUE ; par3 = 0 ;
R code (references can be found in the software module):
par3 <- '0'
par2 <- 'TRUE'
par1 <- '3'
par1 <- as.numeric(par1) #colour
par2<- as.logical(par2) # Notches ?
par3<-as.numeric(par3) # % trim
if(par3>45){par3<-45;warning('trim limited to 45%')}
if(par3<0){par3<-0;warning('negative trim makes no sense. Trim is zero.')}
lotrm<-as.integer(length(y[1,])*par3/100)+1
hitrm<-as.integer(length(y[1,])*(100-par3)/100)
y1<-array(dim=c(dim(y)[1], hitrm-lotrm+1), dimnames=list(dimnames(y)[[1]], 1:(hitrm-lotrm+1) ))
for(i in 1:dim(y)[1]){
tmp<-order(y[i,])
y1[i,]<- y[i, tmp[lotrm:hitrm] ]
}
bitmap(file='test2.png')
pairs(t(y))
dev.off()
y<-y1
z <- as.data.frame(t(y))
bitmap(file='test1.png')
(r<-boxplot(z ,xlab=xlab,ylab=ylab,main=main,notch=par2,col=par1))
dev.off()
load(file='createtable')
a<-table.start()
a<-table.row.start(a)
a<-table.element(a,hyperlink('overview.htm','Boxplot statistics','Boxplot overview'),6,TRUE)
a<-table.row.end(a)
a<-table.row.start(a)
a<-table.element(a,'Variable',1,TRUE)
a<-table.element(a,hyperlink('lower_whisker.htm','lower whisker','definition of lower whisker'),1,TRUE)
a<-table.element(a,hyperlink('lower_hinge.htm','lower hinge','definition of lower hinge'),1,TRUE)
a<-table.element(a,hyperlink('central_tendency.htm','median','definitions about measures of central tendency'),1,TRUE)
a<-table.element(a,hyperlink('upper_hinge.htm','upper hinge','definition of upper hinge'),1,TRUE)
a<-table.element(a,hyperlink('upper_whisker.htm','upper whisker','definition of upper whisker'),1,TRUE)
a<-table.row.end(a)
for (i in 1:length(y[,1]))
{
a<-table.row.start(a)
a<-table.element(a,dimnames(t(x))[[2]][i],1,TRUE)
for (j in 1:5)
{
a<-table.element(a,signif(r$stats[j,i], digits=4))
}
a<-table.row.end(a)
}
a<-table.end(a)
table.save(a,file='mytable.tab')
if (par2){
a<-table.start()
a<-table.row.start(a)
a<-table.element(a,'Boxplot Notches',4,TRUE)
a<-table.row.end(a)
a<-table.row.start(a)
a<-table.element(a,'Variable',1,TRUE)
a<-table.element(a,'lower bound',1,TRUE)
a<-table.element(a,'median',1,TRUE)
a<-table.element(a,'upper bound',1,TRUE)
a<-table.row.end(a)
for (i in 1:length(y[,1]))
{
a<-table.row.start(a)
a<-table.element(a,dimnames(t(x))[[2]][i],1,TRUE)
a<-table.element(a,signif(r$conf[1,i], digits=4))
a<-table.element(a, signif(r$stats[3,i], digits=4))
a<-table.element(a,signif(r$conf[2,i], digits=4))
a<-table.row.end(a)
}
a<-table.end(a)
table.save(a,file='mytable1.tab')
}
a<-table.start()
a<-table.row.start(a)
a<-table.element(a,'Boxplot Means',4,TRUE)
a<-table.row.end(a)
a<-table.row.start(a)
a<-table.element(a,'Variable',1,TRUE)
a<-table.element(a,hyperlink('trimmed_mean.htm','trimmed mean','definition of trimmed mean'),1,TRUE)
a<-table.element(a,hyperlink('unbiased1.htm','unbiased SD','definition of unbiased SD'),1,TRUE)
a<-table.row.end(a)
for (i in 1:length(y[,1]))
{
a<-table.row.start(a)
a<-table.element(a,dimnames(t(x))[[2]][i],1,TRUE)
a<-table.element(a,signif(mean(z[i], trim=par3/100, na.rm=TRUE), digits=4))
a<-table.element(a,signif(sd(z[i], na.rm=TRUE), digits=4))
a<-table.row.end(a)
}
a<-table.end(a)
table.save(a,file='mytable2.tab')