Free Statistics
of Irreproducible Research!
Description of Statistical Computation | |||||||||||||||||||||||||||||||||||||||||
|---|---|---|---|---|---|---|---|---|---|---|---|---|---|---|---|---|---|---|---|---|---|---|---|---|---|---|---|---|---|---|---|---|---|---|---|---|---|---|---|---|---|
| Author's title | |||||||||||||||||||||||||||||||||||||||||
| Author | *Unverified author* | ||||||||||||||||||||||||||||||||||||||||
| R Software Module | rwasp_univariatedataseries.wasp | ||||||||||||||||||||||||||||||||||||||||
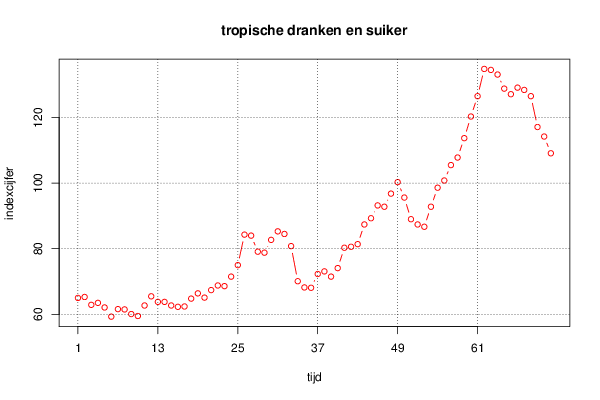
| Title produced by software | Univariate Data Series | ||||||||||||||||||||||||||||||||||||||||
| Date of computation | Mon, 04 Feb 2013 05:51:53 -0500 | ||||||||||||||||||||||||||||||||||||||||
| Cite this page as follows | Statistical Computations at FreeStatistics.org, Office for Research Development and Education, URL https://freestatistics.org/blog/index.php?v=date/2013/Feb/04/t1359975521wmbe1k2s1ey90s7.htm/, Retrieved Mon, 29 Apr 2024 04:08:57 +0000 | ||||||||||||||||||||||||||||||||||||||||
| Statistical Computations at FreeStatistics.org, Office for Research Development and Education, URL https://freestatistics.org/blog/index.php?pk=206025, Retrieved Mon, 29 Apr 2024 04:08:57 +0000 | |||||||||||||||||||||||||||||||||||||||||
| QR Codes: | |||||||||||||||||||||||||||||||||||||||||
|
| |||||||||||||||||||||||||||||||||||||||||
| Original text written by user: | |||||||||||||||||||||||||||||||||||||||||
| IsPrivate? | No (this computation is public) | ||||||||||||||||||||||||||||||||||||||||
| User-defined keywords | |||||||||||||||||||||||||||||||||||||||||
| Estimated Impact | 191 | ||||||||||||||||||||||||||||||||||||||||
Tree of Dependent Computations | |||||||||||||||||||||||||||||||||||||||||
| Family? (F = Feedback message, R = changed R code, M = changed R Module, P = changed Parameters, D = changed Data) | |||||||||||||||||||||||||||||||||||||||||
| - [Univariate Data Series] [cijferreeks - tro...] [2013-02-04 10:51:53] [ee59fc3ebc5330cd5b5b7eda83654419] [Current] - RMPD [Histogram] [Histogram van de ...] [2013-02-12 19:18:41] [e111c0a261eed8e8e22309e7d97dccfe] - RMPD [Kernel Density Estimation] [dichtheidsgrafiek...] [2013-02-12 19:50:07] [e111c0a261eed8e8e22309e7d97dccfe] | |||||||||||||||||||||||||||||||||||||||||
| Feedback Forum | |||||||||||||||||||||||||||||||||||||||||
Post a new message | |||||||||||||||||||||||||||||||||||||||||
Dataset | |||||||||||||||||||||||||||||||||||||||||
| Dataseries X: | |||||||||||||||||||||||||||||||||||||||||
65 65,3 62,9 63,5 62,1 59,3 61,6 61,5 60,1 59,5 62,7 65,5 63,8 63,8 62,7 62,3 62,4 64,8 66,4 65,1 67,4 68,8 68,6 71,5 75 84,3 84 79,1 78,8 82,7 85,3 84,5 80,8 70,1 68,2 68,1 72,3 73,1 71,5 74,1 80,3 80,6 81,4 87,4 89,3 93,2 92,8 96,8 100,3 95,6 89 87,4 86,7 92,8 98,6 100,8 105,5 107,8 113,7 120,3 126,5 134,8 134,5 133,1 128,8 127,1 129,1 128,4 126,5 117,1 114,2 109,1 | |||||||||||||||||||||||||||||||||||||||||
Tables (Output of Computation) | |||||||||||||||||||||||||||||||||||||||||
| |||||||||||||||||||||||||||||||||||||||||
Figures (Output of Computation) | |||||||||||||||||||||||||||||||||||||||||
Input Parameters & R Code | |||||||||||||||||||||||||||||||||||||||||
| Parameters (Session): | |||||||||||||||||||||||||||||||||||||||||
| par1 = cijferreeks tropische dranken en suiker ; par2 = http://www.nbb.be/belgostat/PresentationLinker?Presentation=CSV&prop=null&Dom=3106&Table=8003&TableId=258000003&Lang=N ; par3 = cijferreeks tropische dranken en suiker ; par4 = 12 ; | |||||||||||||||||||||||||||||||||||||||||
| Parameters (R input): | |||||||||||||||||||||||||||||||||||||||||
| par1 = cijferreeks tropische dranken en suiker ; par2 = http://www.nbb.be/belgostat/PresentationLinker?Presentation=CSV&prop=null&Dom=3106&Table=8003&TableId=258000003&Lang=N ; par3 = cijferreeks tropische dranken en suiker ; par4 = 12 ; | |||||||||||||||||||||||||||||||||||||||||
| R code (references can be found in the software module): | |||||||||||||||||||||||||||||||||||||||||
if (par4 != 'No season') { | |||||||||||||||||||||||||||||||||||||||||