Free Statistics
of Irreproducible Research!
Description of Statistical Computation | |||||||||||||||||||||||||||||||||||||||||
|---|---|---|---|---|---|---|---|---|---|---|---|---|---|---|---|---|---|---|---|---|---|---|---|---|---|---|---|---|---|---|---|---|---|---|---|---|---|---|---|---|---|
| Author's title | |||||||||||||||||||||||||||||||||||||||||
| Author | *Unverified author* | ||||||||||||||||||||||||||||||||||||||||
| R Software Module | rwasp_univariatedataseries.wasp | ||||||||||||||||||||||||||||||||||||||||
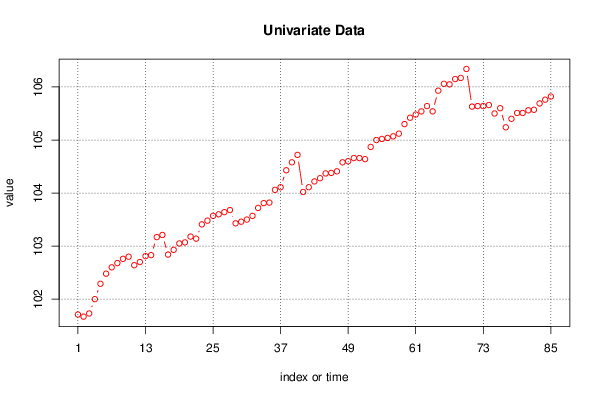
| Title produced by software | Univariate Data Series | ||||||||||||||||||||||||||||||||||||||||
| Date of computation | Mon, 04 Feb 2013 15:59:45 -0500 | ||||||||||||||||||||||||||||||||||||||||
| Cite this page as follows | Statistical Computations at FreeStatistics.org, Office for Research Development and Education, URL https://freestatistics.org/blog/index.php?v=date/2013/Feb/04/t13600125032c4evol1zsoa3tn.htm/, Retrieved Mon, 29 Apr 2024 04:45:53 +0000 | ||||||||||||||||||||||||||||||||||||||||
| Statistical Computations at FreeStatistics.org, Office for Research Development and Education, URL https://freestatistics.org/blog/index.php?pk=206037, Retrieved Mon, 29 Apr 2024 04:45:53 +0000 | |||||||||||||||||||||||||||||||||||||||||
| QR Codes: | |||||||||||||||||||||||||||||||||||||||||
|
| |||||||||||||||||||||||||||||||||||||||||
| Original text written by user: | Ik heb deze cijfers gekozen omdat het voor autofabrikanten marketing-gewijs heel interessant is hoe de verkoop stijgt en daalt in welke maanden, ook voor de toekomst is het belangrijk dat men deze cijfers blijft bijwerken en gebruiken om te innoveren en aanpassen. | ||||||||||||||||||||||||||||||||||||||||
| IsPrivate? | No (this computation is public) | ||||||||||||||||||||||||||||||||||||||||
| User-defined keywords | aankoop voertuigen,2006,2013 | ||||||||||||||||||||||||||||||||||||||||
| Estimated Impact | 177 | ||||||||||||||||||||||||||||||||||||||||
Tree of Dependent Computations | |||||||||||||||||||||||||||||||||||||||||
| Family? (F = Feedback message, R = changed R code, M = changed R Module, P = changed Parameters, D = changed Data) | |||||||||||||||||||||||||||||||||||||||||
| - [Univariate Data Series] [hier zien we de a...] [2013-02-04 20:59:45] [b2d056cfd8f58045d93980b40d00d0d0] [Current] | |||||||||||||||||||||||||||||||||||||||||
| Feedback Forum | |||||||||||||||||||||||||||||||||||||||||
Post a new message | |||||||||||||||||||||||||||||||||||||||||
Dataset | |||||||||||||||||||||||||||||||||||||||||
| Dataseries X: | |||||||||||||||||||||||||||||||||||||||||
101,71 101,67 101,73 102,00 102,29 102,48 102,60 102,68 102,76 102,80 102,64 102,70 102,81 102,83 103,17 103,21 102,84 102,93 103,05 103,07 103,18 103,14 103,41 103,48 103,57 103,60 103,64 103,68 103,43 103,46 103,50 103,57 103,72 103,81 103,82 104,06 104,11 104,43 104,58 104,72 104,02 104,11 104,22 104,28 104,37 104,38 104,41 104,58 104,60 104,66 104,66 104,64 104,87 105,00 105,02 105,04 105,07 105,12 105,30 105,42 105,48 105,54 105,64 105,54 105,93 106,06 106,05 106,15 106,17 106,34 105,63 105,64 105,64 105,66 105,50 105,60 105,24 105,40 105,51 105,51 105,56 105,57 105,69 105,76 105,82 | |||||||||||||||||||||||||||||||||||||||||
Tables (Output of Computation) | |||||||||||||||||||||||||||||||||||||||||
| |||||||||||||||||||||||||||||||||||||||||
Figures (Output of Computation) | |||||||||||||||||||||||||||||||||||||||||
Input Parameters & R Code | |||||||||||||||||||||||||||||||||||||||||
| Parameters (Session): | |||||||||||||||||||||||||||||||||||||||||
| par1 = aankoop van voertuigen ; par2 = Link: http://statbel.fgov.be/nl/statistieken/cijfers/economie/consumptieprijzen/ ; par3 = Hier zien we de aankoop van voertuigen in periode van 01/2006 tot 01/2013 ; par4 = 12 ; | |||||||||||||||||||||||||||||||||||||||||
| Parameters (R input): | |||||||||||||||||||||||||||||||||||||||||
| par1 = aankoop van voertuigen ; par2 = Link: http://statbel.fgov.be/nl/statistieken/cijfers/economie/consumptieprijzen/ ; par3 = Hier zien we de aankoop van voertuigen in periode van 01/2006 tot 01/2013 ; par4 = 12 ; | |||||||||||||||||||||||||||||||||||||||||
| R code (references can be found in the software module): | |||||||||||||||||||||||||||||||||||||||||
if (par4 != 'No season') { | |||||||||||||||||||||||||||||||||||||||||