Free Statistics
of Irreproducible Research!
Description of Statistical Computation | |||||||||||||||||||||||||||||||||||||
|---|---|---|---|---|---|---|---|---|---|---|---|---|---|---|---|---|---|---|---|---|---|---|---|---|---|---|---|---|---|---|---|---|---|---|---|---|---|
| Author's title | |||||||||||||||||||||||||||||||||||||
| Author | *Unverified author* | ||||||||||||||||||||||||||||||||||||
| R Software Module | rwasp_spearman.wasp | ||||||||||||||||||||||||||||||||||||
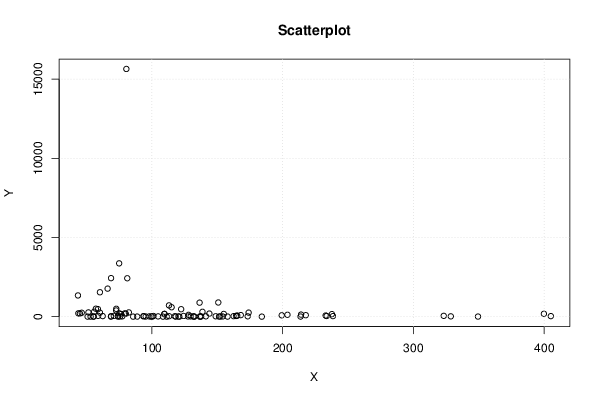
| Title produced by software | Spearman Rank Correlation | ||||||||||||||||||||||||||||||||||||
| Date of computation | Wed, 13 Feb 2013 17:12:33 -0500 | ||||||||||||||||||||||||||||||||||||
| Cite this page as follows | Statistical Computations at FreeStatistics.org, Office for Research Development and Education, URL https://freestatistics.org/blog/index.php?v=date/2013/Feb/13/t13607935856tpozlfeton1llu.htm/, Retrieved Thu, 02 May 2024 13:49:47 +0000 | ||||||||||||||||||||||||||||||||||||
| Statistical Computations at FreeStatistics.org, Office for Research Development and Education, URL https://freestatistics.org/blog/index.php?pk=206478, Retrieved Thu, 02 May 2024 13:49:47 +0000 | |||||||||||||||||||||||||||||||||||||
| QR Codes: | |||||||||||||||||||||||||||||||||||||
|
| |||||||||||||||||||||||||||||||||||||
| Original text written by user: | |||||||||||||||||||||||||||||||||||||
| IsPrivate? | No (this computation is public) | ||||||||||||||||||||||||||||||||||||
| User-defined keywords | |||||||||||||||||||||||||||||||||||||
| Estimated Impact | 195 | ||||||||||||||||||||||||||||||||||||
Tree of Dependent Computations | |||||||||||||||||||||||||||||||||||||
| Family? (F = Feedback message, R = changed R code, M = changed R Module, P = changed Parameters, D = changed Data) | |||||||||||||||||||||||||||||||||||||
| - [Spearman Rank Correlation] [] [2013-02-13 22:12:33] [d41d8cd98f00b204e9800998ecf8427e] [Current] | |||||||||||||||||||||||||||||||||||||
| Feedback Forum | |||||||||||||||||||||||||||||||||||||
Post a new message | |||||||||||||||||||||||||||||||||||||
Dataset | |||||||||||||||||||||||||||||||||||||
| Dataseries X: | |||||||||||||||||||||||||||||||||||||
162.5 98.1 120.3 58.8 237.7 93.8 405.1 141.3 53.2 122.4 113.2 80.1 323.2 111.4 137.7 168 81.2 136.7 74 109.6 117.6 85.7 128.1 129.7 108.5 238.5 148.8 60.3 164.4 55.5 100.4 70.9 132.5 104.8 88.8 328.6 136.9 157.9 75.7 233.7 101.2 131.8 138.7 154.1 75.2 95.3 68.7 43.5 68.8 217.7 62.4 121 118.3 132.2 213.7 113.1 72.8 127.7 203.7 45 136.5 58.9 43.8 155 46.4 77.4 79.3 51.5 74.2 60.3 55.4 80.5 199.3 214.1 174 50.9 164.7 57.2 55.9 115.1 173.3 165.3 93.5 144 75 232.9 76.5 151.4 68.8 82.4 349.4 399.8 124.3 66.2 150.8 72.7 152.4 99.6 109.6 184.1 | |||||||||||||||||||||||||||||||||||||
| Dataseries Y: | |||||||||||||||||||||||||||||||||||||
31.35 16.55 10.27 476.8 161.7 26.75 33.47 20.68 1.26 470.4 28 184.6 51.62 0.76 14.64 97.2 2425 3.65 44.88 174.6 27.98 1.17 114.8 20.65 0.94 36.37 24.27 1542 41.77 7.9 6.56 49.72 0.72 16.8 5.1 19.85 5.74 4.49 9.92 41.22 41.84 14.25 307.2 12.39 206.5 7.83 1.86 1340 2434 91.2 34.82 2.35 2.62 9.72 7.26 712 497 12.15 118.7 200.3 884 50.3 210.6 171.4 246.8 22.45 204.7 268.3 0.22 255 4.53 15650 85.11 130.6 255 1.42 54.05 499.89 309.2 595 21.42 64.7 26.75 193.56 3367 71.04 166.9 2.79 26.51 267.92 6.19 180.2 44.7 1770 894.9 391.5 18.18 3.11 174.6 0.05 | |||||||||||||||||||||||||||||||||||||
Tables (Output of Computation) | |||||||||||||||||||||||||||||||||||||
| |||||||||||||||||||||||||||||||||||||
Figures (Output of Computation) | |||||||||||||||||||||||||||||||||||||
Input Parameters & R Code | |||||||||||||||||||||||||||||||||||||
| Parameters (Session): | |||||||||||||||||||||||||||||||||||||
| Parameters (R input): | |||||||||||||||||||||||||||||||||||||
| R code (references can be found in the software module): | |||||||||||||||||||||||||||||||||||||
k <- cor.test(x,y,method='spearman') | |||||||||||||||||||||||||||||||||||||