Free Statistics

of Irreproducible Research!

Author's title

Author*Unverified author*
R Software Modulerwasp_autocorrelation.wasp
Title produced by software(Partial) Autocorrelation Function
Date of computationMon, 14 Jan 2013 14:30:47 -0500
Cite this page as followsStatistical Computations at FreeStatistics.org, Office for Research Development and Education, URL https://freestatistics.org/blog/index.php?v=date/2013/Jan/14/t13581918939r9sno8a8l9gs6q.htm/, Retrieved Sat, 27 Apr 2024 18:26:48 +0000
Statistical Computations at FreeStatistics.org, Office for Research Development and Education, URL https://freestatistics.org/blog/index.php?pk=205359, Retrieved Sat, 27 Apr 2024 18:26:48 +0000
QR Codes:

Original text written by user:
IsPrivate?No (this computation is public)
User-defined keywords
Estimated Impact82
Family? (F = Feedback message, R = changed R code, M = changed R Module, P = changed Parameters, D = changed Data)
-       [(Partial) Autocorrelation Function] [Opg6bisInschrijvi...] [2013-01-14 19:30:47] [a6e34128b9d18a68d11d76dfebda1862] [Current]
Feedback Forum

Post a new message
Dataseries X:
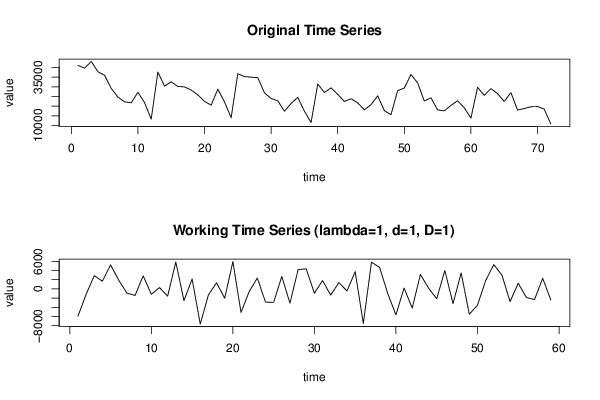
41086
39690
43129
37863
35953
29133
24693
22205
21725
27192
21790
13253
37702
30364
32609
30212
29965
28352
25814
22414
20506
28806
22228
13971
36845
35338
35022
34777
26887
23970
22780
17351
21382
24561
17409
11514
31514
27071
29462
26105
22397
23843
21705
18089
20764
25316
17704
15548
28029
29383
36438
32034
22679
24319
18004
17537
20366
22782
19169
13807
29743
25591
29096
26482
22405
27044
17970
18730
19684
19785
18479
10698


Summary of computational transaction
Raw Inputview raw input (R code)
Raw Outputview raw output of R engine
Computing time2 seconds
R Server'Gertrude Mary Cox' @ cox.wessa.net

\begin{tabular}{lllllllll}
\hline
Summary of computational transaction \tabularnewline
Raw Input & view raw input (R code)  \tabularnewline
Raw Output & view raw output of R engine  \tabularnewline
Computing time & 2 seconds \tabularnewline
R Server & 'Gertrude Mary Cox' @ cox.wessa.net \tabularnewline
\hline
\end{tabular}
%Source: https://freestatistics.org/blog/index.php?pk=205359&T=0

[TABLE]
[ROW][C]Summary of computational transaction[/C][/ROW]
[ROW][C]Raw Input[/C][C]view raw input (R code) [/C][/ROW]
[ROW][C]Raw Output[/C][C]view raw output of R engine [/C][/ROW]
[ROW][C]Computing time[/C][C]2 seconds[/C][/ROW]
[ROW][C]R Server[/C][C]'Gertrude Mary Cox' @ cox.wessa.net[/C][/ROW]
[/TABLE]
Source: https://freestatistics.org/blog/index.php?pk=205359&T=0

Globally Unique Identifier (entire table): ba.freestatistics.org/blog/index.php?pk=205359&T=0

As an alternative you can also use a QR Code:  

The GUIDs for individual cells are displayed in the table below:

Summary of computational transaction
Raw Inputview raw input (R code)
Raw Outputview raw output of R engine
Computing time2 seconds
R Server'Gertrude Mary Cox' @ cox.wessa.net


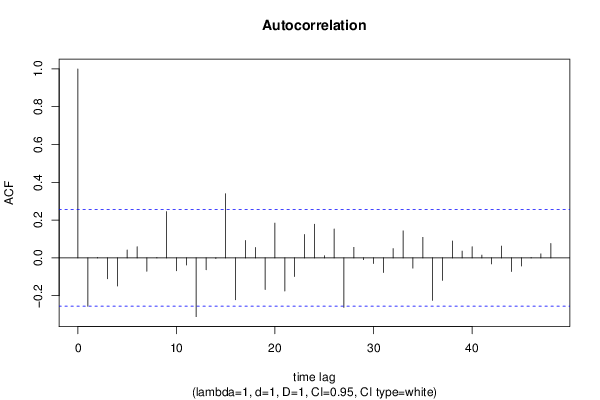
Autocorrelation Function
Time lag kACF(k)T-STATP-value
1-0.256175-1.96770.026903
20.0018370.01410.494395
3-0.110343-0.84760.200055
4-0.148889-1.14360.128697
50.0421280.32360.373695
60.0591180.45410.325714
7-0.070512-0.54160.295063
8-0.000779-0.0060.497624
90.244841.88070.032479
10-0.067721-0.52020.302443
11-0.037293-0.28650.387768
12-0.310973-2.38860.010065
13-0.062582-0.48070.316253
14-0.003676-0.02820.488785
150.3396412.60880.005747
16-0.221421-1.70080.047127
170.0922930.70890.240585
180.0546890.42010.337978
19-0.167437-1.28610.101715
200.1839651.41310.081446
21-0.175093-1.34490.0919
22-0.098815-0.7590.225434
230.1237750.95070.17281
240.1785551.37150.087706
250.011830.09090.463952
260.15261.17210.122926
27-0.262112-2.01330.024325
280.0557830.42850.334932
29-0.009193-0.07060.471973
30-0.02933-0.22530.411267
31-0.077155-0.59260.277844
320.0491780.37770.353488
330.1430181.09850.138216
34-0.054253-0.41670.339195
350.1086320.83440.203706
36-0.224779-1.72660.04474
37-0.119112-0.91490.181979
380.0890250.68380.248384
390.035820.27510.392085
400.0592020.45470.325482
410.0146790.11280.455305
42-0.031599-0.24270.404533
430.0623940.47930.316764
44-0.071892-0.55220.291445
45-0.043184-0.33170.370644
460.001540.01180.4953
470.0211780.16270.435666
480.0764080.58690.279754

\begin{tabular}{lllllllll}
\hline
Autocorrelation Function \tabularnewline
Time lag k & ACF(k) & T-STAT & P-value \tabularnewline
1 & -0.256175 & -1.9677 & 0.026903 \tabularnewline
2 & 0.001837 & 0.0141 & 0.494395 \tabularnewline
3 & -0.110343 & -0.8476 & 0.200055 \tabularnewline
4 & -0.148889 & -1.1436 & 0.128697 \tabularnewline
5 & 0.042128 & 0.3236 & 0.373695 \tabularnewline
6 & 0.059118 & 0.4541 & 0.325714 \tabularnewline
7 & -0.070512 & -0.5416 & 0.295063 \tabularnewline
8 & -0.000779 & -0.006 & 0.497624 \tabularnewline
9 & 0.24484 & 1.8807 & 0.032479 \tabularnewline
10 & -0.067721 & -0.5202 & 0.302443 \tabularnewline
11 & -0.037293 & -0.2865 & 0.387768 \tabularnewline
12 & -0.310973 & -2.3886 & 0.010065 \tabularnewline
13 & -0.062582 & -0.4807 & 0.316253 \tabularnewline
14 & -0.003676 & -0.0282 & 0.488785 \tabularnewline
15 & 0.339641 & 2.6088 & 0.005747 \tabularnewline
16 & -0.221421 & -1.7008 & 0.047127 \tabularnewline
17 & 0.092293 & 0.7089 & 0.240585 \tabularnewline
18 & 0.054689 & 0.4201 & 0.337978 \tabularnewline
19 & -0.167437 & -1.2861 & 0.101715 \tabularnewline
20 & 0.183965 & 1.4131 & 0.081446 \tabularnewline
21 & -0.175093 & -1.3449 & 0.0919 \tabularnewline
22 & -0.098815 & -0.759 & 0.225434 \tabularnewline
23 & 0.123775 & 0.9507 & 0.17281 \tabularnewline
24 & 0.178555 & 1.3715 & 0.087706 \tabularnewline
25 & 0.01183 & 0.0909 & 0.463952 \tabularnewline
26 & 0.1526 & 1.1721 & 0.122926 \tabularnewline
27 & -0.262112 & -2.0133 & 0.024325 \tabularnewline
28 & 0.055783 & 0.4285 & 0.334932 \tabularnewline
29 & -0.009193 & -0.0706 & 0.471973 \tabularnewline
30 & -0.02933 & -0.2253 & 0.411267 \tabularnewline
31 & -0.077155 & -0.5926 & 0.277844 \tabularnewline
32 & 0.049178 & 0.3777 & 0.353488 \tabularnewline
33 & 0.143018 & 1.0985 & 0.138216 \tabularnewline
34 & -0.054253 & -0.4167 & 0.339195 \tabularnewline
35 & 0.108632 & 0.8344 & 0.203706 \tabularnewline
36 & -0.224779 & -1.7266 & 0.04474 \tabularnewline
37 & -0.119112 & -0.9149 & 0.181979 \tabularnewline
38 & 0.089025 & 0.6838 & 0.248384 \tabularnewline
39 & 0.03582 & 0.2751 & 0.392085 \tabularnewline
40 & 0.059202 & 0.4547 & 0.325482 \tabularnewline
41 & 0.014679 & 0.1128 & 0.455305 \tabularnewline
42 & -0.031599 & -0.2427 & 0.404533 \tabularnewline
43 & 0.062394 & 0.4793 & 0.316764 \tabularnewline
44 & -0.071892 & -0.5522 & 0.291445 \tabularnewline
45 & -0.043184 & -0.3317 & 0.370644 \tabularnewline
46 & 0.00154 & 0.0118 & 0.4953 \tabularnewline
47 & 0.021178 & 0.1627 & 0.435666 \tabularnewline
48 & 0.076408 & 0.5869 & 0.279754 \tabularnewline
\hline
\end{tabular}
%Source: https://freestatistics.org/blog/index.php?pk=205359&T=1

[TABLE]
[ROW][C]Autocorrelation Function[/C][/ROW]
[ROW][C]Time lag k[/C][C]ACF(k)[/C][C]T-STAT[/C][C]P-value[/C][/ROW]
[ROW][C]1[/C][C]-0.256175[/C][C]-1.9677[/C][C]0.026903[/C][/ROW]
[ROW][C]2[/C][C]0.001837[/C][C]0.0141[/C][C]0.494395[/C][/ROW]
[ROW][C]3[/C][C]-0.110343[/C][C]-0.8476[/C][C]0.200055[/C][/ROW]
[ROW][C]4[/C][C]-0.148889[/C][C]-1.1436[/C][C]0.128697[/C][/ROW]
[ROW][C]5[/C][C]0.042128[/C][C]0.3236[/C][C]0.373695[/C][/ROW]
[ROW][C]6[/C][C]0.059118[/C][C]0.4541[/C][C]0.325714[/C][/ROW]
[ROW][C]7[/C][C]-0.070512[/C][C]-0.5416[/C][C]0.295063[/C][/ROW]
[ROW][C]8[/C][C]-0.000779[/C][C]-0.006[/C][C]0.497624[/C][/ROW]
[ROW][C]9[/C][C]0.24484[/C][C]1.8807[/C][C]0.032479[/C][/ROW]
[ROW][C]10[/C][C]-0.067721[/C][C]-0.5202[/C][C]0.302443[/C][/ROW]
[ROW][C]11[/C][C]-0.037293[/C][C]-0.2865[/C][C]0.387768[/C][/ROW]
[ROW][C]12[/C][C]-0.310973[/C][C]-2.3886[/C][C]0.010065[/C][/ROW]
[ROW][C]13[/C][C]-0.062582[/C][C]-0.4807[/C][C]0.316253[/C][/ROW]
[ROW][C]14[/C][C]-0.003676[/C][C]-0.0282[/C][C]0.488785[/C][/ROW]
[ROW][C]15[/C][C]0.339641[/C][C]2.6088[/C][C]0.005747[/C][/ROW]
[ROW][C]16[/C][C]-0.221421[/C][C]-1.7008[/C][C]0.047127[/C][/ROW]
[ROW][C]17[/C][C]0.092293[/C][C]0.7089[/C][C]0.240585[/C][/ROW]
[ROW][C]18[/C][C]0.054689[/C][C]0.4201[/C][C]0.337978[/C][/ROW]
[ROW][C]19[/C][C]-0.167437[/C][C]-1.2861[/C][C]0.101715[/C][/ROW]
[ROW][C]20[/C][C]0.183965[/C][C]1.4131[/C][C]0.081446[/C][/ROW]
[ROW][C]21[/C][C]-0.175093[/C][C]-1.3449[/C][C]0.0919[/C][/ROW]
[ROW][C]22[/C][C]-0.098815[/C][C]-0.759[/C][C]0.225434[/C][/ROW]
[ROW][C]23[/C][C]0.123775[/C][C]0.9507[/C][C]0.17281[/C][/ROW]
[ROW][C]24[/C][C]0.178555[/C][C]1.3715[/C][C]0.087706[/C][/ROW]
[ROW][C]25[/C][C]0.01183[/C][C]0.0909[/C][C]0.463952[/C][/ROW]
[ROW][C]26[/C][C]0.1526[/C][C]1.1721[/C][C]0.122926[/C][/ROW]
[ROW][C]27[/C][C]-0.262112[/C][C]-2.0133[/C][C]0.024325[/C][/ROW]
[ROW][C]28[/C][C]0.055783[/C][C]0.4285[/C][C]0.334932[/C][/ROW]
[ROW][C]29[/C][C]-0.009193[/C][C]-0.0706[/C][C]0.471973[/C][/ROW]
[ROW][C]30[/C][C]-0.02933[/C][C]-0.2253[/C][C]0.411267[/C][/ROW]
[ROW][C]31[/C][C]-0.077155[/C][C]-0.5926[/C][C]0.277844[/C][/ROW]
[ROW][C]32[/C][C]0.049178[/C][C]0.3777[/C][C]0.353488[/C][/ROW]
[ROW][C]33[/C][C]0.143018[/C][C]1.0985[/C][C]0.138216[/C][/ROW]
[ROW][C]34[/C][C]-0.054253[/C][C]-0.4167[/C][C]0.339195[/C][/ROW]
[ROW][C]35[/C][C]0.108632[/C][C]0.8344[/C][C]0.203706[/C][/ROW]
[ROW][C]36[/C][C]-0.224779[/C][C]-1.7266[/C][C]0.04474[/C][/ROW]
[ROW][C]37[/C][C]-0.119112[/C][C]-0.9149[/C][C]0.181979[/C][/ROW]
[ROW][C]38[/C][C]0.089025[/C][C]0.6838[/C][C]0.248384[/C][/ROW]
[ROW][C]39[/C][C]0.03582[/C][C]0.2751[/C][C]0.392085[/C][/ROW]
[ROW][C]40[/C][C]0.059202[/C][C]0.4547[/C][C]0.325482[/C][/ROW]
[ROW][C]41[/C][C]0.014679[/C][C]0.1128[/C][C]0.455305[/C][/ROW]
[ROW][C]42[/C][C]-0.031599[/C][C]-0.2427[/C][C]0.404533[/C][/ROW]
[ROW][C]43[/C][C]0.062394[/C][C]0.4793[/C][C]0.316764[/C][/ROW]
[ROW][C]44[/C][C]-0.071892[/C][C]-0.5522[/C][C]0.291445[/C][/ROW]
[ROW][C]45[/C][C]-0.043184[/C][C]-0.3317[/C][C]0.370644[/C][/ROW]
[ROW][C]46[/C][C]0.00154[/C][C]0.0118[/C][C]0.4953[/C][/ROW]
[ROW][C]47[/C][C]0.021178[/C][C]0.1627[/C][C]0.435666[/C][/ROW]
[ROW][C]48[/C][C]0.076408[/C][C]0.5869[/C][C]0.279754[/C][/ROW]
[/TABLE]
Source: https://freestatistics.org/blog/index.php?pk=205359&T=1

Globally Unique Identifier (entire table): ba.freestatistics.org/blog/index.php?pk=205359&T=1

As an alternative you can also use a QR Code:  

The GUIDs for individual cells are displayed in the table below:

Autocorrelation Function
Time lag kACF(k)T-STATP-value
1-0.256175-1.96770.026903
20.0018370.01410.494395
3-0.110343-0.84760.200055
4-0.148889-1.14360.128697
50.0421280.32360.373695
60.0591180.45410.325714
7-0.070512-0.54160.295063
8-0.000779-0.0060.497624
90.244841.88070.032479
10-0.067721-0.52020.302443
11-0.037293-0.28650.387768
12-0.310973-2.38860.010065
13-0.062582-0.48070.316253
14-0.003676-0.02820.488785
150.3396412.60880.005747
16-0.221421-1.70080.047127
170.0922930.70890.240585
180.0546890.42010.337978
19-0.167437-1.28610.101715
200.1839651.41310.081446
21-0.175093-1.34490.0919
22-0.098815-0.7590.225434
230.1237750.95070.17281
240.1785551.37150.087706
250.011830.09090.463952
260.15261.17210.122926
27-0.262112-2.01330.024325
280.0557830.42850.334932
29-0.009193-0.07060.471973
30-0.02933-0.22530.411267
31-0.077155-0.59260.277844
320.0491780.37770.353488
330.1430181.09850.138216
34-0.054253-0.41670.339195
350.1086320.83440.203706
36-0.224779-1.72660.04474
37-0.119112-0.91490.181979
380.0890250.68380.248384
390.035820.27510.392085
400.0592020.45470.325482
410.0146790.11280.455305
42-0.031599-0.24270.404533
430.0623940.47930.316764
44-0.071892-0.55220.291445
45-0.043184-0.33170.370644
460.001540.01180.4953
470.0211780.16270.435666
480.0764080.58690.279754


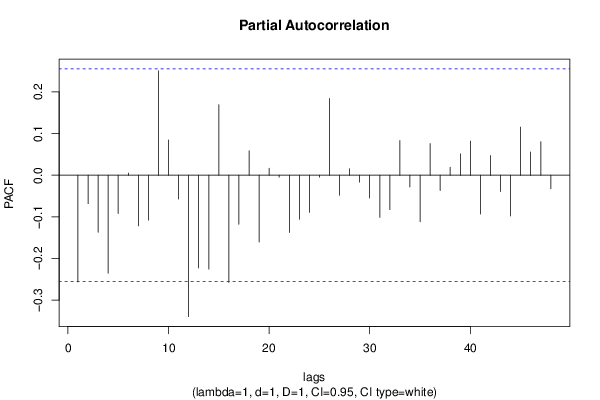
Partial Autocorrelation Function
Time lag kPACF(k)T-STATP-value
1-0.256175-1.96770.026903
2-0.068269-0.52440.300988
3-0.13691-1.05160.14863
4-0.235589-1.80960.037727
5-0.091892-0.70580.241534
60.0049510.0380.484897
7-0.12169-0.93470.176872
8-0.107944-0.82910.205185
90.2506421.92520.029513
100.0847050.65060.258904
11-0.056979-0.43770.331614
12-0.339678-2.60910.005742
13-0.222522-1.70920.046332
14-0.225664-1.73340.044128
150.1692711.30020.099296
16-0.257309-1.97640.026393
17-0.117958-0.90610.184297
180.0587030.45090.326854
19-0.160491-1.23280.111278
200.0166390.12780.449369
21-0.004611-0.03540.485934
22-0.137614-1.0570.147403
23-0.10585-0.81310.209729
24-0.089212-0.68530.247935
25-0.004568-0.03510.486064
260.1840531.41370.081347
27-0.048008-0.36880.356814
280.0155560.11950.452648
29-0.01661-0.12760.449455
30-0.05482-0.42110.337613
31-0.101319-0.77820.219767
32-0.082618-0.63460.264072
330.0830140.63760.263086
34-0.028235-0.21690.414525
35-0.111955-0.85990.19665
360.0758010.58220.281313
37-0.036853-0.28310.389055
380.0192320.14770.441533
390.0512560.39370.347609
400.0818540.62870.265976
41-0.093281-0.71650.238253
420.0475320.36510.358172
43-0.039099-0.30030.382492
44-0.097996-0.75270.227305
450.1155430.88750.189206
460.0555470.42670.335589
470.0805810.6190.269165
48-0.0327-0.25120.401276

\begin{tabular}{lllllllll}
\hline
Partial Autocorrelation Function \tabularnewline
Time lag k & PACF(k) & T-STAT & P-value \tabularnewline
1 & -0.256175 & -1.9677 & 0.026903 \tabularnewline
2 & -0.068269 & -0.5244 & 0.300988 \tabularnewline
3 & -0.13691 & -1.0516 & 0.14863 \tabularnewline
4 & -0.235589 & -1.8096 & 0.037727 \tabularnewline
5 & -0.091892 & -0.7058 & 0.241534 \tabularnewline
6 & 0.004951 & 0.038 & 0.484897 \tabularnewline
7 & -0.12169 & -0.9347 & 0.176872 \tabularnewline
8 & -0.107944 & -0.8291 & 0.205185 \tabularnewline
9 & 0.250642 & 1.9252 & 0.029513 \tabularnewline
10 & 0.084705 & 0.6506 & 0.258904 \tabularnewline
11 & -0.056979 & -0.4377 & 0.331614 \tabularnewline
12 & -0.339678 & -2.6091 & 0.005742 \tabularnewline
13 & -0.222522 & -1.7092 & 0.046332 \tabularnewline
14 & -0.225664 & -1.7334 & 0.044128 \tabularnewline
15 & 0.169271 & 1.3002 & 0.099296 \tabularnewline
16 & -0.257309 & -1.9764 & 0.026393 \tabularnewline
17 & -0.117958 & -0.9061 & 0.184297 \tabularnewline
18 & 0.058703 & 0.4509 & 0.326854 \tabularnewline
19 & -0.160491 & -1.2328 & 0.111278 \tabularnewline
20 & 0.016639 & 0.1278 & 0.449369 \tabularnewline
21 & -0.004611 & -0.0354 & 0.485934 \tabularnewline
22 & -0.137614 & -1.057 & 0.147403 \tabularnewline
23 & -0.10585 & -0.8131 & 0.209729 \tabularnewline
24 & -0.089212 & -0.6853 & 0.247935 \tabularnewline
25 & -0.004568 & -0.0351 & 0.486064 \tabularnewline
26 & 0.184053 & 1.4137 & 0.081347 \tabularnewline
27 & -0.048008 & -0.3688 & 0.356814 \tabularnewline
28 & 0.015556 & 0.1195 & 0.452648 \tabularnewline
29 & -0.01661 & -0.1276 & 0.449455 \tabularnewline
30 & -0.05482 & -0.4211 & 0.337613 \tabularnewline
31 & -0.101319 & -0.7782 & 0.219767 \tabularnewline
32 & -0.082618 & -0.6346 & 0.264072 \tabularnewline
33 & 0.083014 & 0.6376 & 0.263086 \tabularnewline
34 & -0.028235 & -0.2169 & 0.414525 \tabularnewline
35 & -0.111955 & -0.8599 & 0.19665 \tabularnewline
36 & 0.075801 & 0.5822 & 0.281313 \tabularnewline
37 & -0.036853 & -0.2831 & 0.389055 \tabularnewline
38 & 0.019232 & 0.1477 & 0.441533 \tabularnewline
39 & 0.051256 & 0.3937 & 0.347609 \tabularnewline
40 & 0.081854 & 0.6287 & 0.265976 \tabularnewline
41 & -0.093281 & -0.7165 & 0.238253 \tabularnewline
42 & 0.047532 & 0.3651 & 0.358172 \tabularnewline
43 & -0.039099 & -0.3003 & 0.382492 \tabularnewline
44 & -0.097996 & -0.7527 & 0.227305 \tabularnewline
45 & 0.115543 & 0.8875 & 0.189206 \tabularnewline
46 & 0.055547 & 0.4267 & 0.335589 \tabularnewline
47 & 0.080581 & 0.619 & 0.269165 \tabularnewline
48 & -0.0327 & -0.2512 & 0.401276 \tabularnewline
\hline
\end{tabular}
%Source: https://freestatistics.org/blog/index.php?pk=205359&T=2

[TABLE]
[ROW][C]Partial Autocorrelation Function[/C][/ROW]
[ROW][C]Time lag k[/C][C]PACF(k)[/C][C]T-STAT[/C][C]P-value[/C][/ROW]
[ROW][C]1[/C][C]-0.256175[/C][C]-1.9677[/C][C]0.026903[/C][/ROW]
[ROW][C]2[/C][C]-0.068269[/C][C]-0.5244[/C][C]0.300988[/C][/ROW]
[ROW][C]3[/C][C]-0.13691[/C][C]-1.0516[/C][C]0.14863[/C][/ROW]
[ROW][C]4[/C][C]-0.235589[/C][C]-1.8096[/C][C]0.037727[/C][/ROW]
[ROW][C]5[/C][C]-0.091892[/C][C]-0.7058[/C][C]0.241534[/C][/ROW]
[ROW][C]6[/C][C]0.004951[/C][C]0.038[/C][C]0.484897[/C][/ROW]
[ROW][C]7[/C][C]-0.12169[/C][C]-0.9347[/C][C]0.176872[/C][/ROW]
[ROW][C]8[/C][C]-0.107944[/C][C]-0.8291[/C][C]0.205185[/C][/ROW]
[ROW][C]9[/C][C]0.250642[/C][C]1.9252[/C][C]0.029513[/C][/ROW]
[ROW][C]10[/C][C]0.084705[/C][C]0.6506[/C][C]0.258904[/C][/ROW]
[ROW][C]11[/C][C]-0.056979[/C][C]-0.4377[/C][C]0.331614[/C][/ROW]
[ROW][C]12[/C][C]-0.339678[/C][C]-2.6091[/C][C]0.005742[/C][/ROW]
[ROW][C]13[/C][C]-0.222522[/C][C]-1.7092[/C][C]0.046332[/C][/ROW]
[ROW][C]14[/C][C]-0.225664[/C][C]-1.7334[/C][C]0.044128[/C][/ROW]
[ROW][C]15[/C][C]0.169271[/C][C]1.3002[/C][C]0.099296[/C][/ROW]
[ROW][C]16[/C][C]-0.257309[/C][C]-1.9764[/C][C]0.026393[/C][/ROW]
[ROW][C]17[/C][C]-0.117958[/C][C]-0.9061[/C][C]0.184297[/C][/ROW]
[ROW][C]18[/C][C]0.058703[/C][C]0.4509[/C][C]0.326854[/C][/ROW]
[ROW][C]19[/C][C]-0.160491[/C][C]-1.2328[/C][C]0.111278[/C][/ROW]
[ROW][C]20[/C][C]0.016639[/C][C]0.1278[/C][C]0.449369[/C][/ROW]
[ROW][C]21[/C][C]-0.004611[/C][C]-0.0354[/C][C]0.485934[/C][/ROW]
[ROW][C]22[/C][C]-0.137614[/C][C]-1.057[/C][C]0.147403[/C][/ROW]
[ROW][C]23[/C][C]-0.10585[/C][C]-0.8131[/C][C]0.209729[/C][/ROW]
[ROW][C]24[/C][C]-0.089212[/C][C]-0.6853[/C][C]0.247935[/C][/ROW]
[ROW][C]25[/C][C]-0.004568[/C][C]-0.0351[/C][C]0.486064[/C][/ROW]
[ROW][C]26[/C][C]0.184053[/C][C]1.4137[/C][C]0.081347[/C][/ROW]
[ROW][C]27[/C][C]-0.048008[/C][C]-0.3688[/C][C]0.356814[/C][/ROW]
[ROW][C]28[/C][C]0.015556[/C][C]0.1195[/C][C]0.452648[/C][/ROW]
[ROW][C]29[/C][C]-0.01661[/C][C]-0.1276[/C][C]0.449455[/C][/ROW]
[ROW][C]30[/C][C]-0.05482[/C][C]-0.4211[/C][C]0.337613[/C][/ROW]
[ROW][C]31[/C][C]-0.101319[/C][C]-0.7782[/C][C]0.219767[/C][/ROW]
[ROW][C]32[/C][C]-0.082618[/C][C]-0.6346[/C][C]0.264072[/C][/ROW]
[ROW][C]33[/C][C]0.083014[/C][C]0.6376[/C][C]0.263086[/C][/ROW]
[ROW][C]34[/C][C]-0.028235[/C][C]-0.2169[/C][C]0.414525[/C][/ROW]
[ROW][C]35[/C][C]-0.111955[/C][C]-0.8599[/C][C]0.19665[/C][/ROW]
[ROW][C]36[/C][C]0.075801[/C][C]0.5822[/C][C]0.281313[/C][/ROW]
[ROW][C]37[/C][C]-0.036853[/C][C]-0.2831[/C][C]0.389055[/C][/ROW]
[ROW][C]38[/C][C]0.019232[/C][C]0.1477[/C][C]0.441533[/C][/ROW]
[ROW][C]39[/C][C]0.051256[/C][C]0.3937[/C][C]0.347609[/C][/ROW]
[ROW][C]40[/C][C]0.081854[/C][C]0.6287[/C][C]0.265976[/C][/ROW]
[ROW][C]41[/C][C]-0.093281[/C][C]-0.7165[/C][C]0.238253[/C][/ROW]
[ROW][C]42[/C][C]0.047532[/C][C]0.3651[/C][C]0.358172[/C][/ROW]
[ROW][C]43[/C][C]-0.039099[/C][C]-0.3003[/C][C]0.382492[/C][/ROW]
[ROW][C]44[/C][C]-0.097996[/C][C]-0.7527[/C][C]0.227305[/C][/ROW]
[ROW][C]45[/C][C]0.115543[/C][C]0.8875[/C][C]0.189206[/C][/ROW]
[ROW][C]46[/C][C]0.055547[/C][C]0.4267[/C][C]0.335589[/C][/ROW]
[ROW][C]47[/C][C]0.080581[/C][C]0.619[/C][C]0.269165[/C][/ROW]
[ROW][C]48[/C][C]-0.0327[/C][C]-0.2512[/C][C]0.401276[/C][/ROW]
[/TABLE]
Source: https://freestatistics.org/blog/index.php?pk=205359&T=2

Globally Unique Identifier (entire table): ba.freestatistics.org/blog/index.php?pk=205359&T=2

As an alternative you can also use a QR Code:  

The GUIDs for individual cells are displayed in the table below:

Partial Autocorrelation Function
Time lag kPACF(k)T-STATP-value
1-0.256175-1.96770.026903
2-0.068269-0.52440.300988
3-0.13691-1.05160.14863
4-0.235589-1.80960.037727
5-0.091892-0.70580.241534
60.0049510.0380.484897
7-0.12169-0.93470.176872
8-0.107944-0.82910.205185
90.2506421.92520.029513
100.0847050.65060.258904
11-0.056979-0.43770.331614
12-0.339678-2.60910.005742
13-0.222522-1.70920.046332
14-0.225664-1.73340.044128
150.1692711.30020.099296
16-0.257309-1.97640.026393
17-0.117958-0.90610.184297
180.0587030.45090.326854
19-0.160491-1.23280.111278
200.0166390.12780.449369
21-0.004611-0.03540.485934
22-0.137614-1.0570.147403
23-0.10585-0.81310.209729
24-0.089212-0.68530.247935
25-0.004568-0.03510.486064
260.1840531.41370.081347
27-0.048008-0.36880.356814
280.0155560.11950.452648
29-0.01661-0.12760.449455
30-0.05482-0.42110.337613
31-0.101319-0.77820.219767
32-0.082618-0.63460.264072
330.0830140.63760.263086
34-0.028235-0.21690.414525
35-0.111955-0.85990.19665
360.0758010.58220.281313
37-0.036853-0.28310.389055
380.0192320.14770.441533
390.0512560.39370.347609
400.0818540.62870.265976
41-0.093281-0.71650.238253
420.0475320.36510.358172
43-0.039099-0.30030.382492
44-0.097996-0.75270.227305
450.1155430.88750.189206
460.0555470.42670.335589
470.0805810.6190.269165
48-0.0327-0.25120.401276


Parameters (Session):
par1 = 48 ; par2 = 1 ; par3 = 1 ; par4 = 1 ; par5 = 12 ; par6 = White Noise ; par7 = 0.95 ;
Parameters (R input):
par1 = 48 ; par2 = 1 ; par3 = 1 ; par4 = 1 ; par5 = 12 ; par6 = White Noise ; par7 = 0.95 ; par8 = ;
R code (references can be found in the software module):
if (par1 == 'Default') {
par1 = 10*log10(length(x))
} else {
par1 <- as.numeric(par1)
}
par2 <- as.numeric(par2)
par3 <- as.numeric(par3)
par4 <- as.numeric(par4)
par5 <- as.numeric(par5)
if (par6 == 'White Noise') par6 <- 'white' else par6 <- 'ma'
par7 <- as.numeric(par7)
if (par8 != '') par8 <- as.numeric(par8)
ox <- x
if (par8 == '') {
if (par2 == 0) {
x <- log(x)
} else {
x <- (x ^ par2 - 1) / par2
}
} else {
x <- log(x,base=par8)
}
if (par3 > 0) x <- diff(x,lag=1,difference=par3)
if (par4 > 0) x <- diff(x,lag=par5,difference=par4)
bitmap(file='picts.png')
op <- par(mfrow=c(2,1))
plot(ox,type='l',main='Original Time Series',xlab='time',ylab='value')
if (par8=='') {
mytitle <- paste('Working Time Series (lambda=',par2,', d=',par3,', D=',par4,')',sep='')
mysub <- paste('(lambda=',par2,', d=',par3,', D=',par4,', CI=', par7, ', CI type=',par6,')',sep='')
} else {
mytitle <- paste('Working Time Series (base=',par8,', d=',par3,', D=',par4,')',sep='')
mysub <- paste('(base=',par8,', d=',par3,', D=',par4,', CI=', par7, ', CI type=',par6,')',sep='')
}
plot(x,type='l', main=mytitle,xlab='time',ylab='value')
par(op)
dev.off()
bitmap(file='pic1.png')
racf <- acf(x, par1, main='Autocorrelation', xlab='time lag', ylab='ACF', ci.type=par6, ci=par7, sub=mysub)
dev.off()
bitmap(file='pic2.png')
rpacf <- pacf(x,par1,main='Partial Autocorrelation',xlab='lags',ylab='PACF',sub=mysub)
dev.off()
(myacf <- c(racf$acf))
(mypacf <- c(rpacf$acf))
lengthx <- length(x)
sqrtn <- sqrt(lengthx)
load(file='createtable')
a<-table.start()
a<-table.row.start(a)
a<-table.element(a,'Autocorrelation Function',4,TRUE)
a<-table.row.end(a)
a<-table.row.start(a)
a<-table.element(a,'Time lag k',header=TRUE)
a<-table.element(a,hyperlink('basics.htm','ACF(k)','click here for more information about the Autocorrelation Function'),header=TRUE)
a<-table.element(a,'T-STAT',header=TRUE)
a<-table.element(a,'P-value',header=TRUE)
a<-table.row.end(a)
for (i in 2:(par1+1)) {
a<-table.row.start(a)
a<-table.element(a,i-1,header=TRUE)
a<-table.element(a,round(myacf[i],6))
mytstat <- myacf[i]*sqrtn
a<-table.element(a,round(mytstat,4))
a<-table.element(a,round(1-pt(abs(mytstat),lengthx),6))
a<-table.row.end(a)
}
a<-table.end(a)
table.save(a,file='mytable.tab')
a<-table.start()
a<-table.row.start(a)
a<-table.element(a,'Partial Autocorrelation Function',4,TRUE)
a<-table.row.end(a)
a<-table.row.start(a)
a<-table.element(a,'Time lag k',header=TRUE)
a<-table.element(a,hyperlink('basics.htm','PACF(k)','click here for more information about the Partial Autocorrelation Function'),header=TRUE)
a<-table.element(a,'T-STAT',header=TRUE)
a<-table.element(a,'P-value',header=TRUE)
a<-table.row.end(a)
for (i in 1:par1) {
a<-table.row.start(a)
a<-table.element(a,i,header=TRUE)
a<-table.element(a,round(mypacf[i],6))
mytstat <- mypacf[i]*sqrtn
a<-table.element(a,round(mytstat,4))
a<-table.element(a,round(1-pt(abs(mytstat),lengthx),6))
a<-table.row.end(a)
}
a<-table.end(a)
table.save(a,file='mytable1.tab')