Free Statistics
of Irreproducible Research!
Description of Statistical Computation | |||||||||||||||||||||||||||||||||||||||||
|---|---|---|---|---|---|---|---|---|---|---|---|---|---|---|---|---|---|---|---|---|---|---|---|---|---|---|---|---|---|---|---|---|---|---|---|---|---|---|---|---|---|
| Author's title | |||||||||||||||||||||||||||||||||||||||||
| Author | *Unverified author* | ||||||||||||||||||||||||||||||||||||||||
| R Software Module | rwasp_univariatedataseries.wasp | ||||||||||||||||||||||||||||||||||||||||
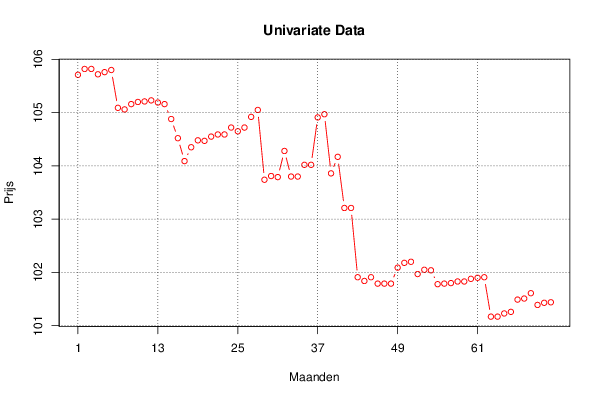
| Title produced by software | Univariate Data Series | ||||||||||||||||||||||||||||||||||||||||
| Date of computation | Thu, 31 Jan 2013 06:58:24 -0500 | ||||||||||||||||||||||||||||||||||||||||
| Cite this page as follows | Statistical Computations at FreeStatistics.org, Office for Research Development and Education, URL https://freestatistics.org/blog/index.php?v=date/2013/Jan/31/t1359634194t1xiiamwi9wijhj.htm/, Retrieved Sun, 28 Apr 2024 00:23:51 +0000 | ||||||||||||||||||||||||||||||||||||||||
| Statistical Computations at FreeStatistics.org, Office for Research Development and Education, URL https://freestatistics.org/blog/index.php?pk=205938, Retrieved Sun, 28 Apr 2024 00:23:51 +0000 | |||||||||||||||||||||||||||||||||||||||||
| QR Codes: | |||||||||||||||||||||||||||||||||||||||||
|
| |||||||||||||||||||||||||||||||||||||||||
| Original text written by user: | Hierbij vindt u de gemiddelde consumptieprijzen van farmaceutische producten | ||||||||||||||||||||||||||||||||||||||||
| IsPrivate? | No (this computation is public) | ||||||||||||||||||||||||||||||||||||||||
| User-defined keywords | Gemiddelde consumptieprijzen van farmaceutische producten | ||||||||||||||||||||||||||||||||||||||||
| Estimated Impact | 127 | ||||||||||||||||||||||||||||||||||||||||
Tree of Dependent Computations | |||||||||||||||||||||||||||||||||||||||||
| Family? (F = Feedback message, R = changed R code, M = changed R Module, P = changed Parameters, D = changed Data) | |||||||||||||||||||||||||||||||||||||||||
| - [Univariate Data Series] [] [2013-01-31 11:58:24] [0941a6a4eb2aa1312aa94e558e86fae5] [Current] - R D [Univariate Data Series] [] [2013-02-07 09:34:13] [2a07394484eafc374c02f189b1f9230e] - R D [Univariate Data Series] [] [2013-02-07 09:44:09] [2a07394484eafc374c02f189b1f9230e] - RMP [Histogram] [] [2013-02-07 14:57:28] [2a07394484eafc374c02f189b1f9230e] - RMP [Histogram] [] [2013-02-07 15:00:36] [2a07394484eafc374c02f189b1f9230e] - RMP [Histogram] [] [2013-02-07 15:02:23] [2a07394484eafc374c02f189b1f9230e] - RMP [Kernel Density Estimation] [] [2013-02-07 15:04:16] [2a07394484eafc374c02f189b1f9230e] | |||||||||||||||||||||||||||||||||||||||||
| Feedback Forum | |||||||||||||||||||||||||||||||||||||||||
Post a new message | |||||||||||||||||||||||||||||||||||||||||
Dataset | |||||||||||||||||||||||||||||||||||||||||
| Dataseries X: | |||||||||||||||||||||||||||||||||||||||||
105,71 105,82 105,82 105,72 105,76 105,80 105,09 105,06 105,16 105,20 105,21 105,23 105,19 105,16 104,88 104,52 104,09 104,35 104,48 104,47 104,55 104,59 104,59 104,72 104,65 104,72 104,92 105,05 103,74 103,81 103,79 104,28 103,80 103,80 104,02 104,02 104,91 104,97 103,86 104,17 103,21 103,21 101,91 101,84 101,91 101,79 101,79 101,79 102,09 102,18 102,20 101,97 102,05 102,04 101,78 101,79 101,80 101,83 101,83 101,88 101,90 101,91 101,17 101,17 101,23 101,26 101,49 101,51 101,61 101,39 101,43 101,44 | |||||||||||||||||||||||||||||||||||||||||
Tables (Output of Computation) | |||||||||||||||||||||||||||||||||||||||||
| |||||||||||||||||||||||||||||||||||||||||
Figures (Output of Computation) | |||||||||||||||||||||||||||||||||||||||||
Input Parameters & R Code | |||||||||||||||||||||||||||||||||||||||||
| Parameters (Session): | |||||||||||||||||||||||||||||||||||||||||
| par1 = Consumptieprijs farm geneesmiddelen in euro ; par2 = Belgostat ; par3 = Consumptieprijs farm geneesmiddelen in euro ; par4 = 12 ; | |||||||||||||||||||||||||||||||||||||||||
| Parameters (R input): | |||||||||||||||||||||||||||||||||||||||||
| par1 = Consumptieprijs farm geneesmiddelen in euro ; par2 = Belgostat ; par3 = Consumptieprijs farm geneesmiddelen in euro ; par4 = 12 ; | |||||||||||||||||||||||||||||||||||||||||
| R code (references can be found in the software module): | |||||||||||||||||||||||||||||||||||||||||
if (par4 != 'No season') { | |||||||||||||||||||||||||||||||||||||||||