Free Statistics
of Irreproducible Research!
Description of Statistical Computation | |||||||||||||||||||||||||||||||||||||||||
|---|---|---|---|---|---|---|---|---|---|---|---|---|---|---|---|---|---|---|---|---|---|---|---|---|---|---|---|---|---|---|---|---|---|---|---|---|---|---|---|---|---|
| Author's title | |||||||||||||||||||||||||||||||||||||||||
| Author | *Unverified author* | ||||||||||||||||||||||||||||||||||||||||
| R Software Module | rwasp_univariatedataseries.wasp | ||||||||||||||||||||||||||||||||||||||||
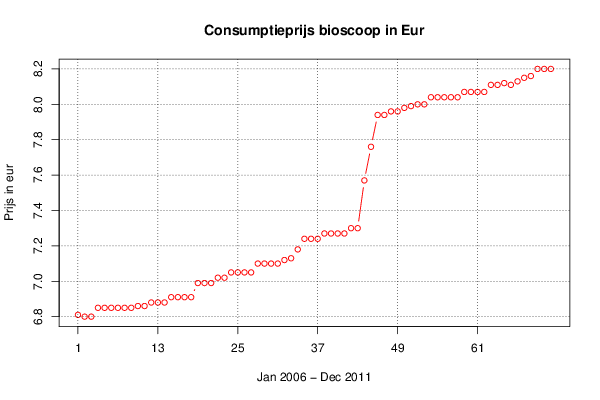
| Title produced by software | Univariate Data Series | ||||||||||||||||||||||||||||||||||||||||
| Date of computation | Thu, 31 Jan 2013 12:53:10 -0500 | ||||||||||||||||||||||||||||||||||||||||
| Cite this page as follows | Statistical Computations at FreeStatistics.org, Office for Research Development and Education, URL https://freestatistics.org/blog/index.php?v=date/2013/Jan/31/t1359654833cfafj0d4a1td9b9.htm/, Retrieved Sun, 28 Apr 2024 04:13:42 +0000 | ||||||||||||||||||||||||||||||||||||||||
| Statistical Computations at FreeStatistics.org, Office for Research Development and Education, URL https://freestatistics.org/blog/index.php?pk=205978, Retrieved Sun, 28 Apr 2024 04:13:42 +0000 | |||||||||||||||||||||||||||||||||||||||||
| QR Codes: | |||||||||||||||||||||||||||||||||||||||||
|
| |||||||||||||||||||||||||||||||||||||||||
| Original text written by user: | |||||||||||||||||||||||||||||||||||||||||
| IsPrivate? | No (this computation is public) | ||||||||||||||||||||||||||||||||||||||||
| User-defined keywords | |||||||||||||||||||||||||||||||||||||||||
| Estimated Impact | 176 | ||||||||||||||||||||||||||||||||||||||||
Tree of Dependent Computations | |||||||||||||||||||||||||||||||||||||||||
| Family? (F = Feedback message, R = changed R code, M = changed R Module, P = changed Parameters, D = changed Data) | |||||||||||||||||||||||||||||||||||||||||
| - [Univariate Data Series] [Consumptieprijs b...] [2013-01-31 17:53:10] [989f55388136532f0412af85431b09ea] [Current] - R PD [Univariate Data Series] [] [2013-02-07 15:54:01] [9ddb3adf19236c8915a57074898b2ab2] - R PD [Univariate Data Series] [] [2013-02-07 15:54:01] [9ddb3adf19236c8915a57074898b2ab2] - R PD [Univariate Data Series] [] [2013-02-07 15:56:24] [9ddb3adf19236c8915a57074898b2ab2] - RMPD [Histogram] [] [2013-02-07 17:01:38] [74be16979710d4c4e7c6647856088456] - RM [Histogram] [] [2013-02-14 16:43:32] [9ddb3adf19236c8915a57074898b2ab2] - R PD [Histogram] [] [2013-02-14 16:53:32] [9ddb3adf19236c8915a57074898b2ab2] - P [Histogram] [] [2013-02-14 16:59:37] [9ddb3adf19236c8915a57074898b2ab2] - RMP [Kernel Density Estimation] [] [2013-02-14 17:05:45] [9ddb3adf19236c8915a57074898b2ab2] - R D [Univariate Data Series] [] [2013-02-14 16:38:13] [9ddb3adf19236c8915a57074898b2ab2] | |||||||||||||||||||||||||||||||||||||||||
| Feedback Forum | |||||||||||||||||||||||||||||||||||||||||
Post a new message | |||||||||||||||||||||||||||||||||||||||||
Dataset | |||||||||||||||||||||||||||||||||||||||||
| Dataseries X: | |||||||||||||||||||||||||||||||||||||||||
6,81 6,8 6,8 6,85 6,85 6,85 6,85 6,85 6,85 6,86 6,86 6,88 6,88 6,88 6,91 6,91 6,91 6,91 6,99 6,99 6,99 7,02 7,02 7,05 7,05 7,05 7,05 7,1 7,1 7,1 7,1 7,12 7,13 7,18 7,24 7,24 7,24 7,27 7,27 7,27 7,27 7,3 7,3 7,57 7,76 7,94 7,94 7,96 7,96 7,98 7,99 8 8 8,04 8,04 8,04 8,04 8,04 8,07 8,07 8,07 8,07 8,11 8,11 8,12 8,11 8,13 8,15 8,16 8,2 8,2 8,2 | |||||||||||||||||||||||||||||||||||||||||
Tables (Output of Computation) | |||||||||||||||||||||||||||||||||||||||||
| |||||||||||||||||||||||||||||||||||||||||
Figures (Output of Computation) | |||||||||||||||||||||||||||||||||||||||||
Input Parameters & R Code | |||||||||||||||||||||||||||||||||||||||||
| Parameters (Session): | |||||||||||||||||||||||||||||||||||||||||
| par1 = Consumptieprijzen bioscoop per consument ; par2 = Belgostat ; par3 = Consumptieprijzen bioscoop per consument ; par4 = 12 ; | |||||||||||||||||||||||||||||||||||||||||
| Parameters (R input): | |||||||||||||||||||||||||||||||||||||||||
| par1 = Consumptieprijzen bioscoop per consument ; par2 = Belgostat ; par3 = Consumptieprijzen bioscoop per consument ; par4 = 12 ; | |||||||||||||||||||||||||||||||||||||||||
| R code (references can be found in the software module): | |||||||||||||||||||||||||||||||||||||||||
if (par4 != 'No season') { | |||||||||||||||||||||||||||||||||||||||||