Free Statistics
of Irreproducible Research!
Description of Statistical Computation | |||||||||||||||||||||||||||||||||||||||||
|---|---|---|---|---|---|---|---|---|---|---|---|---|---|---|---|---|---|---|---|---|---|---|---|---|---|---|---|---|---|---|---|---|---|---|---|---|---|---|---|---|---|
| Author's title | |||||||||||||||||||||||||||||||||||||||||
| Author | *Unverified author* | ||||||||||||||||||||||||||||||||||||||||
| R Software Module | rwasp_univariatedataseries.wasp | ||||||||||||||||||||||||||||||||||||||||
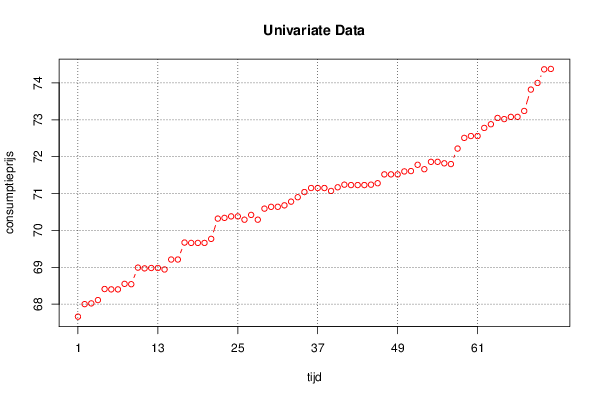
| Title produced by software | Univariate Data Series | ||||||||||||||||||||||||||||||||||||||||
| Date of computation | Thu, 31 Jan 2013 13:05:59 -0500 | ||||||||||||||||||||||||||||||||||||||||
| Cite this page as follows | Statistical Computations at FreeStatistics.org, Office for Research Development and Education, URL https://freestatistics.org/blog/index.php?v=date/2013/Jan/31/t1359655887ki9pbrlttmx4xkm.htm/, Retrieved Sat, 27 Apr 2024 19:36:48 +0000 | ||||||||||||||||||||||||||||||||||||||||
| Statistical Computations at FreeStatistics.org, Office for Research Development and Education, URL https://freestatistics.org/blog/index.php?pk=205979, Retrieved Sat, 27 Apr 2024 19:36:48 +0000 | |||||||||||||||||||||||||||||||||||||||||
| QR Codes: | |||||||||||||||||||||||||||||||||||||||||
|
| |||||||||||||||||||||||||||||||||||||||||
| Original text written by user: | |||||||||||||||||||||||||||||||||||||||||
| IsPrivate? | No (this computation is public) | ||||||||||||||||||||||||||||||||||||||||
| User-defined keywords | |||||||||||||||||||||||||||||||||||||||||
| Estimated Impact | 163 | ||||||||||||||||||||||||||||||||||||||||
Tree of Dependent Computations | |||||||||||||||||||||||||||||||||||||||||
| Family? (F = Feedback message, R = changed R code, M = changed R Module, P = changed Parameters, D = changed Data) | |||||||||||||||||||||||||||||||||||||||||
| - [Univariate Data Series] [gemiddelde consum...] [2013-01-31 18:05:59] [bac2f2624fae9e19ba2034f83762a8f3] [Current] - R PD [Univariate Data Series] [consumptieprijzen] [2013-02-13 09:31:06] [6a6c2f75bf2bd9708d5f14e301096fe2] - RMPD [Histogram] [Number of bins 1,...] [2013-02-13 09:35:52] [6a6c2f75bf2bd9708d5f14e301096fe2] - R P [Histogram] [12 bins histogram] [2013-02-13 09:37:48] [6a6c2f75bf2bd9708d5f14e301096fe2] - R P [Histogram] [20 bins] [2013-02-13 09:39:03] [6a6c2f75bf2bd9708d5f14e301096fe2] - RMPD [Histogram] [Frequentietabel 1] [2013-02-21 14:31:07] [6a6c2f75bf2bd9708d5f14e301096fe2] - RMP [Histogram] [frequentietabel 1] [2013-02-21 14:34:33] [6a6c2f75bf2bd9708d5f14e301096fe2] - PD [Univariate Data Series] [maximumprijs part...] [2013-02-21 14:43:16] [6a6c2f75bf2bd9708d5f14e301096fe2] - RMPD [] [maximumprijs part...] [-0001-11-30 00:00:00] [6a6c2f75bf2bd9708d5f14e301096fe2] - PD [Univariate Data Series] [maximumprijs part...] [2013-02-21 14:47:08] [6a6c2f75bf2bd9708d5f14e301096fe2] - RMPD [Histogram] [Studio 100 PRIJS ...] [2013-02-21 14:50:14] [6a6c2f75bf2bd9708d5f14e301096fe2] - RMPD [Histogram] [studio 100 PRIJS ...] [2013-02-21 14:58:51] [6a6c2f75bf2bd9708d5f14e301096fe2] - RMPD [Histogram] [studio 100 PRIJS ...] [2013-02-21 15:03:17] [6a6c2f75bf2bd9708d5f14e301096fe2] - RMPD [Quartiles] [kwartielen] [2013-02-21 15:13:23] [6a6c2f75bf2bd9708d5f14e301096fe2] - RMPD [Notched Boxplots] [box plot] [2013-02-21 15:17:32] [6a6c2f75bf2bd9708d5f14e301096fe2] - RMPD [Quartiles] [kwartielen consum...] [2013-02-21 15:24:10] [6a6c2f75bf2bd9708d5f14e301096fe2] - RMPD [Notched Boxplots] [box plot broeken] [2013-02-21 15:29:26] [6a6c2f75bf2bd9708d5f14e301096fe2] - RMPD [Harrell-Davis Quantiles] [inschrijvingen ni...] [2013-02-21 15:36:55] [6a6c2f75bf2bd9708d5f14e301096fe2] - RMPD [Harrell-Davis Quantiles] [Harel davies deci...] [2013-02-21 15:40:44] [6a6c2f75bf2bd9708d5f14e301096fe2] - RMPD [Histogram] [] [2013-05-23 09:49:17] [6a6c2f75bf2bd9708d5f14e301096fe2] - RMPD [Histogram] [] [2013-05-23 09:51:41] [6a6c2f75bf2bd9708d5f14e301096fe2] - RMPD [Kernel Density Estimation] [Dichtheidsgrafiek...] [2013-05-23 09:55:34] [6a6c2f75bf2bd9708d5f14e301096fe2] - RMPD [Harrell-Davis Quantiles] [Decielen] [2013-05-23 10:18:46] [6a6c2f75bf2bd9708d5f14e301096fe2] - RMPD [Harrell-Davis Quantiles] [Decielen] [2013-05-23 11:03:18] [6a6c2f75bf2bd9708d5f14e301096fe2] - RMPD [Mean versus Median] [] [2013-05-23 11:59:47] [6a6c2f75bf2bd9708d5f14e301096fe2] - RMPD [Mean versus Median] [] [2013-05-23 11:59:47] [6a6c2f75bf2bd9708d5f14e301096fe2] - RMPD [Mean versus Median] [] [2013-05-23 11:59:47] [6a6c2f75bf2bd9708d5f14e301096fe2] - RMPD [(Partial) Autocorrelation Function] [] [2013-05-23 14:14:41] [6a6c2f75bf2bd9708d5f14e301096fe2] - R P [(Partial) Autocorrelation Function] [] [2013-05-26 13:30:29] [6a6c2f75bf2bd9708d5f14e301096fe2] - RMPD [(Partial) Autocorrelation Function] [] [2013-05-23 14:19:33] [6a6c2f75bf2bd9708d5f14e301096fe2] - R PD [(Partial) Autocorrelation Function] [] [2013-05-26 13:36:27] [6a6c2f75bf2bd9708d5f14e301096fe2] | |||||||||||||||||||||||||||||||||||||||||
| Feedback Forum | |||||||||||||||||||||||||||||||||||||||||
Post a new message | |||||||||||||||||||||||||||||||||||||||||
Dataset | |||||||||||||||||||||||||||||||||||||||||
| Dataseries X: | |||||||||||||||||||||||||||||||||||||||||
67,66 68 68,02 68,11 68,41 68,4 68,4 68,55 68,54 68,99 68,97 68,98 68,98 68,94 69,21 69,21 69,67 69,66 69,66 69,66 69,77 70,32 70,34 70,38 70,38 70,29 70,42 70,29 70,59 70,64 70,64 70,68 70,78 70,9 71,04 71,15 71,15 71,15 71,07 71,17 71,24 71,23 71,23 71,23 71,24 71,28 71,52 71,52 71,52 71,6 71,61 71,78 71,66 71,86 71,86 71,82 71,8 72,22 72,51 72,56 72,56 72,78 72,88 73,05 73,02 73,08 73,08 73,24 73,82 74 74,37 74,38 | |||||||||||||||||||||||||||||||||||||||||
Tables (Output of Computation) | |||||||||||||||||||||||||||||||||||||||||
| |||||||||||||||||||||||||||||||||||||||||
Figures (Output of Computation) | |||||||||||||||||||||||||||||||||||||||||
Input Parameters & R Code | |||||||||||||||||||||||||||||||||||||||||
| Parameters (Session): | |||||||||||||||||||||||||||||||||||||||||
| par1 = gemiddelde consumptieprijzen broeken voor dames en heren ; par2 = belgostat ; par3 = gemiddelde consumptieprijzen broeken voor dames en heren ; par4 = 12 ; | |||||||||||||||||||||||||||||||||||||||||
| Parameters (R input): | |||||||||||||||||||||||||||||||||||||||||
| par1 = gemiddelde consumptieprijzen broeken voor dames en heren ; par2 = belgostat ; par3 = gemiddelde consumptieprijzen broeken voor dames en heren ; par4 = 12 ; | |||||||||||||||||||||||||||||||||||||||||
| R code (references can be found in the software module): | |||||||||||||||||||||||||||||||||||||||||
if (par4 != 'No season') { | |||||||||||||||||||||||||||||||||||||||||