Free Statistics
of Irreproducible Research!
Description of Statistical Computation | |||||||||||||||||||||||||||||||||||||||||
|---|---|---|---|---|---|---|---|---|---|---|---|---|---|---|---|---|---|---|---|---|---|---|---|---|---|---|---|---|---|---|---|---|---|---|---|---|---|---|---|---|---|
| Author's title | |||||||||||||||||||||||||||||||||||||||||
| Author | *Unverified author* | ||||||||||||||||||||||||||||||||||||||||
| R Software Module | rwasp_univariatedataseries.wasp | ||||||||||||||||||||||||||||||||||||||||
| Title produced by software | Univariate Data Series | ||||||||||||||||||||||||||||||||||||||||
| Date of computation | Fri, 28 Jun 2013 08:21:24 -0400 | ||||||||||||||||||||||||||||||||||||||||
| Cite this page as follows | Statistical Computations at FreeStatistics.org, Office for Research Development and Education, URL https://freestatistics.org/blog/index.php?v=date/2013/Jun/28/t13724221786q9pslsmv5pl8br.htm/, Retrieved Sat, 27 Apr 2024 15:34:08 +0000 | ||||||||||||||||||||||||||||||||||||||||
| Statistical Computations at FreeStatistics.org, Office for Research Development and Education, URL https://freestatistics.org/blog/index.php?pk=210766, Retrieved Sat, 27 Apr 2024 15:34:08 +0000 | |||||||||||||||||||||||||||||||||||||||||
| QR Codes: | |||||||||||||||||||||||||||||||||||||||||
|
| |||||||||||||||||||||||||||||||||||||||||
| Original text written by user: | |||||||||||||||||||||||||||||||||||||||||
| IsPrivate? | No (this computation is public) | ||||||||||||||||||||||||||||||||||||||||
| User-defined keywords | Jeroen Biesemans | ||||||||||||||||||||||||||||||||||||||||
| Estimated Impact | 220 | ||||||||||||||||||||||||||||||||||||||||
Tree of Dependent Computations | |||||||||||||||||||||||||||||||||||||||||
| Family? (F = Feedback message, R = changed R code, M = changed R Module, P = changed Parameters, D = changed Data) | |||||||||||||||||||||||||||||||||||||||||
| - [Univariate Data Series] [Tijdreeks 1 stap 2] [2013-06-28 12:21:24] [09688f513f3d2798cb35a3603f8bd204] [Current] | |||||||||||||||||||||||||||||||||||||||||
| Feedback Forum | |||||||||||||||||||||||||||||||||||||||||
Post a new message | |||||||||||||||||||||||||||||||||||||||||
Dataset | |||||||||||||||||||||||||||||||||||||||||
| Dataseries X: | |||||||||||||||||||||||||||||||||||||||||
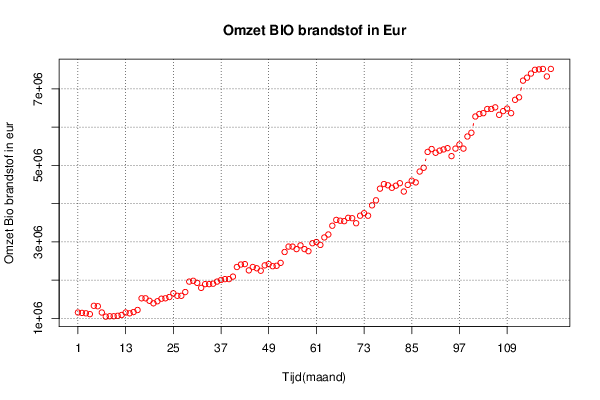
1155168 1144638 1133976 1111920 1330188 1318626 1155168 1046484 1056978 1056978 1068672 1089696 1155168 1133976 1166694 1220472 1526400 1526400 1461096 1395624 1449402 1514838 1526400 1559118 1657302 1591836 1591836 1690020 1962198 1984254 1929480 1798572 1896726 1896726 1907256 1962198 2005446 2027502 2027502 2092938 2344086 2409390 2419884 2256426 2344086 2311368 2245902 2387334 2419884 2365110 2376672 2452638 2736510 2877744 2877744 2812440 2910492 2812440 2757528 2965434 2997984 2920992 3117198 3194196 3423126 3575052 3554034 3542334 3629994 3619332 3488592 3684768 3750240 3684768 3956946 4087854 4392612 4512858 4480272 4414800 4469610 4535046 4316646 4490766 4600518 4556238 4839942 4937958 5352606 5428566 5330544 5385324 5418042 5450760 5242854 5439066 5547744 5439066 5755650 5853708 6278808 6344280 6365304 6475020 6475020 6518268 6322056 6420246 6485550 6365304 6714474 6779916 7215582 7292580 7401258 7499448 7509942 7521504 7325298 7521504 | |||||||||||||||||||||||||||||||||||||||||
Tables (Output of Computation) | |||||||||||||||||||||||||||||||||||||||||
| |||||||||||||||||||||||||||||||||||||||||
Figures (Output of Computation) | |||||||||||||||||||||||||||||||||||||||||
Input Parameters & R Code | |||||||||||||||||||||||||||||||||||||||||
| Parameters (Session): | |||||||||||||||||||||||||||||||||||||||||
| par1 = Omzet Bio brandstof(EUR) ; par2 = Ann ottevaere ; par3 = Omzet Bio brandstof in euro per maand van Januari 2003 tot December 2012 ; par4 = 12 ; | |||||||||||||||||||||||||||||||||||||||||
| Parameters (R input): | |||||||||||||||||||||||||||||||||||||||||
| par1 = Omzet Bio brandstof(EUR) ; par2 = Ann ottevaere ; par3 = Omzet Bio brandstof in euro per maand van Januari 2003 tot December 2012 ; par4 = 12 ; | |||||||||||||||||||||||||||||||||||||||||
| R code (references can be found in the software module): | |||||||||||||||||||||||||||||||||||||||||
if (par4 != 'No season') { | |||||||||||||||||||||||||||||||||||||||||