Free Statistics

of Irreproducible Research!

Author's title

Author*Unverified author*
R Software Modulerwasp_autocorrelation.wasp
Title produced by software(Partial) Autocorrelation Function
Date of computationFri, 15 Mar 2013 07:28:42 -0400
Cite this page as followsStatistical Computations at FreeStatistics.org, Office for Research Development and Education, URL https://freestatistics.org/blog/index.php?v=date/2013/Mar/15/t13633469835btgndcccu067zk.htm/, Retrieved Sun, 28 Apr 2024 12:15:28 +0000
Statistical Computations at FreeStatistics.org, Office for Research Development and Education, URL https://freestatistics.org/blog/index.php?pk=207827, Retrieved Sun, 28 Apr 2024 12:15:28 +0000
QR Codes:

Original text written by user:
IsPrivate?No (this computation is public)
User-defined keywords
Estimated Impact177
Family? (F = Feedback message, R = changed R code, M = changed R Module, P = changed Parameters, D = changed Data)
-       [(Partial) Autocorrelation Function] [autocorrelatie ei...] [2013-03-15 11:28:42] [5f178b5bce8a01d64692a8a5c649399b] [Current]
Feedback Forum

Post a new message
Dataseries X:
599
599
599
599
599
599
599
599
599
617.06
617.06
617.06
617.06
617.06
617.06
617.06
617.06
617.06
617.06
617.06
617.06
628.18
628.18
628.18
628.18
628.18
628.18
628.18
628.18
628.18
628.18
628.18
628.18
641.08
641.08
641.08
641.08
641.08
641.08
641.08
641.08
641.08
641.08
641.08
641.08
668.21
668.21
668.21
668.21
668.21
668.21
668.21
668.21
668.21
668.21
668.21
668.21
665.27
665.27
665.27
665.27
665.27
665.27
665.27
665.27
665.27
665.27
665.27
665.27
674.3
674.3
674.3


Summary of computational transaction
Raw Inputview raw input (R code)
Raw Outputview raw output of R engine
Computing time2 seconds
R Server'Gertrude Mary Cox' @ cox.wessa.net

\begin{tabular}{lllllllll}
\hline
Summary of computational transaction \tabularnewline
Raw Input & view raw input (R code)  \tabularnewline
Raw Output & view raw output of R engine  \tabularnewline
Computing time & 2 seconds \tabularnewline
R Server & 'Gertrude Mary Cox' @ cox.wessa.net \tabularnewline
\hline
\end{tabular}
%Source: https://freestatistics.org/blog/index.php?pk=207827&T=0

[TABLE]
[ROW][C]Summary of computational transaction[/C][/ROW]
[ROW][C]Raw Input[/C][C]view raw input (R code) [/C][/ROW]
[ROW][C]Raw Output[/C][C]view raw output of R engine [/C][/ROW]
[ROW][C]Computing time[/C][C]2 seconds[/C][/ROW]
[ROW][C]R Server[/C][C]'Gertrude Mary Cox' @ cox.wessa.net[/C][/ROW]
[/TABLE]
Source: https://freestatistics.org/blog/index.php?pk=207827&T=0

Globally Unique Identifier (entire table): ba.freestatistics.org/blog/index.php?pk=207827&T=0

As an alternative you can also use a QR Code:  

The GUIDs for individual cells are displayed in the table below:

Summary of computational transaction
Raw Inputview raw input (R code)
Raw Outputview raw output of R engine
Computing time2 seconds
R Server'Gertrude Mary Cox' @ cox.wessa.net


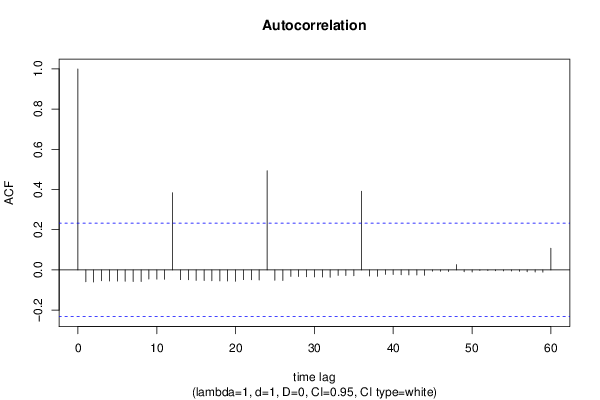
Autocorrelation Function
Time lag kACF(k)T-STATP-value
1-0.059435-0.50080.309028
2-0.06026-0.50780.306597
3-0.054057-0.45550.325072
4-0.054883-0.46250.322586
5-0.055708-0.46940.320109
6-0.056534-0.47640.31764
7-0.057359-0.48330.315179
8-0.058185-0.49030.312726
9-0.044953-0.37880.352989
10-0.045779-0.38570.350422
11-0.046604-0.39270.347861
120.3840593.23610.000921
13-0.048255-0.40660.34276
14-0.049081-0.41360.340221
15-0.052195-0.43980.330709
16-0.05302-0.44680.328206
17-0.053846-0.45370.325711
18-0.054671-0.46070.323223
19-0.055496-0.46760.320744
20-0.056322-0.47460.318272
21-0.048492-0.40860.34203
22-0.049318-0.41560.339493
23-0.050143-0.42250.336963
240.4933764.15734.4e-05
25-0.051794-0.43640.331926
26-0.05262-0.44340.329419
27-0.032329-0.27240.39305
28-0.033154-0.27940.39039
29-0.03398-0.28630.387734
30-0.034805-0.29330.385084
31-0.035631-0.30020.38244
32-0.036456-0.30720.379801
33-0.027241-0.22950.409556
34-0.028066-0.23650.406866
35-0.028892-0.24340.40418
360.3913653.29770.000762
37-0.030543-0.25740.398823
38-0.031368-0.26430.396152
39-0.022153-0.18670.426227
40-0.022979-0.19360.423512
41-0.023804-0.20060.420801
42-0.02463-0.20750.418094
43-0.025455-0.21450.41539
44-0.026281-0.22140.412691
45-0.00599-0.05050.479945
46-0.006815-0.05740.477184
47-0.007641-0.06440.474424
480.026260.22130.412759
49-0.009292-0.07830.468908
50-0.010117-0.08520.466152
51-0.002287-0.01930.492338
52-0.003113-0.02620.489574
53-0.003938-0.03320.48681
54-0.004764-0.04010.484047
55-0.005589-0.04710.481284
56-0.006415-0.05410.478523
57-0.009529-0.08030.468117
58-0.010354-0.08720.465361
59-0.01118-0.09420.462608
600.107680.90730.183651

\begin{tabular}{lllllllll}
\hline
Autocorrelation Function \tabularnewline
Time lag k & ACF(k) & T-STAT & P-value \tabularnewline
1 & -0.059435 & -0.5008 & 0.309028 \tabularnewline
2 & -0.06026 & -0.5078 & 0.306597 \tabularnewline
3 & -0.054057 & -0.4555 & 0.325072 \tabularnewline
4 & -0.054883 & -0.4625 & 0.322586 \tabularnewline
5 & -0.055708 & -0.4694 & 0.320109 \tabularnewline
6 & -0.056534 & -0.4764 & 0.31764 \tabularnewline
7 & -0.057359 & -0.4833 & 0.315179 \tabularnewline
8 & -0.058185 & -0.4903 & 0.312726 \tabularnewline
9 & -0.044953 & -0.3788 & 0.352989 \tabularnewline
10 & -0.045779 & -0.3857 & 0.350422 \tabularnewline
11 & -0.046604 & -0.3927 & 0.347861 \tabularnewline
12 & 0.384059 & 3.2361 & 0.000921 \tabularnewline
13 & -0.048255 & -0.4066 & 0.34276 \tabularnewline
14 & -0.049081 & -0.4136 & 0.340221 \tabularnewline
15 & -0.052195 & -0.4398 & 0.330709 \tabularnewline
16 & -0.05302 & -0.4468 & 0.328206 \tabularnewline
17 & -0.053846 & -0.4537 & 0.325711 \tabularnewline
18 & -0.054671 & -0.4607 & 0.323223 \tabularnewline
19 & -0.055496 & -0.4676 & 0.320744 \tabularnewline
20 & -0.056322 & -0.4746 & 0.318272 \tabularnewline
21 & -0.048492 & -0.4086 & 0.34203 \tabularnewline
22 & -0.049318 & -0.4156 & 0.339493 \tabularnewline
23 & -0.050143 & -0.4225 & 0.336963 \tabularnewline
24 & 0.493376 & 4.1573 & 4.4e-05 \tabularnewline
25 & -0.051794 & -0.4364 & 0.331926 \tabularnewline
26 & -0.05262 & -0.4434 & 0.329419 \tabularnewline
27 & -0.032329 & -0.2724 & 0.39305 \tabularnewline
28 & -0.033154 & -0.2794 & 0.39039 \tabularnewline
29 & -0.03398 & -0.2863 & 0.387734 \tabularnewline
30 & -0.034805 & -0.2933 & 0.385084 \tabularnewline
31 & -0.035631 & -0.3002 & 0.38244 \tabularnewline
32 & -0.036456 & -0.3072 & 0.379801 \tabularnewline
33 & -0.027241 & -0.2295 & 0.409556 \tabularnewline
34 & -0.028066 & -0.2365 & 0.406866 \tabularnewline
35 & -0.028892 & -0.2434 & 0.40418 \tabularnewline
36 & 0.391365 & 3.2977 & 0.000762 \tabularnewline
37 & -0.030543 & -0.2574 & 0.398823 \tabularnewline
38 & -0.031368 & -0.2643 & 0.396152 \tabularnewline
39 & -0.022153 & -0.1867 & 0.426227 \tabularnewline
40 & -0.022979 & -0.1936 & 0.423512 \tabularnewline
41 & -0.023804 & -0.2006 & 0.420801 \tabularnewline
42 & -0.02463 & -0.2075 & 0.418094 \tabularnewline
43 & -0.025455 & -0.2145 & 0.41539 \tabularnewline
44 & -0.026281 & -0.2214 & 0.412691 \tabularnewline
45 & -0.00599 & -0.0505 & 0.479945 \tabularnewline
46 & -0.006815 & -0.0574 & 0.477184 \tabularnewline
47 & -0.007641 & -0.0644 & 0.474424 \tabularnewline
48 & 0.02626 & 0.2213 & 0.412759 \tabularnewline
49 & -0.009292 & -0.0783 & 0.468908 \tabularnewline
50 & -0.010117 & -0.0852 & 0.466152 \tabularnewline
51 & -0.002287 & -0.0193 & 0.492338 \tabularnewline
52 & -0.003113 & -0.0262 & 0.489574 \tabularnewline
53 & -0.003938 & -0.0332 & 0.48681 \tabularnewline
54 & -0.004764 & -0.0401 & 0.484047 \tabularnewline
55 & -0.005589 & -0.0471 & 0.481284 \tabularnewline
56 & -0.006415 & -0.0541 & 0.478523 \tabularnewline
57 & -0.009529 & -0.0803 & 0.468117 \tabularnewline
58 & -0.010354 & -0.0872 & 0.465361 \tabularnewline
59 & -0.01118 & -0.0942 & 0.462608 \tabularnewline
60 & 0.10768 & 0.9073 & 0.183651 \tabularnewline
\hline
\end{tabular}
%Source: https://freestatistics.org/blog/index.php?pk=207827&T=1

[TABLE]
[ROW][C]Autocorrelation Function[/C][/ROW]
[ROW][C]Time lag k[/C][C]ACF(k)[/C][C]T-STAT[/C][C]P-value[/C][/ROW]
[ROW][C]1[/C][C]-0.059435[/C][C]-0.5008[/C][C]0.309028[/C][/ROW]
[ROW][C]2[/C][C]-0.06026[/C][C]-0.5078[/C][C]0.306597[/C][/ROW]
[ROW][C]3[/C][C]-0.054057[/C][C]-0.4555[/C][C]0.325072[/C][/ROW]
[ROW][C]4[/C][C]-0.054883[/C][C]-0.4625[/C][C]0.322586[/C][/ROW]
[ROW][C]5[/C][C]-0.055708[/C][C]-0.4694[/C][C]0.320109[/C][/ROW]
[ROW][C]6[/C][C]-0.056534[/C][C]-0.4764[/C][C]0.31764[/C][/ROW]
[ROW][C]7[/C][C]-0.057359[/C][C]-0.4833[/C][C]0.315179[/C][/ROW]
[ROW][C]8[/C][C]-0.058185[/C][C]-0.4903[/C][C]0.312726[/C][/ROW]
[ROW][C]9[/C][C]-0.044953[/C][C]-0.3788[/C][C]0.352989[/C][/ROW]
[ROW][C]10[/C][C]-0.045779[/C][C]-0.3857[/C][C]0.350422[/C][/ROW]
[ROW][C]11[/C][C]-0.046604[/C][C]-0.3927[/C][C]0.347861[/C][/ROW]
[ROW][C]12[/C][C]0.384059[/C][C]3.2361[/C][C]0.000921[/C][/ROW]
[ROW][C]13[/C][C]-0.048255[/C][C]-0.4066[/C][C]0.34276[/C][/ROW]
[ROW][C]14[/C][C]-0.049081[/C][C]-0.4136[/C][C]0.340221[/C][/ROW]
[ROW][C]15[/C][C]-0.052195[/C][C]-0.4398[/C][C]0.330709[/C][/ROW]
[ROW][C]16[/C][C]-0.05302[/C][C]-0.4468[/C][C]0.328206[/C][/ROW]
[ROW][C]17[/C][C]-0.053846[/C][C]-0.4537[/C][C]0.325711[/C][/ROW]
[ROW][C]18[/C][C]-0.054671[/C][C]-0.4607[/C][C]0.323223[/C][/ROW]
[ROW][C]19[/C][C]-0.055496[/C][C]-0.4676[/C][C]0.320744[/C][/ROW]
[ROW][C]20[/C][C]-0.056322[/C][C]-0.4746[/C][C]0.318272[/C][/ROW]
[ROW][C]21[/C][C]-0.048492[/C][C]-0.4086[/C][C]0.34203[/C][/ROW]
[ROW][C]22[/C][C]-0.049318[/C][C]-0.4156[/C][C]0.339493[/C][/ROW]
[ROW][C]23[/C][C]-0.050143[/C][C]-0.4225[/C][C]0.336963[/C][/ROW]
[ROW][C]24[/C][C]0.493376[/C][C]4.1573[/C][C]4.4e-05[/C][/ROW]
[ROW][C]25[/C][C]-0.051794[/C][C]-0.4364[/C][C]0.331926[/C][/ROW]
[ROW][C]26[/C][C]-0.05262[/C][C]-0.4434[/C][C]0.329419[/C][/ROW]
[ROW][C]27[/C][C]-0.032329[/C][C]-0.2724[/C][C]0.39305[/C][/ROW]
[ROW][C]28[/C][C]-0.033154[/C][C]-0.2794[/C][C]0.39039[/C][/ROW]
[ROW][C]29[/C][C]-0.03398[/C][C]-0.2863[/C][C]0.387734[/C][/ROW]
[ROW][C]30[/C][C]-0.034805[/C][C]-0.2933[/C][C]0.385084[/C][/ROW]
[ROW][C]31[/C][C]-0.035631[/C][C]-0.3002[/C][C]0.38244[/C][/ROW]
[ROW][C]32[/C][C]-0.036456[/C][C]-0.3072[/C][C]0.379801[/C][/ROW]
[ROW][C]33[/C][C]-0.027241[/C][C]-0.2295[/C][C]0.409556[/C][/ROW]
[ROW][C]34[/C][C]-0.028066[/C][C]-0.2365[/C][C]0.406866[/C][/ROW]
[ROW][C]35[/C][C]-0.028892[/C][C]-0.2434[/C][C]0.40418[/C][/ROW]
[ROW][C]36[/C][C]0.391365[/C][C]3.2977[/C][C]0.000762[/C][/ROW]
[ROW][C]37[/C][C]-0.030543[/C][C]-0.2574[/C][C]0.398823[/C][/ROW]
[ROW][C]38[/C][C]-0.031368[/C][C]-0.2643[/C][C]0.396152[/C][/ROW]
[ROW][C]39[/C][C]-0.022153[/C][C]-0.1867[/C][C]0.426227[/C][/ROW]
[ROW][C]40[/C][C]-0.022979[/C][C]-0.1936[/C][C]0.423512[/C][/ROW]
[ROW][C]41[/C][C]-0.023804[/C][C]-0.2006[/C][C]0.420801[/C][/ROW]
[ROW][C]42[/C][C]-0.02463[/C][C]-0.2075[/C][C]0.418094[/C][/ROW]
[ROW][C]43[/C][C]-0.025455[/C][C]-0.2145[/C][C]0.41539[/C][/ROW]
[ROW][C]44[/C][C]-0.026281[/C][C]-0.2214[/C][C]0.412691[/C][/ROW]
[ROW][C]45[/C][C]-0.00599[/C][C]-0.0505[/C][C]0.479945[/C][/ROW]
[ROW][C]46[/C][C]-0.006815[/C][C]-0.0574[/C][C]0.477184[/C][/ROW]
[ROW][C]47[/C][C]-0.007641[/C][C]-0.0644[/C][C]0.474424[/C][/ROW]
[ROW][C]48[/C][C]0.02626[/C][C]0.2213[/C][C]0.412759[/C][/ROW]
[ROW][C]49[/C][C]-0.009292[/C][C]-0.0783[/C][C]0.468908[/C][/ROW]
[ROW][C]50[/C][C]-0.010117[/C][C]-0.0852[/C][C]0.466152[/C][/ROW]
[ROW][C]51[/C][C]-0.002287[/C][C]-0.0193[/C][C]0.492338[/C][/ROW]
[ROW][C]52[/C][C]-0.003113[/C][C]-0.0262[/C][C]0.489574[/C][/ROW]
[ROW][C]53[/C][C]-0.003938[/C][C]-0.0332[/C][C]0.48681[/C][/ROW]
[ROW][C]54[/C][C]-0.004764[/C][C]-0.0401[/C][C]0.484047[/C][/ROW]
[ROW][C]55[/C][C]-0.005589[/C][C]-0.0471[/C][C]0.481284[/C][/ROW]
[ROW][C]56[/C][C]-0.006415[/C][C]-0.0541[/C][C]0.478523[/C][/ROW]
[ROW][C]57[/C][C]-0.009529[/C][C]-0.0803[/C][C]0.468117[/C][/ROW]
[ROW][C]58[/C][C]-0.010354[/C][C]-0.0872[/C][C]0.465361[/C][/ROW]
[ROW][C]59[/C][C]-0.01118[/C][C]-0.0942[/C][C]0.462608[/C][/ROW]
[ROW][C]60[/C][C]0.10768[/C][C]0.9073[/C][C]0.183651[/C][/ROW]
[/TABLE]
Source: https://freestatistics.org/blog/index.php?pk=207827&T=1

Globally Unique Identifier (entire table): ba.freestatistics.org/blog/index.php?pk=207827&T=1

As an alternative you can also use a QR Code:  

The GUIDs for individual cells are displayed in the table below:

Autocorrelation Function
Time lag kACF(k)T-STATP-value
1-0.059435-0.50080.309028
2-0.06026-0.50780.306597
3-0.054057-0.45550.325072
4-0.054883-0.46250.322586
5-0.055708-0.46940.320109
6-0.056534-0.47640.31764
7-0.057359-0.48330.315179
8-0.058185-0.49030.312726
9-0.044953-0.37880.352989
10-0.045779-0.38570.350422
11-0.046604-0.39270.347861
120.3840593.23610.000921
13-0.048255-0.40660.34276
14-0.049081-0.41360.340221
15-0.052195-0.43980.330709
16-0.05302-0.44680.328206
17-0.053846-0.45370.325711
18-0.054671-0.46070.323223
19-0.055496-0.46760.320744
20-0.056322-0.47460.318272
21-0.048492-0.40860.34203
22-0.049318-0.41560.339493
23-0.050143-0.42250.336963
240.4933764.15734.4e-05
25-0.051794-0.43640.331926
26-0.05262-0.44340.329419
27-0.032329-0.27240.39305
28-0.033154-0.27940.39039
29-0.03398-0.28630.387734
30-0.034805-0.29330.385084
31-0.035631-0.30020.38244
32-0.036456-0.30720.379801
33-0.027241-0.22950.409556
34-0.028066-0.23650.406866
35-0.028892-0.24340.40418
360.3913653.29770.000762
37-0.030543-0.25740.398823
38-0.031368-0.26430.396152
39-0.022153-0.18670.426227
40-0.022979-0.19360.423512
41-0.023804-0.20060.420801
42-0.02463-0.20750.418094
43-0.025455-0.21450.41539
44-0.026281-0.22140.412691
45-0.00599-0.05050.479945
46-0.006815-0.05740.477184
47-0.007641-0.06440.474424
480.026260.22130.412759
49-0.009292-0.07830.468908
50-0.010117-0.08520.466152
51-0.002287-0.01930.492338
52-0.003113-0.02620.489574
53-0.003938-0.03320.48681
54-0.004764-0.04010.484047
55-0.005589-0.04710.481284
56-0.006415-0.05410.478523
57-0.009529-0.08030.468117
58-0.010354-0.08720.465361
59-0.01118-0.09420.462608
600.107680.90730.183651


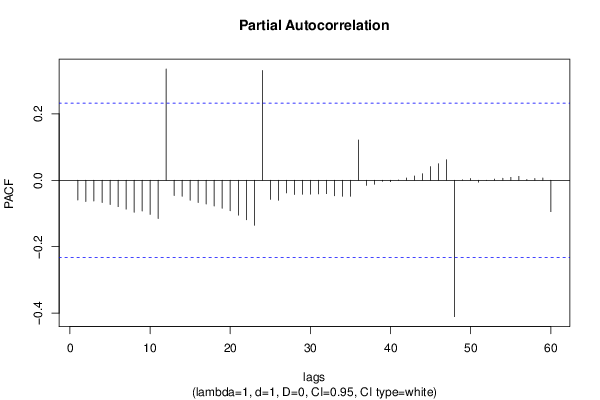
Partial Autocorrelation Function
Time lag kPACF(k)T-STATP-value
1-0.059435-0.50080.309028
2-0.064019-0.53940.295638
3-0.062146-0.52370.301074
4-0.067073-0.56520.286872
5-0.072705-0.61260.271043
6-0.079264-0.66790.253185
7-0.086949-0.73260.233094
8-0.096093-0.80970.210411
9-0.092479-0.77920.219214
10-0.102563-0.86420.195191
11-0.114943-0.96850.168034
120.3352762.82510.003066
13-0.046035-0.38790.349626
14-0.048013-0.40460.343506
15-0.059925-0.50490.307583
16-0.066698-0.5620.287941
17-0.071629-0.60360.274032
18-0.077389-0.65210.258224
19-0.084066-0.70840.240522
20-0.091945-0.77470.220533
21-0.104946-0.88430.189761
22-0.118986-1.00260.159732
23-0.135341-1.14040.128975
240.3305912.78560.003423
25-0.057539-0.48480.314643
26-0.060136-0.50670.306962
27-0.03797-0.31990.374975
28-0.042927-0.36170.359321
29-0.042208-0.35570.361579
30-0.041584-0.35040.363542
31-0.041016-0.34560.36533
32-0.040137-0.33820.368105
33-0.046483-0.39170.348236
34-0.047904-0.40360.343844
35-0.047912-0.40370.343819
360.1213371.02240.155031
37-0.015222-0.12830.449153
38-0.011821-0.09960.460471
39-0.003062-0.02580.489744
40-0.003954-0.03330.486757
410.0008540.00720.497138
420.0067680.0570.477341
430.0129390.1090.456746
440.0198570.16730.433797
450.0411990.34710.364754
460.049860.42010.33783
470.0618550.52120.301925
48-0.410569-3.45950.00046
490.0006080.00510.497962
500.0053810.04530.481982
51-0.005504-0.04640.481568
52-0.000222-0.00190.499256
530.0035210.02970.488208
540.0063670.05370.478682
550.0089480.07540.470054
560.0118420.09980.460401
570.0026310.02220.491189
580.0056910.0480.480943
590.0069360.05840.47678
60-0.094451-0.79590.214383

\begin{tabular}{lllllllll}
\hline
Partial Autocorrelation Function \tabularnewline
Time lag k & PACF(k) & T-STAT & P-value \tabularnewline
1 & -0.059435 & -0.5008 & 0.309028 \tabularnewline
2 & -0.064019 & -0.5394 & 0.295638 \tabularnewline
3 & -0.062146 & -0.5237 & 0.301074 \tabularnewline
4 & -0.067073 & -0.5652 & 0.286872 \tabularnewline
5 & -0.072705 & -0.6126 & 0.271043 \tabularnewline
6 & -0.079264 & -0.6679 & 0.253185 \tabularnewline
7 & -0.086949 & -0.7326 & 0.233094 \tabularnewline
8 & -0.096093 & -0.8097 & 0.210411 \tabularnewline
9 & -0.092479 & -0.7792 & 0.219214 \tabularnewline
10 & -0.102563 & -0.8642 & 0.195191 \tabularnewline
11 & -0.114943 & -0.9685 & 0.168034 \tabularnewline
12 & 0.335276 & 2.8251 & 0.003066 \tabularnewline
13 & -0.046035 & -0.3879 & 0.349626 \tabularnewline
14 & -0.048013 & -0.4046 & 0.343506 \tabularnewline
15 & -0.059925 & -0.5049 & 0.307583 \tabularnewline
16 & -0.066698 & -0.562 & 0.287941 \tabularnewline
17 & -0.071629 & -0.6036 & 0.274032 \tabularnewline
18 & -0.077389 & -0.6521 & 0.258224 \tabularnewline
19 & -0.084066 & -0.7084 & 0.240522 \tabularnewline
20 & -0.091945 & -0.7747 & 0.220533 \tabularnewline
21 & -0.104946 & -0.8843 & 0.189761 \tabularnewline
22 & -0.118986 & -1.0026 & 0.159732 \tabularnewline
23 & -0.135341 & -1.1404 & 0.128975 \tabularnewline
24 & 0.330591 & 2.7856 & 0.003423 \tabularnewline
25 & -0.057539 & -0.4848 & 0.314643 \tabularnewline
26 & -0.060136 & -0.5067 & 0.306962 \tabularnewline
27 & -0.03797 & -0.3199 & 0.374975 \tabularnewline
28 & -0.042927 & -0.3617 & 0.359321 \tabularnewline
29 & -0.042208 & -0.3557 & 0.361579 \tabularnewline
30 & -0.041584 & -0.3504 & 0.363542 \tabularnewline
31 & -0.041016 & -0.3456 & 0.36533 \tabularnewline
32 & -0.040137 & -0.3382 & 0.368105 \tabularnewline
33 & -0.046483 & -0.3917 & 0.348236 \tabularnewline
34 & -0.047904 & -0.4036 & 0.343844 \tabularnewline
35 & -0.047912 & -0.4037 & 0.343819 \tabularnewline
36 & 0.121337 & 1.0224 & 0.155031 \tabularnewline
37 & -0.015222 & -0.1283 & 0.449153 \tabularnewline
38 & -0.011821 & -0.0996 & 0.460471 \tabularnewline
39 & -0.003062 & -0.0258 & 0.489744 \tabularnewline
40 & -0.003954 & -0.0333 & 0.486757 \tabularnewline
41 & 0.000854 & 0.0072 & 0.497138 \tabularnewline
42 & 0.006768 & 0.057 & 0.477341 \tabularnewline
43 & 0.012939 & 0.109 & 0.456746 \tabularnewline
44 & 0.019857 & 0.1673 & 0.433797 \tabularnewline
45 & 0.041199 & 0.3471 & 0.364754 \tabularnewline
46 & 0.04986 & 0.4201 & 0.33783 \tabularnewline
47 & 0.061855 & 0.5212 & 0.301925 \tabularnewline
48 & -0.410569 & -3.4595 & 0.00046 \tabularnewline
49 & 0.000608 & 0.0051 & 0.497962 \tabularnewline
50 & 0.005381 & 0.0453 & 0.481982 \tabularnewline
51 & -0.005504 & -0.0464 & 0.481568 \tabularnewline
52 & -0.000222 & -0.0019 & 0.499256 \tabularnewline
53 & 0.003521 & 0.0297 & 0.488208 \tabularnewline
54 & 0.006367 & 0.0537 & 0.478682 \tabularnewline
55 & 0.008948 & 0.0754 & 0.470054 \tabularnewline
56 & 0.011842 & 0.0998 & 0.460401 \tabularnewline
57 & 0.002631 & 0.0222 & 0.491189 \tabularnewline
58 & 0.005691 & 0.048 & 0.480943 \tabularnewline
59 & 0.006936 & 0.0584 & 0.47678 \tabularnewline
60 & -0.094451 & -0.7959 & 0.214383 \tabularnewline
\hline
\end{tabular}
%Source: https://freestatistics.org/blog/index.php?pk=207827&T=2

[TABLE]
[ROW][C]Partial Autocorrelation Function[/C][/ROW]
[ROW][C]Time lag k[/C][C]PACF(k)[/C][C]T-STAT[/C][C]P-value[/C][/ROW]
[ROW][C]1[/C][C]-0.059435[/C][C]-0.5008[/C][C]0.309028[/C][/ROW]
[ROW][C]2[/C][C]-0.064019[/C][C]-0.5394[/C][C]0.295638[/C][/ROW]
[ROW][C]3[/C][C]-0.062146[/C][C]-0.5237[/C][C]0.301074[/C][/ROW]
[ROW][C]4[/C][C]-0.067073[/C][C]-0.5652[/C][C]0.286872[/C][/ROW]
[ROW][C]5[/C][C]-0.072705[/C][C]-0.6126[/C][C]0.271043[/C][/ROW]
[ROW][C]6[/C][C]-0.079264[/C][C]-0.6679[/C][C]0.253185[/C][/ROW]
[ROW][C]7[/C][C]-0.086949[/C][C]-0.7326[/C][C]0.233094[/C][/ROW]
[ROW][C]8[/C][C]-0.096093[/C][C]-0.8097[/C][C]0.210411[/C][/ROW]
[ROW][C]9[/C][C]-0.092479[/C][C]-0.7792[/C][C]0.219214[/C][/ROW]
[ROW][C]10[/C][C]-0.102563[/C][C]-0.8642[/C][C]0.195191[/C][/ROW]
[ROW][C]11[/C][C]-0.114943[/C][C]-0.9685[/C][C]0.168034[/C][/ROW]
[ROW][C]12[/C][C]0.335276[/C][C]2.8251[/C][C]0.003066[/C][/ROW]
[ROW][C]13[/C][C]-0.046035[/C][C]-0.3879[/C][C]0.349626[/C][/ROW]
[ROW][C]14[/C][C]-0.048013[/C][C]-0.4046[/C][C]0.343506[/C][/ROW]
[ROW][C]15[/C][C]-0.059925[/C][C]-0.5049[/C][C]0.307583[/C][/ROW]
[ROW][C]16[/C][C]-0.066698[/C][C]-0.562[/C][C]0.287941[/C][/ROW]
[ROW][C]17[/C][C]-0.071629[/C][C]-0.6036[/C][C]0.274032[/C][/ROW]
[ROW][C]18[/C][C]-0.077389[/C][C]-0.6521[/C][C]0.258224[/C][/ROW]
[ROW][C]19[/C][C]-0.084066[/C][C]-0.7084[/C][C]0.240522[/C][/ROW]
[ROW][C]20[/C][C]-0.091945[/C][C]-0.7747[/C][C]0.220533[/C][/ROW]
[ROW][C]21[/C][C]-0.104946[/C][C]-0.8843[/C][C]0.189761[/C][/ROW]
[ROW][C]22[/C][C]-0.118986[/C][C]-1.0026[/C][C]0.159732[/C][/ROW]
[ROW][C]23[/C][C]-0.135341[/C][C]-1.1404[/C][C]0.128975[/C][/ROW]
[ROW][C]24[/C][C]0.330591[/C][C]2.7856[/C][C]0.003423[/C][/ROW]
[ROW][C]25[/C][C]-0.057539[/C][C]-0.4848[/C][C]0.314643[/C][/ROW]
[ROW][C]26[/C][C]-0.060136[/C][C]-0.5067[/C][C]0.306962[/C][/ROW]
[ROW][C]27[/C][C]-0.03797[/C][C]-0.3199[/C][C]0.374975[/C][/ROW]
[ROW][C]28[/C][C]-0.042927[/C][C]-0.3617[/C][C]0.359321[/C][/ROW]
[ROW][C]29[/C][C]-0.042208[/C][C]-0.3557[/C][C]0.361579[/C][/ROW]
[ROW][C]30[/C][C]-0.041584[/C][C]-0.3504[/C][C]0.363542[/C][/ROW]
[ROW][C]31[/C][C]-0.041016[/C][C]-0.3456[/C][C]0.36533[/C][/ROW]
[ROW][C]32[/C][C]-0.040137[/C][C]-0.3382[/C][C]0.368105[/C][/ROW]
[ROW][C]33[/C][C]-0.046483[/C][C]-0.3917[/C][C]0.348236[/C][/ROW]
[ROW][C]34[/C][C]-0.047904[/C][C]-0.4036[/C][C]0.343844[/C][/ROW]
[ROW][C]35[/C][C]-0.047912[/C][C]-0.4037[/C][C]0.343819[/C][/ROW]
[ROW][C]36[/C][C]0.121337[/C][C]1.0224[/C][C]0.155031[/C][/ROW]
[ROW][C]37[/C][C]-0.015222[/C][C]-0.1283[/C][C]0.449153[/C][/ROW]
[ROW][C]38[/C][C]-0.011821[/C][C]-0.0996[/C][C]0.460471[/C][/ROW]
[ROW][C]39[/C][C]-0.003062[/C][C]-0.0258[/C][C]0.489744[/C][/ROW]
[ROW][C]40[/C][C]-0.003954[/C][C]-0.0333[/C][C]0.486757[/C][/ROW]
[ROW][C]41[/C][C]0.000854[/C][C]0.0072[/C][C]0.497138[/C][/ROW]
[ROW][C]42[/C][C]0.006768[/C][C]0.057[/C][C]0.477341[/C][/ROW]
[ROW][C]43[/C][C]0.012939[/C][C]0.109[/C][C]0.456746[/C][/ROW]
[ROW][C]44[/C][C]0.019857[/C][C]0.1673[/C][C]0.433797[/C][/ROW]
[ROW][C]45[/C][C]0.041199[/C][C]0.3471[/C][C]0.364754[/C][/ROW]
[ROW][C]46[/C][C]0.04986[/C][C]0.4201[/C][C]0.33783[/C][/ROW]
[ROW][C]47[/C][C]0.061855[/C][C]0.5212[/C][C]0.301925[/C][/ROW]
[ROW][C]48[/C][C]-0.410569[/C][C]-3.4595[/C][C]0.00046[/C][/ROW]
[ROW][C]49[/C][C]0.000608[/C][C]0.0051[/C][C]0.497962[/C][/ROW]
[ROW][C]50[/C][C]0.005381[/C][C]0.0453[/C][C]0.481982[/C][/ROW]
[ROW][C]51[/C][C]-0.005504[/C][C]-0.0464[/C][C]0.481568[/C][/ROW]
[ROW][C]52[/C][C]-0.000222[/C][C]-0.0019[/C][C]0.499256[/C][/ROW]
[ROW][C]53[/C][C]0.003521[/C][C]0.0297[/C][C]0.488208[/C][/ROW]
[ROW][C]54[/C][C]0.006367[/C][C]0.0537[/C][C]0.478682[/C][/ROW]
[ROW][C]55[/C][C]0.008948[/C][C]0.0754[/C][C]0.470054[/C][/ROW]
[ROW][C]56[/C][C]0.011842[/C][C]0.0998[/C][C]0.460401[/C][/ROW]
[ROW][C]57[/C][C]0.002631[/C][C]0.0222[/C][C]0.491189[/C][/ROW]
[ROW][C]58[/C][C]0.005691[/C][C]0.048[/C][C]0.480943[/C][/ROW]
[ROW][C]59[/C][C]0.006936[/C][C]0.0584[/C][C]0.47678[/C][/ROW]
[ROW][C]60[/C][C]-0.094451[/C][C]-0.7959[/C][C]0.214383[/C][/ROW]
[/TABLE]
Source: https://freestatistics.org/blog/index.php?pk=207827&T=2

Globally Unique Identifier (entire table): ba.freestatistics.org/blog/index.php?pk=207827&T=2

As an alternative you can also use a QR Code:  

The GUIDs for individual cells are displayed in the table below:

Partial Autocorrelation Function
Time lag kPACF(k)T-STATP-value
1-0.059435-0.50080.309028
2-0.064019-0.53940.295638
3-0.062146-0.52370.301074
4-0.067073-0.56520.286872
5-0.072705-0.61260.271043
6-0.079264-0.66790.253185
7-0.086949-0.73260.233094
8-0.096093-0.80970.210411
9-0.092479-0.77920.219214
10-0.102563-0.86420.195191
11-0.114943-0.96850.168034
120.3352762.82510.003066
13-0.046035-0.38790.349626
14-0.048013-0.40460.343506
15-0.059925-0.50490.307583
16-0.066698-0.5620.287941
17-0.071629-0.60360.274032
18-0.077389-0.65210.258224
19-0.084066-0.70840.240522
20-0.091945-0.77470.220533
21-0.104946-0.88430.189761
22-0.118986-1.00260.159732
23-0.135341-1.14040.128975
240.3305912.78560.003423
25-0.057539-0.48480.314643
26-0.060136-0.50670.306962
27-0.03797-0.31990.374975
28-0.042927-0.36170.359321
29-0.042208-0.35570.361579
30-0.041584-0.35040.363542
31-0.041016-0.34560.36533
32-0.040137-0.33820.368105
33-0.046483-0.39170.348236
34-0.047904-0.40360.343844
35-0.047912-0.40370.343819
360.1213371.02240.155031
37-0.015222-0.12830.449153
38-0.011821-0.09960.460471
39-0.003062-0.02580.489744
40-0.003954-0.03330.486757
410.0008540.00720.497138
420.0067680.0570.477341
430.0129390.1090.456746
440.0198570.16730.433797
450.0411990.34710.364754
460.049860.42010.33783
470.0618550.52120.301925
48-0.410569-3.45950.00046
490.0006080.00510.497962
500.0053810.04530.481982
51-0.005504-0.04640.481568
52-0.000222-0.00190.499256
530.0035210.02970.488208
540.0063670.05370.478682
550.0089480.07540.470054
560.0118420.09980.460401
570.0026310.02220.491189
580.0056910.0480.480943
590.0069360.05840.47678
60-0.094451-0.79590.214383


Parameters (Session):
par1 = 60 ; par2 = 1 ; par3 = 1 ; par4 = 0 ; par5 = 12 ; par6 = White Noise ; par7 = 0.95 ;
Parameters (R input):
par1 = 60 ; par2 = 1 ; par3 = 1 ; par4 = 0 ; par5 = 12 ; par6 = White Noise ; par7 = 0.95 ; par8 = ;
R code (references can be found in the software module):
par8 <- ''
par7 <- '0.95'
par6 <- 'White Noise'
par5 <- '12'
par4 <- '0'
par3 <- '0'
par2 <- '1'
par1 <- '60'
if (par1 == 'Default') {
par1 = 10*log10(length(x))
} else {
par1 <- as.numeric(par1)
}
par2 <- as.numeric(par2)
par3 <- as.numeric(par3)
par4 <- as.numeric(par4)
par5 <- as.numeric(par5)
if (par6 == 'White Noise') par6 <- 'white' else par6 <- 'ma'
par7 <- as.numeric(par7)
if (par8 != '') par8 <- as.numeric(par8)
ox <- x
if (par8 == '') {
if (par2 == 0) {
x <- log(x)
} else {
x <- (x ^ par2 - 1) / par2
}
} else {
x <- log(x,base=par8)
}
if (par3 > 0) x <- diff(x,lag=1,difference=par3)
if (par4 > 0) x <- diff(x,lag=par5,difference=par4)
bitmap(file='picts.png')
op <- par(mfrow=c(2,1))
plot(ox,type='l',main='Original Time Series',xlab='time',ylab='value')
if (par8=='') {
mytitle <- paste('Working Time Series (lambda=',par2,', d=',par3,', D=',par4,')',sep='')
mysub <- paste('(lambda=',par2,', d=',par3,', D=',par4,', CI=', par7, ', CI type=',par6,')',sep='')
} else {
mytitle <- paste('Working Time Series (base=',par8,', d=',par3,', D=',par4,')',sep='')
mysub <- paste('(base=',par8,', d=',par3,', D=',par4,', CI=', par7, ', CI type=',par6,')',sep='')
}
plot(x,type='l', main=mytitle,xlab='time',ylab='value')
par(op)
dev.off()
bitmap(file='pic1.png')
racf <- acf(x, par1, main='Autocorrelation', xlab='time lag', ylab='ACF', ci.type=par6, ci=par7, sub=mysub)
dev.off()
bitmap(file='pic2.png')
rpacf <- pacf(x,par1,main='Partial Autocorrelation',xlab='lags',ylab='PACF',sub=mysub)
dev.off()
(myacf <- c(racf$acf))
(mypacf <- c(rpacf$acf))
lengthx <- length(x)
sqrtn <- sqrt(lengthx)
load(file='createtable')
a<-table.start()
a<-table.row.start(a)
a<-table.element(a,'Autocorrelation Function',4,TRUE)
a<-table.row.end(a)
a<-table.row.start(a)
a<-table.element(a,'Time lag k',header=TRUE)
a<-table.element(a,hyperlink('basics.htm','ACF(k)','click here for more information about the Autocorrelation Function'),header=TRUE)
a<-table.element(a,'T-STAT',header=TRUE)
a<-table.element(a,'P-value',header=TRUE)
a<-table.row.end(a)
for (i in 2:(par1+1)) {
a<-table.row.start(a)
a<-table.element(a,i-1,header=TRUE)
a<-table.element(a,round(myacf[i],6))
mytstat <- myacf[i]*sqrtn
a<-table.element(a,round(mytstat,4))
a<-table.element(a,round(1-pt(abs(mytstat),lengthx),6))
a<-table.row.end(a)
}
a<-table.end(a)
table.save(a,file='mytable.tab')
a<-table.start()
a<-table.row.start(a)
a<-table.element(a,'Partial Autocorrelation Function',4,TRUE)
a<-table.row.end(a)
a<-table.row.start(a)
a<-table.element(a,'Time lag k',header=TRUE)
a<-table.element(a,hyperlink('basics.htm','PACF(k)','click here for more information about the Partial Autocorrelation Function'),header=TRUE)
a<-table.element(a,'T-STAT',header=TRUE)
a<-table.element(a,'P-value',header=TRUE)
a<-table.row.end(a)
for (i in 1:par1) {
a<-table.row.start(a)
a<-table.element(a,i,header=TRUE)
a<-table.element(a,round(mypacf[i],6))
mytstat <- mypacf[i]*sqrtn
a<-table.element(a,round(mytstat,4))
a<-table.element(a,round(1-pt(abs(mytstat),lengthx),6))
a<-table.row.end(a)
}
a<-table.end(a)
table.save(a,file='mytable1.tab')