Free Statistics

of Irreproducible Research!

Author's title

Author*Unverified author*
R Software Modulerwasp_autocorrelation.wasp
Title produced by software(Partial) Autocorrelation Function
Date of computationTue, 19 Mar 2013 10:54:10 -0400
Cite this page as followsStatistical Computations at FreeStatistics.org, Office for Research Development and Education, URL https://freestatistics.org/blog/index.php?v=date/2013/Mar/19/t1363704884jb8uugaa0dy7tzr.htm/, Retrieved Sat, 27 Apr 2024 22:01:48 +0000
Statistical Computations at FreeStatistics.org, Office for Research Development and Education, URL https://freestatistics.org/blog/index.php?pk=207905, Retrieved Sat, 27 Apr 2024 22:01:48 +0000
QR Codes:

Original text written by user:
IsPrivate?No (this computation is public)
User-defined keywords
Estimated Impact105
Family? (F = Feedback message, R = changed R code, M = changed R Module, P = changed Parameters, D = changed Data)
-       [(Partial) Autocorrelation Function] [opgave 6 bis: oef...] [2013-03-19 14:54:10] [16412acc5f1d1890f88c1afdf63f71fe] [Current]
Feedback Forum

Post a new message
Dataseries X:
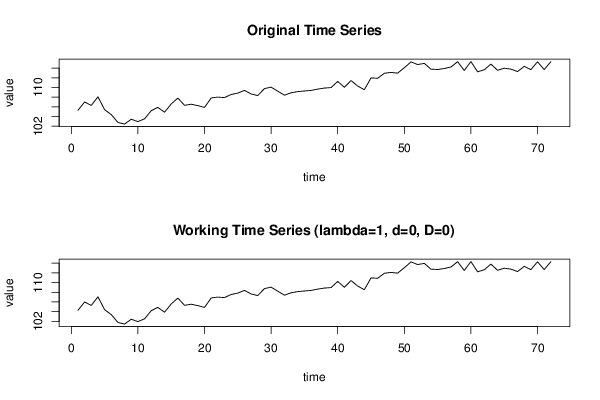
105,28
107
106,29
108,07
105,41
104,4
102,77
102,44
103,43
102,95
103,52
105,2
105,88
104,88
106,59
107,8
106,31
106,53
106,25
105,87
107,83
108,01
107,9
108,55
108,83
109,39
108,65
108,33
109,76
110,07
109,23
108,4
108,9
109,14
109,27
109,38
109,66
109,87
109,98
111,24
110,03
111,43
110,28
109,53
111,97
111,89
112,93
113,11
112,95
114,08
115,27
114,73
114,97
113,78
113,7
113,91
114,22
115,32
113,5
115,35
113,23
113,65
114,82
113,54
113,97
113,79
113,27
114,35
113,68
115,3
113,69
115,31


Summary of computational transaction
Raw Inputview raw input (R code)
Raw Outputview raw output of R engine
Computing time2 seconds
R Server'Herman Ole Andreas Wold' @ wold.wessa.net

\begin{tabular}{lllllllll}
\hline
Summary of computational transaction \tabularnewline
Raw Input & view raw input (R code)  \tabularnewline
Raw Output & view raw output of R engine  \tabularnewline
Computing time & 2 seconds \tabularnewline
R Server & 'Herman Ole Andreas Wold' @ wold.wessa.net \tabularnewline
\hline
\end{tabular}
%Source: https://freestatistics.org/blog/index.php?pk=207905&T=0

[TABLE]
[ROW][C]Summary of computational transaction[/C][/ROW]
[ROW][C]Raw Input[/C][C]view raw input (R code) [/C][/ROW]
[ROW][C]Raw Output[/C][C]view raw output of R engine [/C][/ROW]
[ROW][C]Computing time[/C][C]2 seconds[/C][/ROW]
[ROW][C]R Server[/C][C]'Herman Ole Andreas Wold' @ wold.wessa.net[/C][/ROW]
[/TABLE]
Source: https://freestatistics.org/blog/index.php?pk=207905&T=0

Globally Unique Identifier (entire table): ba.freestatistics.org/blog/index.php?pk=207905&T=0

As an alternative you can also use a QR Code:  

The GUIDs for individual cells are displayed in the table below:

Summary of computational transaction
Raw Inputview raw input (R code)
Raw Outputview raw output of R engine
Computing time2 seconds
R Server'Herman Ole Andreas Wold' @ wold.wessa.net


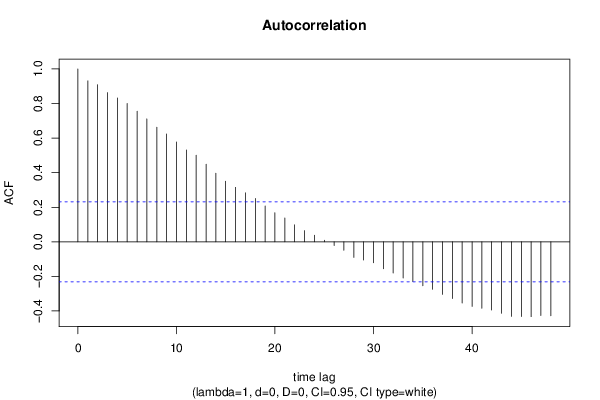
Autocorrelation Function
Time lag kACF(k)T-STATP-value
10.9312217.90170
20.908567.70940
30.8631147.32380
40.8315877.05620
50.7997146.78580
60.7556466.41190
70.7110556.03350
80.6632165.62760
90.6238495.29351e-06
100.5773284.89883e-06
110.5309764.50551.3e-05
120.5004954.24683.2e-05
130.4484223.8050.000147
140.3971983.37030.000605
150.3501132.97080.002017
160.3149722.67260.004652
170.2832492.40340.009409
180.2503822.12460.018529
190.2072961.7590.041416
200.1684511.42940.078613
210.1380151.17110.122711
220.0981650.8330.203811
230.0647310.54930.292264
240.0380430.32280.373888
250.009510.08070.467956
26-0.02101-0.17830.429504
27-0.049208-0.41750.338762
28-0.089847-0.76240.224163
29-0.104974-0.89070.188019
30-0.121236-1.02870.153527
31-0.155927-1.32310.094997
32-0.180091-1.52810.065431
33-0.208968-1.77310.040217
34-0.229676-1.94890.027604
35-0.253736-2.1530.017334
36-0.274811-2.33180.011255
37-0.304062-2.580.005959
38-0.328076-2.78380.003429
39-0.35406-3.00430.00183
40-0.373405-3.16840.001125
41-0.384034-3.25860.000855
42-0.394124-3.34430.000656
43-0.413366-3.50750.000392
44-0.431103-3.6580.00024
45-0.431998-3.66560.000234
46-0.43278-3.67230.000229
47-0.426527-3.61920.000273
48-0.427448-3.6270.000266

\begin{tabular}{lllllllll}
\hline
Autocorrelation Function \tabularnewline
Time lag k & ACF(k) & T-STAT & P-value \tabularnewline
1 & 0.931221 & 7.9017 & 0 \tabularnewline
2 & 0.90856 & 7.7094 & 0 \tabularnewline
3 & 0.863114 & 7.3238 & 0 \tabularnewline
4 & 0.831587 & 7.0562 & 0 \tabularnewline
5 & 0.799714 & 6.7858 & 0 \tabularnewline
6 & 0.755646 & 6.4119 & 0 \tabularnewline
7 & 0.711055 & 6.0335 & 0 \tabularnewline
8 & 0.663216 & 5.6276 & 0 \tabularnewline
9 & 0.623849 & 5.2935 & 1e-06 \tabularnewline
10 & 0.577328 & 4.8988 & 3e-06 \tabularnewline
11 & 0.530976 & 4.5055 & 1.3e-05 \tabularnewline
12 & 0.500495 & 4.2468 & 3.2e-05 \tabularnewline
13 & 0.448422 & 3.805 & 0.000147 \tabularnewline
14 & 0.397198 & 3.3703 & 0.000605 \tabularnewline
15 & 0.350113 & 2.9708 & 0.002017 \tabularnewline
16 & 0.314972 & 2.6726 & 0.004652 \tabularnewline
17 & 0.283249 & 2.4034 & 0.009409 \tabularnewline
18 & 0.250382 & 2.1246 & 0.018529 \tabularnewline
19 & 0.207296 & 1.759 & 0.041416 \tabularnewline
20 & 0.168451 & 1.4294 & 0.078613 \tabularnewline
21 & 0.138015 & 1.1711 & 0.122711 \tabularnewline
22 & 0.098165 & 0.833 & 0.203811 \tabularnewline
23 & 0.064731 & 0.5493 & 0.292264 \tabularnewline
24 & 0.038043 & 0.3228 & 0.373888 \tabularnewline
25 & 0.00951 & 0.0807 & 0.467956 \tabularnewline
26 & -0.02101 & -0.1783 & 0.429504 \tabularnewline
27 & -0.049208 & -0.4175 & 0.338762 \tabularnewline
28 & -0.089847 & -0.7624 & 0.224163 \tabularnewline
29 & -0.104974 & -0.8907 & 0.188019 \tabularnewline
30 & -0.121236 & -1.0287 & 0.153527 \tabularnewline
31 & -0.155927 & -1.3231 & 0.094997 \tabularnewline
32 & -0.180091 & -1.5281 & 0.065431 \tabularnewline
33 & -0.208968 & -1.7731 & 0.040217 \tabularnewline
34 & -0.229676 & -1.9489 & 0.027604 \tabularnewline
35 & -0.253736 & -2.153 & 0.017334 \tabularnewline
36 & -0.274811 & -2.3318 & 0.011255 \tabularnewline
37 & -0.304062 & -2.58 & 0.005959 \tabularnewline
38 & -0.328076 & -2.7838 & 0.003429 \tabularnewline
39 & -0.35406 & -3.0043 & 0.00183 \tabularnewline
40 & -0.373405 & -3.1684 & 0.001125 \tabularnewline
41 & -0.384034 & -3.2586 & 0.000855 \tabularnewline
42 & -0.394124 & -3.3443 & 0.000656 \tabularnewline
43 & -0.413366 & -3.5075 & 0.000392 \tabularnewline
44 & -0.431103 & -3.658 & 0.00024 \tabularnewline
45 & -0.431998 & -3.6656 & 0.000234 \tabularnewline
46 & -0.43278 & -3.6723 & 0.000229 \tabularnewline
47 & -0.426527 & -3.6192 & 0.000273 \tabularnewline
48 & -0.427448 & -3.627 & 0.000266 \tabularnewline
\hline
\end{tabular}
%Source: https://freestatistics.org/blog/index.php?pk=207905&T=1

[TABLE]
[ROW][C]Autocorrelation Function[/C][/ROW]
[ROW][C]Time lag k[/C][C]ACF(k)[/C][C]T-STAT[/C][C]P-value[/C][/ROW]
[ROW][C]1[/C][C]0.931221[/C][C]7.9017[/C][C]0[/C][/ROW]
[ROW][C]2[/C][C]0.90856[/C][C]7.7094[/C][C]0[/C][/ROW]
[ROW][C]3[/C][C]0.863114[/C][C]7.3238[/C][C]0[/C][/ROW]
[ROW][C]4[/C][C]0.831587[/C][C]7.0562[/C][C]0[/C][/ROW]
[ROW][C]5[/C][C]0.799714[/C][C]6.7858[/C][C]0[/C][/ROW]
[ROW][C]6[/C][C]0.755646[/C][C]6.4119[/C][C]0[/C][/ROW]
[ROW][C]7[/C][C]0.711055[/C][C]6.0335[/C][C]0[/C][/ROW]
[ROW][C]8[/C][C]0.663216[/C][C]5.6276[/C][C]0[/C][/ROW]
[ROW][C]9[/C][C]0.623849[/C][C]5.2935[/C][C]1e-06[/C][/ROW]
[ROW][C]10[/C][C]0.577328[/C][C]4.8988[/C][C]3e-06[/C][/ROW]
[ROW][C]11[/C][C]0.530976[/C][C]4.5055[/C][C]1.3e-05[/C][/ROW]
[ROW][C]12[/C][C]0.500495[/C][C]4.2468[/C][C]3.2e-05[/C][/ROW]
[ROW][C]13[/C][C]0.448422[/C][C]3.805[/C][C]0.000147[/C][/ROW]
[ROW][C]14[/C][C]0.397198[/C][C]3.3703[/C][C]0.000605[/C][/ROW]
[ROW][C]15[/C][C]0.350113[/C][C]2.9708[/C][C]0.002017[/C][/ROW]
[ROW][C]16[/C][C]0.314972[/C][C]2.6726[/C][C]0.004652[/C][/ROW]
[ROW][C]17[/C][C]0.283249[/C][C]2.4034[/C][C]0.009409[/C][/ROW]
[ROW][C]18[/C][C]0.250382[/C][C]2.1246[/C][C]0.018529[/C][/ROW]
[ROW][C]19[/C][C]0.207296[/C][C]1.759[/C][C]0.041416[/C][/ROW]
[ROW][C]20[/C][C]0.168451[/C][C]1.4294[/C][C]0.078613[/C][/ROW]
[ROW][C]21[/C][C]0.138015[/C][C]1.1711[/C][C]0.122711[/C][/ROW]
[ROW][C]22[/C][C]0.098165[/C][C]0.833[/C][C]0.203811[/C][/ROW]
[ROW][C]23[/C][C]0.064731[/C][C]0.5493[/C][C]0.292264[/C][/ROW]
[ROW][C]24[/C][C]0.038043[/C][C]0.3228[/C][C]0.373888[/C][/ROW]
[ROW][C]25[/C][C]0.00951[/C][C]0.0807[/C][C]0.467956[/C][/ROW]
[ROW][C]26[/C][C]-0.02101[/C][C]-0.1783[/C][C]0.429504[/C][/ROW]
[ROW][C]27[/C][C]-0.049208[/C][C]-0.4175[/C][C]0.338762[/C][/ROW]
[ROW][C]28[/C][C]-0.089847[/C][C]-0.7624[/C][C]0.224163[/C][/ROW]
[ROW][C]29[/C][C]-0.104974[/C][C]-0.8907[/C][C]0.188019[/C][/ROW]
[ROW][C]30[/C][C]-0.121236[/C][C]-1.0287[/C][C]0.153527[/C][/ROW]
[ROW][C]31[/C][C]-0.155927[/C][C]-1.3231[/C][C]0.094997[/C][/ROW]
[ROW][C]32[/C][C]-0.180091[/C][C]-1.5281[/C][C]0.065431[/C][/ROW]
[ROW][C]33[/C][C]-0.208968[/C][C]-1.7731[/C][C]0.040217[/C][/ROW]
[ROW][C]34[/C][C]-0.229676[/C][C]-1.9489[/C][C]0.027604[/C][/ROW]
[ROW][C]35[/C][C]-0.253736[/C][C]-2.153[/C][C]0.017334[/C][/ROW]
[ROW][C]36[/C][C]-0.274811[/C][C]-2.3318[/C][C]0.011255[/C][/ROW]
[ROW][C]37[/C][C]-0.304062[/C][C]-2.58[/C][C]0.005959[/C][/ROW]
[ROW][C]38[/C][C]-0.328076[/C][C]-2.7838[/C][C]0.003429[/C][/ROW]
[ROW][C]39[/C][C]-0.35406[/C][C]-3.0043[/C][C]0.00183[/C][/ROW]
[ROW][C]40[/C][C]-0.373405[/C][C]-3.1684[/C][C]0.001125[/C][/ROW]
[ROW][C]41[/C][C]-0.384034[/C][C]-3.2586[/C][C]0.000855[/C][/ROW]
[ROW][C]42[/C][C]-0.394124[/C][C]-3.3443[/C][C]0.000656[/C][/ROW]
[ROW][C]43[/C][C]-0.413366[/C][C]-3.5075[/C][C]0.000392[/C][/ROW]
[ROW][C]44[/C][C]-0.431103[/C][C]-3.658[/C][C]0.00024[/C][/ROW]
[ROW][C]45[/C][C]-0.431998[/C][C]-3.6656[/C][C]0.000234[/C][/ROW]
[ROW][C]46[/C][C]-0.43278[/C][C]-3.6723[/C][C]0.000229[/C][/ROW]
[ROW][C]47[/C][C]-0.426527[/C][C]-3.6192[/C][C]0.000273[/C][/ROW]
[ROW][C]48[/C][C]-0.427448[/C][C]-3.627[/C][C]0.000266[/C][/ROW]
[/TABLE]
Source: https://freestatistics.org/blog/index.php?pk=207905&T=1

Globally Unique Identifier (entire table): ba.freestatistics.org/blog/index.php?pk=207905&T=1

As an alternative you can also use a QR Code:  

The GUIDs for individual cells are displayed in the table below:

Autocorrelation Function
Time lag kACF(k)T-STATP-value
10.9312217.90170
20.908567.70940
30.8631147.32380
40.8315877.05620
50.7997146.78580
60.7556466.41190
70.7110556.03350
80.6632165.62760
90.6238495.29351e-06
100.5773284.89883e-06
110.5309764.50551.3e-05
120.5004954.24683.2e-05
130.4484223.8050.000147
140.3971983.37030.000605
150.3501132.97080.002017
160.3149722.67260.004652
170.2832492.40340.009409
180.2503822.12460.018529
190.2072961.7590.041416
200.1684511.42940.078613
210.1380151.17110.122711
220.0981650.8330.203811
230.0647310.54930.292264
240.0380430.32280.373888
250.009510.08070.467956
26-0.02101-0.17830.429504
27-0.049208-0.41750.338762
28-0.089847-0.76240.224163
29-0.104974-0.89070.188019
30-0.121236-1.02870.153527
31-0.155927-1.32310.094997
32-0.180091-1.52810.065431
33-0.208968-1.77310.040217
34-0.229676-1.94890.027604
35-0.253736-2.1530.017334
36-0.274811-2.33180.011255
37-0.304062-2.580.005959
38-0.328076-2.78380.003429
39-0.35406-3.00430.00183
40-0.373405-3.16840.001125
41-0.384034-3.25860.000855
42-0.394124-3.34430.000656
43-0.413366-3.50750.000392
44-0.431103-3.6580.00024
45-0.431998-3.66560.000234
46-0.43278-3.67230.000229
47-0.426527-3.61920.000273
48-0.427448-3.6270.000266


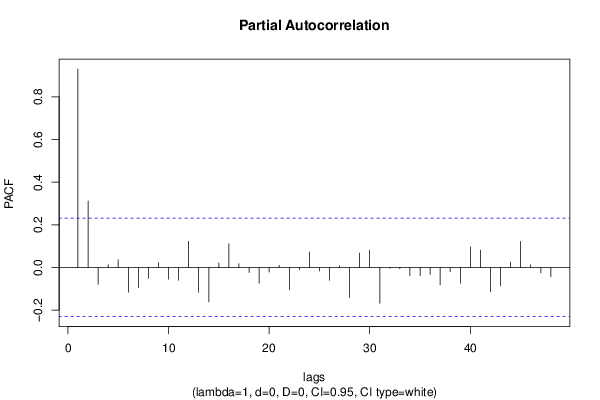
Partial Autocorrelation Function
Time lag kPACF(k)T-STATP-value
10.9312217.90170
20.3115882.64390.005026
3-0.079109-0.67130.2521
40.0125440.10640.457765
50.0359710.30520.380537
6-0.115947-0.98380.164244
7-0.094912-0.80540.211632
8-0.05144-0.43650.331897
90.0221090.18760.42586
10-0.054847-0.46540.321528
11-0.060326-0.51190.305149
120.1223271.0380.151376
13-0.115862-0.98310.164419
14-0.161515-1.37050.087394
150.0206180.17490.430806
160.1105460.9380.175686
170.0169860.14410.442901
18-0.02409-0.20440.419303
19-0.074339-0.63080.26509
20-0.021431-0.18180.428108
210.0096610.0820.467446
22-0.105552-0.89560.186716
23-0.010439-0.08860.464831
240.0727670.61740.269444
25-0.016284-0.13820.445244
26-0.060406-0.51260.304913
270.0083260.07070.471935
28-0.14103-1.19670.117679
290.068110.57790.282555
300.0808530.68610.24744
31-0.16831-1.42820.078785
32-0.003656-0.0310.487667
33-0.006534-0.05540.477968
34-0.037872-0.32140.374435
35-0.039159-0.33230.370324
36-0.033179-0.28150.389555
37-0.081063-0.68780.246882
38-0.020619-0.1750.430802
39-0.074608-0.63310.264347
400.0955350.81060.210121
410.0810950.68810.246796
42-0.113661-0.96440.169026
43-0.086321-0.73250.233134
440.0254710.21610.41475
450.1219111.03440.152195
460.0122960.10430.458596
47-0.024682-0.20940.417349
48-0.043581-0.36980.356309

\begin{tabular}{lllllllll}
\hline
Partial Autocorrelation Function \tabularnewline
Time lag k & PACF(k) & T-STAT & P-value \tabularnewline
1 & 0.931221 & 7.9017 & 0 \tabularnewline
2 & 0.311588 & 2.6439 & 0.005026 \tabularnewline
3 & -0.079109 & -0.6713 & 0.2521 \tabularnewline
4 & 0.012544 & 0.1064 & 0.457765 \tabularnewline
5 & 0.035971 & 0.3052 & 0.380537 \tabularnewline
6 & -0.115947 & -0.9838 & 0.164244 \tabularnewline
7 & -0.094912 & -0.8054 & 0.211632 \tabularnewline
8 & -0.05144 & -0.4365 & 0.331897 \tabularnewline
9 & 0.022109 & 0.1876 & 0.42586 \tabularnewline
10 & -0.054847 & -0.4654 & 0.321528 \tabularnewline
11 & -0.060326 & -0.5119 & 0.305149 \tabularnewline
12 & 0.122327 & 1.038 & 0.151376 \tabularnewline
13 & -0.115862 & -0.9831 & 0.164419 \tabularnewline
14 & -0.161515 & -1.3705 & 0.087394 \tabularnewline
15 & 0.020618 & 0.1749 & 0.430806 \tabularnewline
16 & 0.110546 & 0.938 & 0.175686 \tabularnewline
17 & 0.016986 & 0.1441 & 0.442901 \tabularnewline
18 & -0.02409 & -0.2044 & 0.419303 \tabularnewline
19 & -0.074339 & -0.6308 & 0.26509 \tabularnewline
20 & -0.021431 & -0.1818 & 0.428108 \tabularnewline
21 & 0.009661 & 0.082 & 0.467446 \tabularnewline
22 & -0.105552 & -0.8956 & 0.186716 \tabularnewline
23 & -0.010439 & -0.0886 & 0.464831 \tabularnewline
24 & 0.072767 & 0.6174 & 0.269444 \tabularnewline
25 & -0.016284 & -0.1382 & 0.445244 \tabularnewline
26 & -0.060406 & -0.5126 & 0.304913 \tabularnewline
27 & 0.008326 & 0.0707 & 0.471935 \tabularnewline
28 & -0.14103 & -1.1967 & 0.117679 \tabularnewline
29 & 0.06811 & 0.5779 & 0.282555 \tabularnewline
30 & 0.080853 & 0.6861 & 0.24744 \tabularnewline
31 & -0.16831 & -1.4282 & 0.078785 \tabularnewline
32 & -0.003656 & -0.031 & 0.487667 \tabularnewline
33 & -0.006534 & -0.0554 & 0.477968 \tabularnewline
34 & -0.037872 & -0.3214 & 0.374435 \tabularnewline
35 & -0.039159 & -0.3323 & 0.370324 \tabularnewline
36 & -0.033179 & -0.2815 & 0.389555 \tabularnewline
37 & -0.081063 & -0.6878 & 0.246882 \tabularnewline
38 & -0.020619 & -0.175 & 0.430802 \tabularnewline
39 & -0.074608 & -0.6331 & 0.264347 \tabularnewline
40 & 0.095535 & 0.8106 & 0.210121 \tabularnewline
41 & 0.081095 & 0.6881 & 0.246796 \tabularnewline
42 & -0.113661 & -0.9644 & 0.169026 \tabularnewline
43 & -0.086321 & -0.7325 & 0.233134 \tabularnewline
44 & 0.025471 & 0.2161 & 0.41475 \tabularnewline
45 & 0.121911 & 1.0344 & 0.152195 \tabularnewline
46 & 0.012296 & 0.1043 & 0.458596 \tabularnewline
47 & -0.024682 & -0.2094 & 0.417349 \tabularnewline
48 & -0.043581 & -0.3698 & 0.356309 \tabularnewline
\hline
\end{tabular}
%Source: https://freestatistics.org/blog/index.php?pk=207905&T=2

[TABLE]
[ROW][C]Partial Autocorrelation Function[/C][/ROW]
[ROW][C]Time lag k[/C][C]PACF(k)[/C][C]T-STAT[/C][C]P-value[/C][/ROW]
[ROW][C]1[/C][C]0.931221[/C][C]7.9017[/C][C]0[/C][/ROW]
[ROW][C]2[/C][C]0.311588[/C][C]2.6439[/C][C]0.005026[/C][/ROW]
[ROW][C]3[/C][C]-0.079109[/C][C]-0.6713[/C][C]0.2521[/C][/ROW]
[ROW][C]4[/C][C]0.012544[/C][C]0.1064[/C][C]0.457765[/C][/ROW]
[ROW][C]5[/C][C]0.035971[/C][C]0.3052[/C][C]0.380537[/C][/ROW]
[ROW][C]6[/C][C]-0.115947[/C][C]-0.9838[/C][C]0.164244[/C][/ROW]
[ROW][C]7[/C][C]-0.094912[/C][C]-0.8054[/C][C]0.211632[/C][/ROW]
[ROW][C]8[/C][C]-0.05144[/C][C]-0.4365[/C][C]0.331897[/C][/ROW]
[ROW][C]9[/C][C]0.022109[/C][C]0.1876[/C][C]0.42586[/C][/ROW]
[ROW][C]10[/C][C]-0.054847[/C][C]-0.4654[/C][C]0.321528[/C][/ROW]
[ROW][C]11[/C][C]-0.060326[/C][C]-0.5119[/C][C]0.305149[/C][/ROW]
[ROW][C]12[/C][C]0.122327[/C][C]1.038[/C][C]0.151376[/C][/ROW]
[ROW][C]13[/C][C]-0.115862[/C][C]-0.9831[/C][C]0.164419[/C][/ROW]
[ROW][C]14[/C][C]-0.161515[/C][C]-1.3705[/C][C]0.087394[/C][/ROW]
[ROW][C]15[/C][C]0.020618[/C][C]0.1749[/C][C]0.430806[/C][/ROW]
[ROW][C]16[/C][C]0.110546[/C][C]0.938[/C][C]0.175686[/C][/ROW]
[ROW][C]17[/C][C]0.016986[/C][C]0.1441[/C][C]0.442901[/C][/ROW]
[ROW][C]18[/C][C]-0.02409[/C][C]-0.2044[/C][C]0.419303[/C][/ROW]
[ROW][C]19[/C][C]-0.074339[/C][C]-0.6308[/C][C]0.26509[/C][/ROW]
[ROW][C]20[/C][C]-0.021431[/C][C]-0.1818[/C][C]0.428108[/C][/ROW]
[ROW][C]21[/C][C]0.009661[/C][C]0.082[/C][C]0.467446[/C][/ROW]
[ROW][C]22[/C][C]-0.105552[/C][C]-0.8956[/C][C]0.186716[/C][/ROW]
[ROW][C]23[/C][C]-0.010439[/C][C]-0.0886[/C][C]0.464831[/C][/ROW]
[ROW][C]24[/C][C]0.072767[/C][C]0.6174[/C][C]0.269444[/C][/ROW]
[ROW][C]25[/C][C]-0.016284[/C][C]-0.1382[/C][C]0.445244[/C][/ROW]
[ROW][C]26[/C][C]-0.060406[/C][C]-0.5126[/C][C]0.304913[/C][/ROW]
[ROW][C]27[/C][C]0.008326[/C][C]0.0707[/C][C]0.471935[/C][/ROW]
[ROW][C]28[/C][C]-0.14103[/C][C]-1.1967[/C][C]0.117679[/C][/ROW]
[ROW][C]29[/C][C]0.06811[/C][C]0.5779[/C][C]0.282555[/C][/ROW]
[ROW][C]30[/C][C]0.080853[/C][C]0.6861[/C][C]0.24744[/C][/ROW]
[ROW][C]31[/C][C]-0.16831[/C][C]-1.4282[/C][C]0.078785[/C][/ROW]
[ROW][C]32[/C][C]-0.003656[/C][C]-0.031[/C][C]0.487667[/C][/ROW]
[ROW][C]33[/C][C]-0.006534[/C][C]-0.0554[/C][C]0.477968[/C][/ROW]
[ROW][C]34[/C][C]-0.037872[/C][C]-0.3214[/C][C]0.374435[/C][/ROW]
[ROW][C]35[/C][C]-0.039159[/C][C]-0.3323[/C][C]0.370324[/C][/ROW]
[ROW][C]36[/C][C]-0.033179[/C][C]-0.2815[/C][C]0.389555[/C][/ROW]
[ROW][C]37[/C][C]-0.081063[/C][C]-0.6878[/C][C]0.246882[/C][/ROW]
[ROW][C]38[/C][C]-0.020619[/C][C]-0.175[/C][C]0.430802[/C][/ROW]
[ROW][C]39[/C][C]-0.074608[/C][C]-0.6331[/C][C]0.264347[/C][/ROW]
[ROW][C]40[/C][C]0.095535[/C][C]0.8106[/C][C]0.210121[/C][/ROW]
[ROW][C]41[/C][C]0.081095[/C][C]0.6881[/C][C]0.246796[/C][/ROW]
[ROW][C]42[/C][C]-0.113661[/C][C]-0.9644[/C][C]0.169026[/C][/ROW]
[ROW][C]43[/C][C]-0.086321[/C][C]-0.7325[/C][C]0.233134[/C][/ROW]
[ROW][C]44[/C][C]0.025471[/C][C]0.2161[/C][C]0.41475[/C][/ROW]
[ROW][C]45[/C][C]0.121911[/C][C]1.0344[/C][C]0.152195[/C][/ROW]
[ROW][C]46[/C][C]0.012296[/C][C]0.1043[/C][C]0.458596[/C][/ROW]
[ROW][C]47[/C][C]-0.024682[/C][C]-0.2094[/C][C]0.417349[/C][/ROW]
[ROW][C]48[/C][C]-0.043581[/C][C]-0.3698[/C][C]0.356309[/C][/ROW]
[/TABLE]
Source: https://freestatistics.org/blog/index.php?pk=207905&T=2

Globally Unique Identifier (entire table): ba.freestatistics.org/blog/index.php?pk=207905&T=2

As an alternative you can also use a QR Code:  

The GUIDs for individual cells are displayed in the table below:

Partial Autocorrelation Function
Time lag kPACF(k)T-STATP-value
10.9312217.90170
20.3115882.64390.005026
3-0.079109-0.67130.2521
40.0125440.10640.457765
50.0359710.30520.380537
6-0.115947-0.98380.164244
7-0.094912-0.80540.211632
8-0.05144-0.43650.331897
90.0221090.18760.42586
10-0.054847-0.46540.321528
11-0.060326-0.51190.305149
120.1223271.0380.151376
13-0.115862-0.98310.164419
14-0.161515-1.37050.087394
150.0206180.17490.430806
160.1105460.9380.175686
170.0169860.14410.442901
18-0.02409-0.20440.419303
19-0.074339-0.63080.26509
20-0.021431-0.18180.428108
210.0096610.0820.467446
22-0.105552-0.89560.186716
23-0.010439-0.08860.464831
240.0727670.61740.269444
25-0.016284-0.13820.445244
26-0.060406-0.51260.304913
270.0083260.07070.471935
28-0.14103-1.19670.117679
290.068110.57790.282555
300.0808530.68610.24744
31-0.16831-1.42820.078785
32-0.003656-0.0310.487667
33-0.006534-0.05540.477968
34-0.037872-0.32140.374435
35-0.039159-0.33230.370324
36-0.033179-0.28150.389555
37-0.081063-0.68780.246882
38-0.020619-0.1750.430802
39-0.074608-0.63310.264347
400.0955350.81060.210121
410.0810950.68810.246796
42-0.113661-0.96440.169026
43-0.086321-0.73250.233134
440.0254710.21610.41475
450.1219111.03440.152195
460.0122960.10430.458596
47-0.024682-0.20940.417349
48-0.043581-0.36980.356309


Parameters (Session):
par1 = 48 ; par2 = 1 ; par3 = 0 ; par4 = 0 ; par5 = 12 ; par6 = White Noise ; par7 = 0.95 ;
Parameters (R input):
par1 = 48 ; par2 = 1 ; par3 = 0 ; par4 = 0 ; par5 = 12 ; par6 = White Noise ; par7 = 0.95 ; par8 = ;
R code (references can be found in the software module):
if (par1 == 'Default') {
par1 = 10*log10(length(x))
} else {
par1 <- as.numeric(par1)
}
par2 <- as.numeric(par2)
par3 <- as.numeric(par3)
par4 <- as.numeric(par4)
par5 <- as.numeric(par5)
if (par6 == 'White Noise') par6 <- 'white' else par6 <- 'ma'
par7 <- as.numeric(par7)
if (par8 != '') par8 <- as.numeric(par8)
ox <- x
if (par8 == '') {
if (par2 == 0) {
x <- log(x)
} else {
x <- (x ^ par2 - 1) / par2
}
} else {
x <- log(x,base=par8)
}
if (par3 > 0) x <- diff(x,lag=1,difference=par3)
if (par4 > 0) x <- diff(x,lag=par5,difference=par4)
bitmap(file='picts.png')
op <- par(mfrow=c(2,1))
plot(ox,type='l',main='Original Time Series',xlab='time',ylab='value')
if (par8=='') {
mytitle <- paste('Working Time Series (lambda=',par2,', d=',par3,', D=',par4,')',sep='')
mysub <- paste('(lambda=',par2,', d=',par3,', D=',par4,', CI=', par7, ', CI type=',par6,')',sep='')
} else {
mytitle <- paste('Working Time Series (base=',par8,', d=',par3,', D=',par4,')',sep='')
mysub <- paste('(base=',par8,', d=',par3,', D=',par4,', CI=', par7, ', CI type=',par6,')',sep='')
}
plot(x,type='l', main=mytitle,xlab='time',ylab='value')
par(op)
dev.off()
bitmap(file='pic1.png')
racf <- acf(x, par1, main='Autocorrelation', xlab='time lag', ylab='ACF', ci.type=par6, ci=par7, sub=mysub)
dev.off()
bitmap(file='pic2.png')
rpacf <- pacf(x,par1,main='Partial Autocorrelation',xlab='lags',ylab='PACF',sub=mysub)
dev.off()
(myacf <- c(racf$acf))
(mypacf <- c(rpacf$acf))
lengthx <- length(x)
sqrtn <- sqrt(lengthx)
load(file='createtable')
a<-table.start()
a<-table.row.start(a)
a<-table.element(a,'Autocorrelation Function',4,TRUE)
a<-table.row.end(a)
a<-table.row.start(a)
a<-table.element(a,'Time lag k',header=TRUE)
a<-table.element(a,hyperlink('basics.htm','ACF(k)','click here for more information about the Autocorrelation Function'),header=TRUE)
a<-table.element(a,'T-STAT',header=TRUE)
a<-table.element(a,'P-value',header=TRUE)
a<-table.row.end(a)
for (i in 2:(par1+1)) {
a<-table.row.start(a)
a<-table.element(a,i-1,header=TRUE)
a<-table.element(a,round(myacf[i],6))
mytstat <- myacf[i]*sqrtn
a<-table.element(a,round(mytstat,4))
a<-table.element(a,round(1-pt(abs(mytstat),lengthx),6))
a<-table.row.end(a)
}
a<-table.end(a)
table.save(a,file='mytable.tab')
a<-table.start()
a<-table.row.start(a)
a<-table.element(a,'Partial Autocorrelation Function',4,TRUE)
a<-table.row.end(a)
a<-table.row.start(a)
a<-table.element(a,'Time lag k',header=TRUE)
a<-table.element(a,hyperlink('basics.htm','PACF(k)','click here for more information about the Partial Autocorrelation Function'),header=TRUE)
a<-table.element(a,'T-STAT',header=TRUE)
a<-table.element(a,'P-value',header=TRUE)
a<-table.row.end(a)
for (i in 1:par1) {
a<-table.row.start(a)
a<-table.element(a,i,header=TRUE)
a<-table.element(a,round(mypacf[i],6))
mytstat <- mypacf[i]*sqrtn
a<-table.element(a,round(mytstat,4))
a<-table.element(a,round(1-pt(abs(mytstat),lengthx),6))
a<-table.row.end(a)
}
a<-table.end(a)
table.save(a,file='mytable1.tab')