Free Statistics

of Irreproducible Research!

Author's title

Author*Unverified author*
R Software Modulerwasp_autocorrelation.wasp
Title produced by software(Partial) Autocorrelation Function
Date of computationTue, 19 Mar 2013 11:15:31 -0400
Cite this page as followsStatistical Computations at FreeStatistics.org, Office for Research Development and Education, URL https://freestatistics.org/blog/index.php?v=date/2013/Mar/19/t1363706152ytusix90g975ge3.htm/, Retrieved Sun, 28 Apr 2024 13:30:23 +0000
Statistical Computations at FreeStatistics.org, Office for Research Development and Education, URL https://freestatistics.org/blog/index.php?pk=207908, Retrieved Sun, 28 Apr 2024 13:30:23 +0000
QR Codes:

Original text written by user:
IsPrivate?No (this computation is public)
User-defined keywords
Estimated Impact93
Family? (F = Feedback message, R = changed R code, M = changed R Module, P = changed Parameters, D = changed Data)
-       [(Partial) Autocorrelation Function] [] [2013-03-19 15:15:31] [4cc5e8551edf7d1152616a4a3a38c365] [Current]
Feedback Forum

Post a new message
Dataseries X:
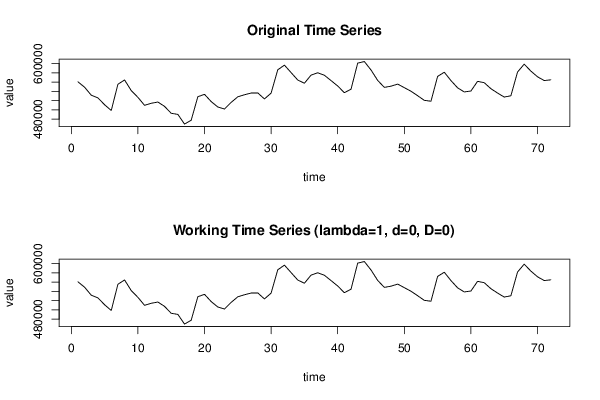
560576
548854
531673
525919
511038
498662
555362
564591
541657
527070
509846
514258
516922
507561
492622
490243
469357
477580
528379
533590
517945
506174
501866
516141
528222
532638
536322
536535
523597
536214
586570
596594
580523
564478
557560
575093
580112
574761
563250
551531
537034
544686
600991
604378
586111
563668
548604
551174
555654
547970
540324
530577
520579
518654
572273
581302
563280
547612
538712
540735
561649
558685
545732
536352
527676
530455
581744
598714
583775
571477
563278
564872


Summary of computational transaction
Raw Inputview raw input (R code)
Raw Outputview raw output of R engine
Computing time3 seconds
R Server'Gwilym Jenkins' @ jenkins.wessa.net

\begin{tabular}{lllllllll}
\hline
Summary of computational transaction \tabularnewline
Raw Input & view raw input (R code)  \tabularnewline
Raw Output & view raw output of R engine  \tabularnewline
Computing time & 3 seconds \tabularnewline
R Server & 'Gwilym Jenkins' @ jenkins.wessa.net \tabularnewline
\hline
\end{tabular}
%Source: https://freestatistics.org/blog/index.php?pk=207908&T=0

[TABLE]
[ROW][C]Summary of computational transaction[/C][/ROW]
[ROW][C]Raw Input[/C][C]view raw input (R code) [/C][/ROW]
[ROW][C]Raw Output[/C][C]view raw output of R engine [/C][/ROW]
[ROW][C]Computing time[/C][C]3 seconds[/C][/ROW]
[ROW][C]R Server[/C][C]'Gwilym Jenkins' @ jenkins.wessa.net[/C][/ROW]
[/TABLE]
Source: https://freestatistics.org/blog/index.php?pk=207908&T=0

Globally Unique Identifier (entire table): ba.freestatistics.org/blog/index.php?pk=207908&T=0

As an alternative you can also use a QR Code:  

The GUIDs for individual cells are displayed in the table below:

Summary of computational transaction
Raw Inputview raw input (R code)
Raw Outputview raw output of R engine
Computing time3 seconds
R Server'Gwilym Jenkins' @ jenkins.wessa.net


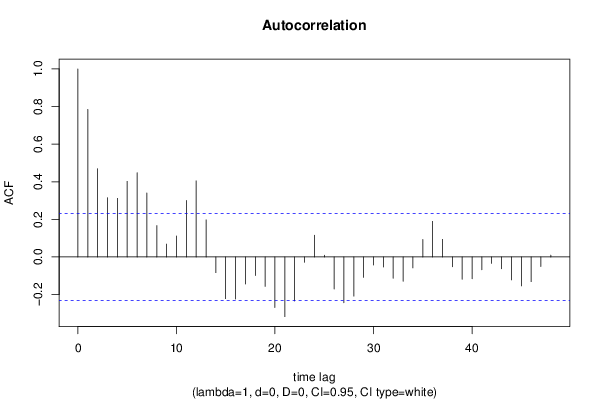
Autocorrelation Function
Time lag kACF(k)T-STATP-value
10.7848356.65950
20.4696373.9858e-05
30.3153022.67540.004616
40.311672.64460.005017
50.4020463.41150.000532
60.4476293.79830.000151
70.3399792.88480.002582
80.1666961.41450.080768
90.0684580.58090.281565
100.1113010.94440.174056
110.3005862.55060.006441
120.4048923.43560.000492
130.197241.67360.04927
14-0.0832-0.7060.241241
15-0.221473-1.87930.032128
16-0.223545-1.89680.03093
17-0.143404-1.21680.113822
18-0.099044-0.84040.20173
19-0.156558-1.32840.094114
20-0.268562-2.27880.012823
21-0.317435-2.69350.004395
22-0.234348-1.98850.025279
23-0.027971-0.23730.406533
240.1153870.97910.165406
250.0089210.07570.469936
26-0.17077-1.4490.075835
27-0.243253-2.06410.021308
28-0.208484-1.7690.040561
29-0.108767-0.92290.179566
30-0.042532-0.36090.359618
31-0.053681-0.45550.325059
32-0.112866-0.95770.17071
33-0.129319-1.09730.138081
34-0.058029-0.49240.311971
350.0930.78910.216314
360.1894551.60760.056152
370.0937770.79570.214403
38-0.05163-0.43810.331315
39-0.118395-1.00460.159223
40-0.11577-0.98230.164612
41-0.068005-0.5770.282855
42-0.03404-0.28880.386768
43-0.062649-0.53160.298322
44-0.122023-1.03540.151973
45-0.153745-1.30460.098097
46-0.131204-1.11330.134641
47-0.050374-0.42740.335168
480.0096610.0820.467446

\begin{tabular}{lllllllll}
\hline
Autocorrelation Function \tabularnewline
Time lag k & ACF(k) & T-STAT & P-value \tabularnewline
1 & 0.784835 & 6.6595 & 0 \tabularnewline
2 & 0.469637 & 3.985 & 8e-05 \tabularnewline
3 & 0.315302 & 2.6754 & 0.004616 \tabularnewline
4 & 0.31167 & 2.6446 & 0.005017 \tabularnewline
5 & 0.402046 & 3.4115 & 0.000532 \tabularnewline
6 & 0.447629 & 3.7983 & 0.000151 \tabularnewline
7 & 0.339979 & 2.8848 & 0.002582 \tabularnewline
8 & 0.166696 & 1.4145 & 0.080768 \tabularnewline
9 & 0.068458 & 0.5809 & 0.281565 \tabularnewline
10 & 0.111301 & 0.9444 & 0.174056 \tabularnewline
11 & 0.300586 & 2.5506 & 0.006441 \tabularnewline
12 & 0.404892 & 3.4356 & 0.000492 \tabularnewline
13 & 0.19724 & 1.6736 & 0.04927 \tabularnewline
14 & -0.0832 & -0.706 & 0.241241 \tabularnewline
15 & -0.221473 & -1.8793 & 0.032128 \tabularnewline
16 & -0.223545 & -1.8968 & 0.03093 \tabularnewline
17 & -0.143404 & -1.2168 & 0.113822 \tabularnewline
18 & -0.099044 & -0.8404 & 0.20173 \tabularnewline
19 & -0.156558 & -1.3284 & 0.094114 \tabularnewline
20 & -0.268562 & -2.2788 & 0.012823 \tabularnewline
21 & -0.317435 & -2.6935 & 0.004395 \tabularnewline
22 & -0.234348 & -1.9885 & 0.025279 \tabularnewline
23 & -0.027971 & -0.2373 & 0.406533 \tabularnewline
24 & 0.115387 & 0.9791 & 0.165406 \tabularnewline
25 & 0.008921 & 0.0757 & 0.469936 \tabularnewline
26 & -0.17077 & -1.449 & 0.075835 \tabularnewline
27 & -0.243253 & -2.0641 & 0.021308 \tabularnewline
28 & -0.208484 & -1.769 & 0.040561 \tabularnewline
29 & -0.108767 & -0.9229 & 0.179566 \tabularnewline
30 & -0.042532 & -0.3609 & 0.359618 \tabularnewline
31 & -0.053681 & -0.4555 & 0.325059 \tabularnewline
32 & -0.112866 & -0.9577 & 0.17071 \tabularnewline
33 & -0.129319 & -1.0973 & 0.138081 \tabularnewline
34 & -0.058029 & -0.4924 & 0.311971 \tabularnewline
35 & 0.093 & 0.7891 & 0.216314 \tabularnewline
36 & 0.189455 & 1.6076 & 0.056152 \tabularnewline
37 & 0.093777 & 0.7957 & 0.214403 \tabularnewline
38 & -0.05163 & -0.4381 & 0.331315 \tabularnewline
39 & -0.118395 & -1.0046 & 0.159223 \tabularnewline
40 & -0.11577 & -0.9823 & 0.164612 \tabularnewline
41 & -0.068005 & -0.577 & 0.282855 \tabularnewline
42 & -0.03404 & -0.2888 & 0.386768 \tabularnewline
43 & -0.062649 & -0.5316 & 0.298322 \tabularnewline
44 & -0.122023 & -1.0354 & 0.151973 \tabularnewline
45 & -0.153745 & -1.3046 & 0.098097 \tabularnewline
46 & -0.131204 & -1.1133 & 0.134641 \tabularnewline
47 & -0.050374 & -0.4274 & 0.335168 \tabularnewline
48 & 0.009661 & 0.082 & 0.467446 \tabularnewline
\hline
\end{tabular}
%Source: https://freestatistics.org/blog/index.php?pk=207908&T=1

[TABLE]
[ROW][C]Autocorrelation Function[/C][/ROW]
[ROW][C]Time lag k[/C][C]ACF(k)[/C][C]T-STAT[/C][C]P-value[/C][/ROW]
[ROW][C]1[/C][C]0.784835[/C][C]6.6595[/C][C]0[/C][/ROW]
[ROW][C]2[/C][C]0.469637[/C][C]3.985[/C][C]8e-05[/C][/ROW]
[ROW][C]3[/C][C]0.315302[/C][C]2.6754[/C][C]0.004616[/C][/ROW]
[ROW][C]4[/C][C]0.31167[/C][C]2.6446[/C][C]0.005017[/C][/ROW]
[ROW][C]5[/C][C]0.402046[/C][C]3.4115[/C][C]0.000532[/C][/ROW]
[ROW][C]6[/C][C]0.447629[/C][C]3.7983[/C][C]0.000151[/C][/ROW]
[ROW][C]7[/C][C]0.339979[/C][C]2.8848[/C][C]0.002582[/C][/ROW]
[ROW][C]8[/C][C]0.166696[/C][C]1.4145[/C][C]0.080768[/C][/ROW]
[ROW][C]9[/C][C]0.068458[/C][C]0.5809[/C][C]0.281565[/C][/ROW]
[ROW][C]10[/C][C]0.111301[/C][C]0.9444[/C][C]0.174056[/C][/ROW]
[ROW][C]11[/C][C]0.300586[/C][C]2.5506[/C][C]0.006441[/C][/ROW]
[ROW][C]12[/C][C]0.404892[/C][C]3.4356[/C][C]0.000492[/C][/ROW]
[ROW][C]13[/C][C]0.19724[/C][C]1.6736[/C][C]0.04927[/C][/ROW]
[ROW][C]14[/C][C]-0.0832[/C][C]-0.706[/C][C]0.241241[/C][/ROW]
[ROW][C]15[/C][C]-0.221473[/C][C]-1.8793[/C][C]0.032128[/C][/ROW]
[ROW][C]16[/C][C]-0.223545[/C][C]-1.8968[/C][C]0.03093[/C][/ROW]
[ROW][C]17[/C][C]-0.143404[/C][C]-1.2168[/C][C]0.113822[/C][/ROW]
[ROW][C]18[/C][C]-0.099044[/C][C]-0.8404[/C][C]0.20173[/C][/ROW]
[ROW][C]19[/C][C]-0.156558[/C][C]-1.3284[/C][C]0.094114[/C][/ROW]
[ROW][C]20[/C][C]-0.268562[/C][C]-2.2788[/C][C]0.012823[/C][/ROW]
[ROW][C]21[/C][C]-0.317435[/C][C]-2.6935[/C][C]0.004395[/C][/ROW]
[ROW][C]22[/C][C]-0.234348[/C][C]-1.9885[/C][C]0.025279[/C][/ROW]
[ROW][C]23[/C][C]-0.027971[/C][C]-0.2373[/C][C]0.406533[/C][/ROW]
[ROW][C]24[/C][C]0.115387[/C][C]0.9791[/C][C]0.165406[/C][/ROW]
[ROW][C]25[/C][C]0.008921[/C][C]0.0757[/C][C]0.469936[/C][/ROW]
[ROW][C]26[/C][C]-0.17077[/C][C]-1.449[/C][C]0.075835[/C][/ROW]
[ROW][C]27[/C][C]-0.243253[/C][C]-2.0641[/C][C]0.021308[/C][/ROW]
[ROW][C]28[/C][C]-0.208484[/C][C]-1.769[/C][C]0.040561[/C][/ROW]
[ROW][C]29[/C][C]-0.108767[/C][C]-0.9229[/C][C]0.179566[/C][/ROW]
[ROW][C]30[/C][C]-0.042532[/C][C]-0.3609[/C][C]0.359618[/C][/ROW]
[ROW][C]31[/C][C]-0.053681[/C][C]-0.4555[/C][C]0.325059[/C][/ROW]
[ROW][C]32[/C][C]-0.112866[/C][C]-0.9577[/C][C]0.17071[/C][/ROW]
[ROW][C]33[/C][C]-0.129319[/C][C]-1.0973[/C][C]0.138081[/C][/ROW]
[ROW][C]34[/C][C]-0.058029[/C][C]-0.4924[/C][C]0.311971[/C][/ROW]
[ROW][C]35[/C][C]0.093[/C][C]0.7891[/C][C]0.216314[/C][/ROW]
[ROW][C]36[/C][C]0.189455[/C][C]1.6076[/C][C]0.056152[/C][/ROW]
[ROW][C]37[/C][C]0.093777[/C][C]0.7957[/C][C]0.214403[/C][/ROW]
[ROW][C]38[/C][C]-0.05163[/C][C]-0.4381[/C][C]0.331315[/C][/ROW]
[ROW][C]39[/C][C]-0.118395[/C][C]-1.0046[/C][C]0.159223[/C][/ROW]
[ROW][C]40[/C][C]-0.11577[/C][C]-0.9823[/C][C]0.164612[/C][/ROW]
[ROW][C]41[/C][C]-0.068005[/C][C]-0.577[/C][C]0.282855[/C][/ROW]
[ROW][C]42[/C][C]-0.03404[/C][C]-0.2888[/C][C]0.386768[/C][/ROW]
[ROW][C]43[/C][C]-0.062649[/C][C]-0.5316[/C][C]0.298322[/C][/ROW]
[ROW][C]44[/C][C]-0.122023[/C][C]-1.0354[/C][C]0.151973[/C][/ROW]
[ROW][C]45[/C][C]-0.153745[/C][C]-1.3046[/C][C]0.098097[/C][/ROW]
[ROW][C]46[/C][C]-0.131204[/C][C]-1.1133[/C][C]0.134641[/C][/ROW]
[ROW][C]47[/C][C]-0.050374[/C][C]-0.4274[/C][C]0.335168[/C][/ROW]
[ROW][C]48[/C][C]0.009661[/C][C]0.082[/C][C]0.467446[/C][/ROW]
[/TABLE]
Source: https://freestatistics.org/blog/index.php?pk=207908&T=1

Globally Unique Identifier (entire table): ba.freestatistics.org/blog/index.php?pk=207908&T=1

As an alternative you can also use a QR Code:  

The GUIDs for individual cells are displayed in the table below:

Autocorrelation Function
Time lag kACF(k)T-STATP-value
10.7848356.65950
20.4696373.9858e-05
30.3153022.67540.004616
40.311672.64460.005017
50.4020463.41150.000532
60.4476293.79830.000151
70.3399792.88480.002582
80.1666961.41450.080768
90.0684580.58090.281565
100.1113010.94440.174056
110.3005862.55060.006441
120.4048923.43560.000492
130.197241.67360.04927
14-0.0832-0.7060.241241
15-0.221473-1.87930.032128
16-0.223545-1.89680.03093
17-0.143404-1.21680.113822
18-0.099044-0.84040.20173
19-0.156558-1.32840.094114
20-0.268562-2.27880.012823
21-0.317435-2.69350.004395
22-0.234348-1.98850.025279
23-0.027971-0.23730.406533
240.1153870.97910.165406
250.0089210.07570.469936
26-0.17077-1.4490.075835
27-0.243253-2.06410.021308
28-0.208484-1.7690.040561
29-0.108767-0.92290.179566
30-0.042532-0.36090.359618
31-0.053681-0.45550.325059
32-0.112866-0.95770.17071
33-0.129319-1.09730.138081
34-0.058029-0.49240.311971
350.0930.78910.216314
360.1894551.60760.056152
370.0937770.79570.214403
38-0.05163-0.43810.331315
39-0.118395-1.00460.159223
40-0.11577-0.98230.164612
41-0.068005-0.5770.282855
42-0.03404-0.28880.386768
43-0.062649-0.53160.298322
44-0.122023-1.03540.151973
45-0.153745-1.30460.098097
46-0.131204-1.11330.134641
47-0.050374-0.42740.335168
480.0096610.0820.467446


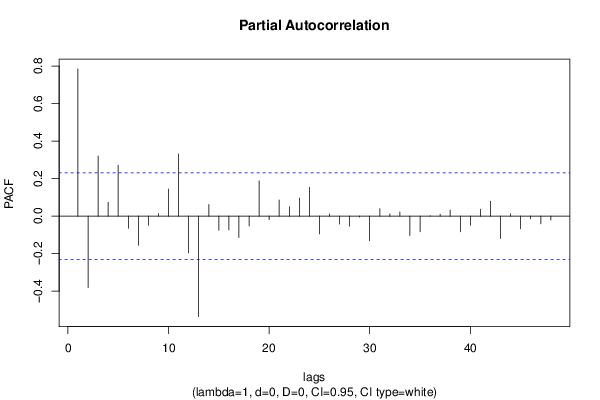
Partial Autocorrelation Function
Time lag kPACF(k)T-STATP-value
10.7848356.65950
2-0.381031-3.23320.000924
30.3208192.72220.004064
40.0741610.62930.265579
50.2711862.30110.012142
6-0.064574-0.54790.292717
7-0.155019-1.31540.096278
8-0.048107-0.40820.34217
90.0144140.12230.451499
100.1449921.23030.111296
110.3311692.81010.003187
12-0.195952-1.66270.05036
13-0.535912-4.54741.1e-05
140.0623160.52880.299296
15-0.075316-0.63910.262399
16-0.073167-0.62080.268331
17-0.113606-0.9640.169143
18-0.052883-0.44870.327489
190.1879531.59480.057564
20-0.018584-0.15770.437572
210.0858830.72870.234262
220.0508750.43170.333628
230.0960890.81530.208783
240.1537071.30430.098151
25-0.09445-0.80140.212758
260.0109660.0930.463063
27-0.042064-0.35690.361095
28-0.053203-0.45140.326514
29-0.005075-0.04310.482885
30-0.131351-1.11460.134374
310.0398050.33780.368265
320.0121560.10310.459067
330.0221220.18770.425814
34-0.103365-0.87710.19168
35-0.082866-0.70310.242119
360.0017360.01470.494145
370.0105750.08970.464374
380.0327820.27820.390842
39-0.083304-0.70690.240967
40-0.048892-0.41490.339737
410.0370510.31440.377068
420.0792620.67260.251689
43-0.11882-1.00820.158363
440.0126550.10740.457393
45-0.067446-0.57230.28445
46-0.014218-0.12060.452155
47-0.041115-0.34890.364101
48-0.020169-0.17110.432296

\begin{tabular}{lllllllll}
\hline
Partial Autocorrelation Function \tabularnewline
Time lag k & PACF(k) & T-STAT & P-value \tabularnewline
1 & 0.784835 & 6.6595 & 0 \tabularnewline
2 & -0.381031 & -3.2332 & 0.000924 \tabularnewline
3 & 0.320819 & 2.7222 & 0.004064 \tabularnewline
4 & 0.074161 & 0.6293 & 0.265579 \tabularnewline
5 & 0.271186 & 2.3011 & 0.012142 \tabularnewline
6 & -0.064574 & -0.5479 & 0.292717 \tabularnewline
7 & -0.155019 & -1.3154 & 0.096278 \tabularnewline
8 & -0.048107 & -0.4082 & 0.34217 \tabularnewline
9 & 0.014414 & 0.1223 & 0.451499 \tabularnewline
10 & 0.144992 & 1.2303 & 0.111296 \tabularnewline
11 & 0.331169 & 2.8101 & 0.003187 \tabularnewline
12 & -0.195952 & -1.6627 & 0.05036 \tabularnewline
13 & -0.535912 & -4.5474 & 1.1e-05 \tabularnewline
14 & 0.062316 & 0.5288 & 0.299296 \tabularnewline
15 & -0.075316 & -0.6391 & 0.262399 \tabularnewline
16 & -0.073167 & -0.6208 & 0.268331 \tabularnewline
17 & -0.113606 & -0.964 & 0.169143 \tabularnewline
18 & -0.052883 & -0.4487 & 0.327489 \tabularnewline
19 & 0.187953 & 1.5948 & 0.057564 \tabularnewline
20 & -0.018584 & -0.1577 & 0.437572 \tabularnewline
21 & 0.085883 & 0.7287 & 0.234262 \tabularnewline
22 & 0.050875 & 0.4317 & 0.333628 \tabularnewline
23 & 0.096089 & 0.8153 & 0.208783 \tabularnewline
24 & 0.153707 & 1.3043 & 0.098151 \tabularnewline
25 & -0.09445 & -0.8014 & 0.212758 \tabularnewline
26 & 0.010966 & 0.093 & 0.463063 \tabularnewline
27 & -0.042064 & -0.3569 & 0.361095 \tabularnewline
28 & -0.053203 & -0.4514 & 0.326514 \tabularnewline
29 & -0.005075 & -0.0431 & 0.482885 \tabularnewline
30 & -0.131351 & -1.1146 & 0.134374 \tabularnewline
31 & 0.039805 & 0.3378 & 0.368265 \tabularnewline
32 & 0.012156 & 0.1031 & 0.459067 \tabularnewline
33 & 0.022122 & 0.1877 & 0.425814 \tabularnewline
34 & -0.103365 & -0.8771 & 0.19168 \tabularnewline
35 & -0.082866 & -0.7031 & 0.242119 \tabularnewline
36 & 0.001736 & 0.0147 & 0.494145 \tabularnewline
37 & 0.010575 & 0.0897 & 0.464374 \tabularnewline
38 & 0.032782 & 0.2782 & 0.390842 \tabularnewline
39 & -0.083304 & -0.7069 & 0.240967 \tabularnewline
40 & -0.048892 & -0.4149 & 0.339737 \tabularnewline
41 & 0.037051 & 0.3144 & 0.377068 \tabularnewline
42 & 0.079262 & 0.6726 & 0.251689 \tabularnewline
43 & -0.11882 & -1.0082 & 0.158363 \tabularnewline
44 & 0.012655 & 0.1074 & 0.457393 \tabularnewline
45 & -0.067446 & -0.5723 & 0.28445 \tabularnewline
46 & -0.014218 & -0.1206 & 0.452155 \tabularnewline
47 & -0.041115 & -0.3489 & 0.364101 \tabularnewline
48 & -0.020169 & -0.1711 & 0.432296 \tabularnewline
\hline
\end{tabular}
%Source: https://freestatistics.org/blog/index.php?pk=207908&T=2

[TABLE]
[ROW][C]Partial Autocorrelation Function[/C][/ROW]
[ROW][C]Time lag k[/C][C]PACF(k)[/C][C]T-STAT[/C][C]P-value[/C][/ROW]
[ROW][C]1[/C][C]0.784835[/C][C]6.6595[/C][C]0[/C][/ROW]
[ROW][C]2[/C][C]-0.381031[/C][C]-3.2332[/C][C]0.000924[/C][/ROW]
[ROW][C]3[/C][C]0.320819[/C][C]2.7222[/C][C]0.004064[/C][/ROW]
[ROW][C]4[/C][C]0.074161[/C][C]0.6293[/C][C]0.265579[/C][/ROW]
[ROW][C]5[/C][C]0.271186[/C][C]2.3011[/C][C]0.012142[/C][/ROW]
[ROW][C]6[/C][C]-0.064574[/C][C]-0.5479[/C][C]0.292717[/C][/ROW]
[ROW][C]7[/C][C]-0.155019[/C][C]-1.3154[/C][C]0.096278[/C][/ROW]
[ROW][C]8[/C][C]-0.048107[/C][C]-0.4082[/C][C]0.34217[/C][/ROW]
[ROW][C]9[/C][C]0.014414[/C][C]0.1223[/C][C]0.451499[/C][/ROW]
[ROW][C]10[/C][C]0.144992[/C][C]1.2303[/C][C]0.111296[/C][/ROW]
[ROW][C]11[/C][C]0.331169[/C][C]2.8101[/C][C]0.003187[/C][/ROW]
[ROW][C]12[/C][C]-0.195952[/C][C]-1.6627[/C][C]0.05036[/C][/ROW]
[ROW][C]13[/C][C]-0.535912[/C][C]-4.5474[/C][C]1.1e-05[/C][/ROW]
[ROW][C]14[/C][C]0.062316[/C][C]0.5288[/C][C]0.299296[/C][/ROW]
[ROW][C]15[/C][C]-0.075316[/C][C]-0.6391[/C][C]0.262399[/C][/ROW]
[ROW][C]16[/C][C]-0.073167[/C][C]-0.6208[/C][C]0.268331[/C][/ROW]
[ROW][C]17[/C][C]-0.113606[/C][C]-0.964[/C][C]0.169143[/C][/ROW]
[ROW][C]18[/C][C]-0.052883[/C][C]-0.4487[/C][C]0.327489[/C][/ROW]
[ROW][C]19[/C][C]0.187953[/C][C]1.5948[/C][C]0.057564[/C][/ROW]
[ROW][C]20[/C][C]-0.018584[/C][C]-0.1577[/C][C]0.437572[/C][/ROW]
[ROW][C]21[/C][C]0.085883[/C][C]0.7287[/C][C]0.234262[/C][/ROW]
[ROW][C]22[/C][C]0.050875[/C][C]0.4317[/C][C]0.333628[/C][/ROW]
[ROW][C]23[/C][C]0.096089[/C][C]0.8153[/C][C]0.208783[/C][/ROW]
[ROW][C]24[/C][C]0.153707[/C][C]1.3043[/C][C]0.098151[/C][/ROW]
[ROW][C]25[/C][C]-0.09445[/C][C]-0.8014[/C][C]0.212758[/C][/ROW]
[ROW][C]26[/C][C]0.010966[/C][C]0.093[/C][C]0.463063[/C][/ROW]
[ROW][C]27[/C][C]-0.042064[/C][C]-0.3569[/C][C]0.361095[/C][/ROW]
[ROW][C]28[/C][C]-0.053203[/C][C]-0.4514[/C][C]0.326514[/C][/ROW]
[ROW][C]29[/C][C]-0.005075[/C][C]-0.0431[/C][C]0.482885[/C][/ROW]
[ROW][C]30[/C][C]-0.131351[/C][C]-1.1146[/C][C]0.134374[/C][/ROW]
[ROW][C]31[/C][C]0.039805[/C][C]0.3378[/C][C]0.368265[/C][/ROW]
[ROW][C]32[/C][C]0.012156[/C][C]0.1031[/C][C]0.459067[/C][/ROW]
[ROW][C]33[/C][C]0.022122[/C][C]0.1877[/C][C]0.425814[/C][/ROW]
[ROW][C]34[/C][C]-0.103365[/C][C]-0.8771[/C][C]0.19168[/C][/ROW]
[ROW][C]35[/C][C]-0.082866[/C][C]-0.7031[/C][C]0.242119[/C][/ROW]
[ROW][C]36[/C][C]0.001736[/C][C]0.0147[/C][C]0.494145[/C][/ROW]
[ROW][C]37[/C][C]0.010575[/C][C]0.0897[/C][C]0.464374[/C][/ROW]
[ROW][C]38[/C][C]0.032782[/C][C]0.2782[/C][C]0.390842[/C][/ROW]
[ROW][C]39[/C][C]-0.083304[/C][C]-0.7069[/C][C]0.240967[/C][/ROW]
[ROW][C]40[/C][C]-0.048892[/C][C]-0.4149[/C][C]0.339737[/C][/ROW]
[ROW][C]41[/C][C]0.037051[/C][C]0.3144[/C][C]0.377068[/C][/ROW]
[ROW][C]42[/C][C]0.079262[/C][C]0.6726[/C][C]0.251689[/C][/ROW]
[ROW][C]43[/C][C]-0.11882[/C][C]-1.0082[/C][C]0.158363[/C][/ROW]
[ROW][C]44[/C][C]0.012655[/C][C]0.1074[/C][C]0.457393[/C][/ROW]
[ROW][C]45[/C][C]-0.067446[/C][C]-0.5723[/C][C]0.28445[/C][/ROW]
[ROW][C]46[/C][C]-0.014218[/C][C]-0.1206[/C][C]0.452155[/C][/ROW]
[ROW][C]47[/C][C]-0.041115[/C][C]-0.3489[/C][C]0.364101[/C][/ROW]
[ROW][C]48[/C][C]-0.020169[/C][C]-0.1711[/C][C]0.432296[/C][/ROW]
[/TABLE]
Source: https://freestatistics.org/blog/index.php?pk=207908&T=2

Globally Unique Identifier (entire table): ba.freestatistics.org/blog/index.php?pk=207908&T=2

As an alternative you can also use a QR Code:  

The GUIDs for individual cells are displayed in the table below:

Partial Autocorrelation Function
Time lag kPACF(k)T-STATP-value
10.7848356.65950
2-0.381031-3.23320.000924
30.3208192.72220.004064
40.0741610.62930.265579
50.2711862.30110.012142
6-0.064574-0.54790.292717
7-0.155019-1.31540.096278
8-0.048107-0.40820.34217
90.0144140.12230.451499
100.1449921.23030.111296
110.3311692.81010.003187
12-0.195952-1.66270.05036
13-0.535912-4.54741.1e-05
140.0623160.52880.299296
15-0.075316-0.63910.262399
16-0.073167-0.62080.268331
17-0.113606-0.9640.169143
18-0.052883-0.44870.327489
190.1879531.59480.057564
20-0.018584-0.15770.437572
210.0858830.72870.234262
220.0508750.43170.333628
230.0960890.81530.208783
240.1537071.30430.098151
25-0.09445-0.80140.212758
260.0109660.0930.463063
27-0.042064-0.35690.361095
28-0.053203-0.45140.326514
29-0.005075-0.04310.482885
30-0.131351-1.11460.134374
310.0398050.33780.368265
320.0121560.10310.459067
330.0221220.18770.425814
34-0.103365-0.87710.19168
35-0.082866-0.70310.242119
360.0017360.01470.494145
370.0105750.08970.464374
380.0327820.27820.390842
39-0.083304-0.70690.240967
40-0.048892-0.41490.339737
410.0370510.31440.377068
420.0792620.67260.251689
43-0.11882-1.00820.158363
440.0126550.10740.457393
45-0.067446-0.57230.28445
46-0.014218-0.12060.452155
47-0.041115-0.34890.364101
48-0.020169-0.17110.432296


Parameters (Session):
par1 = 48 ; par2 = 1 ; par3 = 0 ; par4 = 0 ; par5 = 12 ; par6 = White Noise ; par7 = 0.95 ;
Parameters (R input):
par1 = 48 ; par2 = 1 ; par3 = 0 ; par4 = 0 ; par5 = 12 ; par6 = White Noise ; par7 = 0.95 ; par8 = ;
R code (references can be found in the software module):
if (par1 == 'Default') {
par1 = 10*log10(length(x))
} else {
par1 <- as.numeric(par1)
}
par2 <- as.numeric(par2)
par3 <- as.numeric(par3)
par4 <- as.numeric(par4)
par5 <- as.numeric(par5)
if (par6 == 'White Noise') par6 <- 'white' else par6 <- 'ma'
par7 <- as.numeric(par7)
if (par8 != '') par8 <- as.numeric(par8)
ox <- x
if (par8 == '') {
if (par2 == 0) {
x <- log(x)
} else {
x <- (x ^ par2 - 1) / par2
}
} else {
x <- log(x,base=par8)
}
if (par3 > 0) x <- diff(x,lag=1,difference=par3)
if (par4 > 0) x <- diff(x,lag=par5,difference=par4)
bitmap(file='picts.png')
op <- par(mfrow=c(2,1))
plot(ox,type='l',main='Original Time Series',xlab='time',ylab='value')
if (par8=='') {
mytitle <- paste('Working Time Series (lambda=',par2,', d=',par3,', D=',par4,')',sep='')
mysub <- paste('(lambda=',par2,', d=',par3,', D=',par4,', CI=', par7, ', CI type=',par6,')',sep='')
} else {
mytitle <- paste('Working Time Series (base=',par8,', d=',par3,', D=',par4,')',sep='')
mysub <- paste('(base=',par8,', d=',par3,', D=',par4,', CI=', par7, ', CI type=',par6,')',sep='')
}
plot(x,type='l', main=mytitle,xlab='time',ylab='value')
par(op)
dev.off()
bitmap(file='pic1.png')
racf <- acf(x, par1, main='Autocorrelation', xlab='time lag', ylab='ACF', ci.type=par6, ci=par7, sub=mysub)
dev.off()
bitmap(file='pic2.png')
rpacf <- pacf(x,par1,main='Partial Autocorrelation',xlab='lags',ylab='PACF',sub=mysub)
dev.off()
(myacf <- c(racf$acf))
(mypacf <- c(rpacf$acf))
lengthx <- length(x)
sqrtn <- sqrt(lengthx)
load(file='createtable')
a<-table.start()
a<-table.row.start(a)
a<-table.element(a,'Autocorrelation Function',4,TRUE)
a<-table.row.end(a)
a<-table.row.start(a)
a<-table.element(a,'Time lag k',header=TRUE)
a<-table.element(a,hyperlink('basics.htm','ACF(k)','click here for more information about the Autocorrelation Function'),header=TRUE)
a<-table.element(a,'T-STAT',header=TRUE)
a<-table.element(a,'P-value',header=TRUE)
a<-table.row.end(a)
for (i in 2:(par1+1)) {
a<-table.row.start(a)
a<-table.element(a,i-1,header=TRUE)
a<-table.element(a,round(myacf[i],6))
mytstat <- myacf[i]*sqrtn
a<-table.element(a,round(mytstat,4))
a<-table.element(a,round(1-pt(abs(mytstat),lengthx),6))
a<-table.row.end(a)
}
a<-table.end(a)
table.save(a,file='mytable.tab')
a<-table.start()
a<-table.row.start(a)
a<-table.element(a,'Partial Autocorrelation Function',4,TRUE)
a<-table.row.end(a)
a<-table.row.start(a)
a<-table.element(a,'Time lag k',header=TRUE)
a<-table.element(a,hyperlink('basics.htm','PACF(k)','click here for more information about the Partial Autocorrelation Function'),header=TRUE)
a<-table.element(a,'T-STAT',header=TRUE)
a<-table.element(a,'P-value',header=TRUE)
a<-table.row.end(a)
for (i in 1:par1) {
a<-table.row.start(a)
a<-table.element(a,i,header=TRUE)
a<-table.element(a,round(mypacf[i],6))
mytstat <- mypacf[i]*sqrtn
a<-table.element(a,round(mytstat,4))
a<-table.element(a,round(1-pt(abs(mytstat),lengthx),6))
a<-table.row.end(a)
}
a<-table.end(a)
table.save(a,file='mytable1.tab')