Free Statistics

of Irreproducible Research!

Author's title

Author*Unverified author*
R Software Modulerwasp_autocorrelation.wasp
Title produced by software(Partial) Autocorrelation Function
Date of computationTue, 19 Mar 2013 11:23:59 -0400
Cite this page as followsStatistical Computations at FreeStatistics.org, Office for Research Development and Education, URL https://freestatistics.org/blog/index.php?v=date/2013/Mar/19/t13637066598pcnwwemvgj6chj.htm/, Retrieved Sun, 28 Apr 2024 17:29:22 +0000
Statistical Computations at FreeStatistics.org, Office for Research Development and Education, URL https://freestatistics.org/blog/index.php?pk=207909, Retrieved Sun, 28 Apr 2024 17:29:22 +0000
QR Codes:

Original text written by user:
IsPrivate?No (this computation is public)
User-defined keywords
Estimated Impact99
Family? (F = Feedback message, R = changed R code, M = changed R Module, P = changed Parameters, D = changed Data)
-       [(Partial) Autocorrelation Function] [] [2013-03-19 15:23:59] [4cc5e8551edf7d1152616a4a3a38c365] [Current]
Feedback Forum

Post a new message
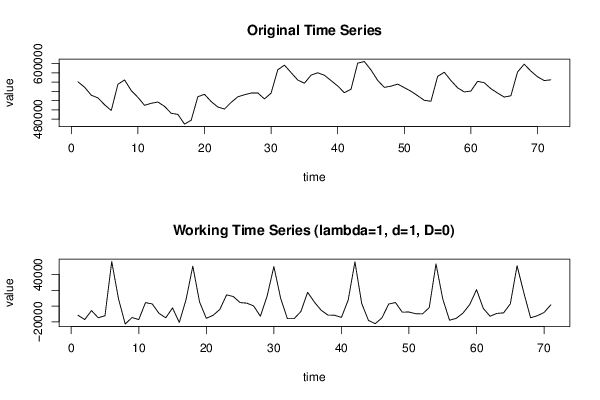
Dataseries X:
560576
548854
531673
525919
511038
498662
555362
564591
541657
527070
509846
514258
516922
507561
492622
490243
469357
477580
528379
533590
517945
506174
501866
516141
528222
532638
536322
536535
523597
536214
586570
596594
580523
564478
557560
575093
580112
574761
563250
551531
537034
544686
600991
604378
586111
563668
548604
551174
555654
547970
540324
530577
520579
518654
572273
581302
563280
547612
538712
540735
561649
558685
545732
536352
527676
530455
581744
598714
583775
571477
563278
564872


Summary of computational transaction
Raw Inputview raw input (R code)
Raw Outputview raw output of R engine
Computing time2 seconds
R Server'Gwilym Jenkins' @ jenkins.wessa.net

\begin{tabular}{lllllllll}
\hline
Summary of computational transaction \tabularnewline
Raw Input & view raw input (R code)  \tabularnewline
Raw Output & view raw output of R engine  \tabularnewline
Computing time & 2 seconds \tabularnewline
R Server & 'Gwilym Jenkins' @ jenkins.wessa.net \tabularnewline
\hline
\end{tabular}
%Source: https://freestatistics.org/blog/index.php?pk=207909&T=0

[TABLE]
[ROW][C]Summary of computational transaction[/C][/ROW]
[ROW][C]Raw Input[/C][C]view raw input (R code) [/C][/ROW]
[ROW][C]Raw Output[/C][C]view raw output of R engine [/C][/ROW]
[ROW][C]Computing time[/C][C]2 seconds[/C][/ROW]
[ROW][C]R Server[/C][C]'Gwilym Jenkins' @ jenkins.wessa.net[/C][/ROW]
[/TABLE]
Source: https://freestatistics.org/blog/index.php?pk=207909&T=0

Globally Unique Identifier (entire table): ba.freestatistics.org/blog/index.php?pk=207909&T=0

As an alternative you can also use a QR Code:  

The GUIDs for individual cells are displayed in the table below:

Summary of computational transaction
Raw Inputview raw input (R code)
Raw Outputview raw output of R engine
Computing time2 seconds
R Server'Gwilym Jenkins' @ jenkins.wessa.net


Autocorrelation Function
Time lag kACF(k)T-STATP-value
10.2470542.08170.020487
2-0.379485-3.19760.001035
3-0.365609-3.08070.001469
4-0.226878-1.91170.029975
50.1276351.07550.142902
60.3705383.12220.001298
70.1530581.28970.100672
8-0.171527-1.44530.076385
9-0.334797-2.82110.003101
10-0.34882-2.93920.002218
110.1974791.6640.050262
120.7586626.39260
130.1809121.52440.065927
14-0.336878-2.83860.002952
15-0.335803-2.82950.003028
16-0.197501-1.66420.050243
170.087090.73380.232733
180.2535172.13620.018057
190.1252251.05520.147463
20-0.148717-1.25310.107139
21-0.315123-2.65530.004888
22-0.297456-2.50640.007244
230.1352951.140.129056
240.5917394.98612e-06
250.173861.4650.073671
26-0.26985-2.27380.013002
27-0.273643-2.30580.012024
28-0.161381-1.35980.089095
290.0745150.62790.26605
300.1975711.66480.050184
310.1144680.96450.169028
32-0.103243-0.86990.193633
33-0.208488-1.75680.041636
34-0.194943-1.64260.052442
350.1150420.96940.167828
360.4590253.86780.00012
370.1357171.14360.128322
38-0.185836-1.56590.060912
39-0.170874-1.43980.077159
40-0.111403-0.93870.175534
410.0359220.30270.381509
420.1539381.29710.099397
430.081350.68550.24764
44-0.06465-0.54480.293816
45-0.115246-0.97110.167402
46-0.126728-1.06780.144607
470.0515080.4340.332797
480.3060122.57850.005999

\begin{tabular}{lllllllll}
\hline
Autocorrelation Function \tabularnewline
Time lag k & ACF(k) & T-STAT & P-value \tabularnewline
1 & 0.247054 & 2.0817 & 0.020487 \tabularnewline
2 & -0.379485 & -3.1976 & 0.001035 \tabularnewline
3 & -0.365609 & -3.0807 & 0.001469 \tabularnewline
4 & -0.226878 & -1.9117 & 0.029975 \tabularnewline
5 & 0.127635 & 1.0755 & 0.142902 \tabularnewline
6 & 0.370538 & 3.1222 & 0.001298 \tabularnewline
7 & 0.153058 & 1.2897 & 0.100672 \tabularnewline
8 & -0.171527 & -1.4453 & 0.076385 \tabularnewline
9 & -0.334797 & -2.8211 & 0.003101 \tabularnewline
10 & -0.34882 & -2.9392 & 0.002218 \tabularnewline
11 & 0.197479 & 1.664 & 0.050262 \tabularnewline
12 & 0.758662 & 6.3926 & 0 \tabularnewline
13 & 0.180912 & 1.5244 & 0.065927 \tabularnewline
14 & -0.336878 & -2.8386 & 0.002952 \tabularnewline
15 & -0.335803 & -2.8295 & 0.003028 \tabularnewline
16 & -0.197501 & -1.6642 & 0.050243 \tabularnewline
17 & 0.08709 & 0.7338 & 0.232733 \tabularnewline
18 & 0.253517 & 2.1362 & 0.018057 \tabularnewline
19 & 0.125225 & 1.0552 & 0.147463 \tabularnewline
20 & -0.148717 & -1.2531 & 0.107139 \tabularnewline
21 & -0.315123 & -2.6553 & 0.004888 \tabularnewline
22 & -0.297456 & -2.5064 & 0.007244 \tabularnewline
23 & 0.135295 & 1.14 & 0.129056 \tabularnewline
24 & 0.591739 & 4.9861 & 2e-06 \tabularnewline
25 & 0.17386 & 1.465 & 0.073671 \tabularnewline
26 & -0.26985 & -2.2738 & 0.013002 \tabularnewline
27 & -0.273643 & -2.3058 & 0.012024 \tabularnewline
28 & -0.161381 & -1.3598 & 0.089095 \tabularnewline
29 & 0.074515 & 0.6279 & 0.26605 \tabularnewline
30 & 0.197571 & 1.6648 & 0.050184 \tabularnewline
31 & 0.114468 & 0.9645 & 0.169028 \tabularnewline
32 & -0.103243 & -0.8699 & 0.193633 \tabularnewline
33 & -0.208488 & -1.7568 & 0.041636 \tabularnewline
34 & -0.194943 & -1.6426 & 0.052442 \tabularnewline
35 & 0.115042 & 0.9694 & 0.167828 \tabularnewline
36 & 0.459025 & 3.8678 & 0.00012 \tabularnewline
37 & 0.135717 & 1.1436 & 0.128322 \tabularnewline
38 & -0.185836 & -1.5659 & 0.060912 \tabularnewline
39 & -0.170874 & -1.4398 & 0.077159 \tabularnewline
40 & -0.111403 & -0.9387 & 0.175534 \tabularnewline
41 & 0.035922 & 0.3027 & 0.381509 \tabularnewline
42 & 0.153938 & 1.2971 & 0.099397 \tabularnewline
43 & 0.08135 & 0.6855 & 0.24764 \tabularnewline
44 & -0.06465 & -0.5448 & 0.293816 \tabularnewline
45 & -0.115246 & -0.9711 & 0.167402 \tabularnewline
46 & -0.126728 & -1.0678 & 0.144607 \tabularnewline
47 & 0.051508 & 0.434 & 0.332797 \tabularnewline
48 & 0.306012 & 2.5785 & 0.005999 \tabularnewline
\hline
\end{tabular}
%Source: https://freestatistics.org/blog/index.php?pk=207909&T=1

[TABLE]
[ROW][C]Autocorrelation Function[/C][/ROW]
[ROW][C]Time lag k[/C][C]ACF(k)[/C][C]T-STAT[/C][C]P-value[/C][/ROW]
[ROW][C]1[/C][C]0.247054[/C][C]2.0817[/C][C]0.020487[/C][/ROW]
[ROW][C]2[/C][C]-0.379485[/C][C]-3.1976[/C][C]0.001035[/C][/ROW]
[ROW][C]3[/C][C]-0.365609[/C][C]-3.0807[/C][C]0.001469[/C][/ROW]
[ROW][C]4[/C][C]-0.226878[/C][C]-1.9117[/C][C]0.029975[/C][/ROW]
[ROW][C]5[/C][C]0.127635[/C][C]1.0755[/C][C]0.142902[/C][/ROW]
[ROW][C]6[/C][C]0.370538[/C][C]3.1222[/C][C]0.001298[/C][/ROW]
[ROW][C]7[/C][C]0.153058[/C][C]1.2897[/C][C]0.100672[/C][/ROW]
[ROW][C]8[/C][C]-0.171527[/C][C]-1.4453[/C][C]0.076385[/C][/ROW]
[ROW][C]9[/C][C]-0.334797[/C][C]-2.8211[/C][C]0.003101[/C][/ROW]
[ROW][C]10[/C][C]-0.34882[/C][C]-2.9392[/C][C]0.002218[/C][/ROW]
[ROW][C]11[/C][C]0.197479[/C][C]1.664[/C][C]0.050262[/C][/ROW]
[ROW][C]12[/C][C]0.758662[/C][C]6.3926[/C][C]0[/C][/ROW]
[ROW][C]13[/C][C]0.180912[/C][C]1.5244[/C][C]0.065927[/C][/ROW]
[ROW][C]14[/C][C]-0.336878[/C][C]-2.8386[/C][C]0.002952[/C][/ROW]
[ROW][C]15[/C][C]-0.335803[/C][C]-2.8295[/C][C]0.003028[/C][/ROW]
[ROW][C]16[/C][C]-0.197501[/C][C]-1.6642[/C][C]0.050243[/C][/ROW]
[ROW][C]17[/C][C]0.08709[/C][C]0.7338[/C][C]0.232733[/C][/ROW]
[ROW][C]18[/C][C]0.253517[/C][C]2.1362[/C][C]0.018057[/C][/ROW]
[ROW][C]19[/C][C]0.125225[/C][C]1.0552[/C][C]0.147463[/C][/ROW]
[ROW][C]20[/C][C]-0.148717[/C][C]-1.2531[/C][C]0.107139[/C][/ROW]
[ROW][C]21[/C][C]-0.315123[/C][C]-2.6553[/C][C]0.004888[/C][/ROW]
[ROW][C]22[/C][C]-0.297456[/C][C]-2.5064[/C][C]0.007244[/C][/ROW]
[ROW][C]23[/C][C]0.135295[/C][C]1.14[/C][C]0.129056[/C][/ROW]
[ROW][C]24[/C][C]0.591739[/C][C]4.9861[/C][C]2e-06[/C][/ROW]
[ROW][C]25[/C][C]0.17386[/C][C]1.465[/C][C]0.073671[/C][/ROW]
[ROW][C]26[/C][C]-0.26985[/C][C]-2.2738[/C][C]0.013002[/C][/ROW]
[ROW][C]27[/C][C]-0.273643[/C][C]-2.3058[/C][C]0.012024[/C][/ROW]
[ROW][C]28[/C][C]-0.161381[/C][C]-1.3598[/C][C]0.089095[/C][/ROW]
[ROW][C]29[/C][C]0.074515[/C][C]0.6279[/C][C]0.26605[/C][/ROW]
[ROW][C]30[/C][C]0.197571[/C][C]1.6648[/C][C]0.050184[/C][/ROW]
[ROW][C]31[/C][C]0.114468[/C][C]0.9645[/C][C]0.169028[/C][/ROW]
[ROW][C]32[/C][C]-0.103243[/C][C]-0.8699[/C][C]0.193633[/C][/ROW]
[ROW][C]33[/C][C]-0.208488[/C][C]-1.7568[/C][C]0.041636[/C][/ROW]
[ROW][C]34[/C][C]-0.194943[/C][C]-1.6426[/C][C]0.052442[/C][/ROW]
[ROW][C]35[/C][C]0.115042[/C][C]0.9694[/C][C]0.167828[/C][/ROW]
[ROW][C]36[/C][C]0.459025[/C][C]3.8678[/C][C]0.00012[/C][/ROW]
[ROW][C]37[/C][C]0.135717[/C][C]1.1436[/C][C]0.128322[/C][/ROW]
[ROW][C]38[/C][C]-0.185836[/C][C]-1.5659[/C][C]0.060912[/C][/ROW]
[ROW][C]39[/C][C]-0.170874[/C][C]-1.4398[/C][C]0.077159[/C][/ROW]
[ROW][C]40[/C][C]-0.111403[/C][C]-0.9387[/C][C]0.175534[/C][/ROW]
[ROW][C]41[/C][C]0.035922[/C][C]0.3027[/C][C]0.381509[/C][/ROW]
[ROW][C]42[/C][C]0.153938[/C][C]1.2971[/C][C]0.099397[/C][/ROW]
[ROW][C]43[/C][C]0.08135[/C][C]0.6855[/C][C]0.24764[/C][/ROW]
[ROW][C]44[/C][C]-0.06465[/C][C]-0.5448[/C][C]0.293816[/C][/ROW]
[ROW][C]45[/C][C]-0.115246[/C][C]-0.9711[/C][C]0.167402[/C][/ROW]
[ROW][C]46[/C][C]-0.126728[/C][C]-1.0678[/C][C]0.144607[/C][/ROW]
[ROW][C]47[/C][C]0.051508[/C][C]0.434[/C][C]0.332797[/C][/ROW]
[ROW][C]48[/C][C]0.306012[/C][C]2.5785[/C][C]0.005999[/C][/ROW]
[/TABLE]
Source: https://freestatistics.org/blog/index.php?pk=207909&T=1

Globally Unique Identifier (entire table): ba.freestatistics.org/blog/index.php?pk=207909&T=1

As an alternative you can also use a QR Code:  

The GUIDs for individual cells are displayed in the table below:

Autocorrelation Function
Time lag kACF(k)T-STATP-value
10.2470542.08170.020487
2-0.379485-3.19760.001035
3-0.365609-3.08070.001469
4-0.226878-1.91170.029975
50.1276351.07550.142902
60.3705383.12220.001298
70.1530581.28970.100672
8-0.171527-1.44530.076385
9-0.334797-2.82110.003101
10-0.34882-2.93920.002218
110.1974791.6640.050262
120.7586626.39260
130.1809121.52440.065927
14-0.336878-2.83860.002952
15-0.335803-2.82950.003028
16-0.197501-1.66420.050243
170.087090.73380.232733
180.2535172.13620.018057
190.1252251.05520.147463
20-0.148717-1.25310.107139
21-0.315123-2.65530.004888
22-0.297456-2.50640.007244
230.1352951.140.129056
240.5917394.98612e-06
250.173861.4650.073671
26-0.26985-2.27380.013002
27-0.273643-2.30580.012024
28-0.161381-1.35980.089095
290.0745150.62790.26605
300.1975711.66480.050184
310.1144680.96450.169028
32-0.103243-0.86990.193633
33-0.208488-1.75680.041636
34-0.194943-1.64260.052442
350.1150420.96940.167828
360.4590253.86780.00012
370.1357171.14360.128322
38-0.185836-1.56590.060912
39-0.170874-1.43980.077159
40-0.111403-0.93870.175534
410.0359220.30270.381509
420.1539381.29710.099397
430.081350.68550.24764
44-0.06465-0.54480.293816
45-0.115246-0.97110.167402
46-0.126728-1.06780.144607
470.0515080.4340.332797
480.3060122.57850.005999


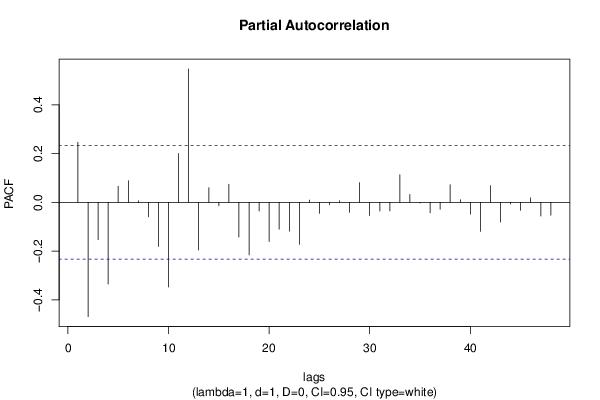
Partial Autocorrelation Function
Time lag kPACF(k)T-STATP-value
10.2470542.08170.020487
2-0.469156-3.95329e-05
3-0.152896-1.28830.100909
4-0.335033-2.8230.003084
50.0660830.55680.2897
60.0889790.74980.22794
70.006450.05430.478405
8-0.059042-0.49750.310188
9-0.181178-1.52660.065647
10-0.347825-2.93080.002272
110.2007591.69160.047551
120.5478624.61648e-06
13-0.195015-1.64320.052379
140.0604080.5090.306163
15-0.013844-0.11660.453734
160.074740.62980.265433
17-0.142442-1.20020.117018
18-0.21564-1.8170.036717
19-0.035157-0.29620.383956
20-0.160437-1.35190.090354
21-0.109943-0.92640.178689
22-0.118183-0.99580.161358
23-0.172478-1.45330.07527
240.009210.07760.469179
25-0.04503-0.37940.352751
26-0.010044-0.08460.466396
270.0068070.05740.477212
28-0.040966-0.34520.365488
290.0813070.68510.247755
30-0.054076-0.45570.325016
31-0.035556-0.29960.382678
32-0.035044-0.29530.384317
330.1134850.95620.171098
340.0324250.27320.39274
35-0.002317-0.01950.492239
36-0.042461-0.35780.360783
37-0.027932-0.23540.407303
380.072340.60960.272053
390.0105850.08920.46459
40-0.048366-0.40750.342418
41-0.119191-1.00430.159318
420.0687940.57970.281987
43-0.080304-0.67670.250412
44-0.006175-0.0520.479326
45-0.032788-0.27630.391568
460.0186620.15720.437749
47-0.056111-0.47280.318905
48-0.052331-0.4410.330294

\begin{tabular}{lllllllll}
\hline
Partial Autocorrelation Function \tabularnewline
Time lag k & PACF(k) & T-STAT & P-value \tabularnewline
1 & 0.247054 & 2.0817 & 0.020487 \tabularnewline
2 & -0.469156 & -3.9532 & 9e-05 \tabularnewline
3 & -0.152896 & -1.2883 & 0.100909 \tabularnewline
4 & -0.335033 & -2.823 & 0.003084 \tabularnewline
5 & 0.066083 & 0.5568 & 0.2897 \tabularnewline
6 & 0.088979 & 0.7498 & 0.22794 \tabularnewline
7 & 0.00645 & 0.0543 & 0.478405 \tabularnewline
8 & -0.059042 & -0.4975 & 0.310188 \tabularnewline
9 & -0.181178 & -1.5266 & 0.065647 \tabularnewline
10 & -0.347825 & -2.9308 & 0.002272 \tabularnewline
11 & 0.200759 & 1.6916 & 0.047551 \tabularnewline
12 & 0.547862 & 4.6164 & 8e-06 \tabularnewline
13 & -0.195015 & -1.6432 & 0.052379 \tabularnewline
14 & 0.060408 & 0.509 & 0.306163 \tabularnewline
15 & -0.013844 & -0.1166 & 0.453734 \tabularnewline
16 & 0.07474 & 0.6298 & 0.265433 \tabularnewline
17 & -0.142442 & -1.2002 & 0.117018 \tabularnewline
18 & -0.21564 & -1.817 & 0.036717 \tabularnewline
19 & -0.035157 & -0.2962 & 0.383956 \tabularnewline
20 & -0.160437 & -1.3519 & 0.090354 \tabularnewline
21 & -0.109943 & -0.9264 & 0.178689 \tabularnewline
22 & -0.118183 & -0.9958 & 0.161358 \tabularnewline
23 & -0.172478 & -1.4533 & 0.07527 \tabularnewline
24 & 0.00921 & 0.0776 & 0.469179 \tabularnewline
25 & -0.04503 & -0.3794 & 0.352751 \tabularnewline
26 & -0.010044 & -0.0846 & 0.466396 \tabularnewline
27 & 0.006807 & 0.0574 & 0.477212 \tabularnewline
28 & -0.040966 & -0.3452 & 0.365488 \tabularnewline
29 & 0.081307 & 0.6851 & 0.247755 \tabularnewline
30 & -0.054076 & -0.4557 & 0.325016 \tabularnewline
31 & -0.035556 & -0.2996 & 0.382678 \tabularnewline
32 & -0.035044 & -0.2953 & 0.384317 \tabularnewline
33 & 0.113485 & 0.9562 & 0.171098 \tabularnewline
34 & 0.032425 & 0.2732 & 0.39274 \tabularnewline
35 & -0.002317 & -0.0195 & 0.492239 \tabularnewline
36 & -0.042461 & -0.3578 & 0.360783 \tabularnewline
37 & -0.027932 & -0.2354 & 0.407303 \tabularnewline
38 & 0.07234 & 0.6096 & 0.272053 \tabularnewline
39 & 0.010585 & 0.0892 & 0.46459 \tabularnewline
40 & -0.048366 & -0.4075 & 0.342418 \tabularnewline
41 & -0.119191 & -1.0043 & 0.159318 \tabularnewline
42 & 0.068794 & 0.5797 & 0.281987 \tabularnewline
43 & -0.080304 & -0.6767 & 0.250412 \tabularnewline
44 & -0.006175 & -0.052 & 0.479326 \tabularnewline
45 & -0.032788 & -0.2763 & 0.391568 \tabularnewline
46 & 0.018662 & 0.1572 & 0.437749 \tabularnewline
47 & -0.056111 & -0.4728 & 0.318905 \tabularnewline
48 & -0.052331 & -0.441 & 0.330294 \tabularnewline
\hline
\end{tabular}
%Source: https://freestatistics.org/blog/index.php?pk=207909&T=2

[TABLE]
[ROW][C]Partial Autocorrelation Function[/C][/ROW]
[ROW][C]Time lag k[/C][C]PACF(k)[/C][C]T-STAT[/C][C]P-value[/C][/ROW]
[ROW][C]1[/C][C]0.247054[/C][C]2.0817[/C][C]0.020487[/C][/ROW]
[ROW][C]2[/C][C]-0.469156[/C][C]-3.9532[/C][C]9e-05[/C][/ROW]
[ROW][C]3[/C][C]-0.152896[/C][C]-1.2883[/C][C]0.100909[/C][/ROW]
[ROW][C]4[/C][C]-0.335033[/C][C]-2.823[/C][C]0.003084[/C][/ROW]
[ROW][C]5[/C][C]0.066083[/C][C]0.5568[/C][C]0.2897[/C][/ROW]
[ROW][C]6[/C][C]0.088979[/C][C]0.7498[/C][C]0.22794[/C][/ROW]
[ROW][C]7[/C][C]0.00645[/C][C]0.0543[/C][C]0.478405[/C][/ROW]
[ROW][C]8[/C][C]-0.059042[/C][C]-0.4975[/C][C]0.310188[/C][/ROW]
[ROW][C]9[/C][C]-0.181178[/C][C]-1.5266[/C][C]0.065647[/C][/ROW]
[ROW][C]10[/C][C]-0.347825[/C][C]-2.9308[/C][C]0.002272[/C][/ROW]
[ROW][C]11[/C][C]0.200759[/C][C]1.6916[/C][C]0.047551[/C][/ROW]
[ROW][C]12[/C][C]0.547862[/C][C]4.6164[/C][C]8e-06[/C][/ROW]
[ROW][C]13[/C][C]-0.195015[/C][C]-1.6432[/C][C]0.052379[/C][/ROW]
[ROW][C]14[/C][C]0.060408[/C][C]0.509[/C][C]0.306163[/C][/ROW]
[ROW][C]15[/C][C]-0.013844[/C][C]-0.1166[/C][C]0.453734[/C][/ROW]
[ROW][C]16[/C][C]0.07474[/C][C]0.6298[/C][C]0.265433[/C][/ROW]
[ROW][C]17[/C][C]-0.142442[/C][C]-1.2002[/C][C]0.117018[/C][/ROW]
[ROW][C]18[/C][C]-0.21564[/C][C]-1.817[/C][C]0.036717[/C][/ROW]
[ROW][C]19[/C][C]-0.035157[/C][C]-0.2962[/C][C]0.383956[/C][/ROW]
[ROW][C]20[/C][C]-0.160437[/C][C]-1.3519[/C][C]0.090354[/C][/ROW]
[ROW][C]21[/C][C]-0.109943[/C][C]-0.9264[/C][C]0.178689[/C][/ROW]
[ROW][C]22[/C][C]-0.118183[/C][C]-0.9958[/C][C]0.161358[/C][/ROW]
[ROW][C]23[/C][C]-0.172478[/C][C]-1.4533[/C][C]0.07527[/C][/ROW]
[ROW][C]24[/C][C]0.00921[/C][C]0.0776[/C][C]0.469179[/C][/ROW]
[ROW][C]25[/C][C]-0.04503[/C][C]-0.3794[/C][C]0.352751[/C][/ROW]
[ROW][C]26[/C][C]-0.010044[/C][C]-0.0846[/C][C]0.466396[/C][/ROW]
[ROW][C]27[/C][C]0.006807[/C][C]0.0574[/C][C]0.477212[/C][/ROW]
[ROW][C]28[/C][C]-0.040966[/C][C]-0.3452[/C][C]0.365488[/C][/ROW]
[ROW][C]29[/C][C]0.081307[/C][C]0.6851[/C][C]0.247755[/C][/ROW]
[ROW][C]30[/C][C]-0.054076[/C][C]-0.4557[/C][C]0.325016[/C][/ROW]
[ROW][C]31[/C][C]-0.035556[/C][C]-0.2996[/C][C]0.382678[/C][/ROW]
[ROW][C]32[/C][C]-0.035044[/C][C]-0.2953[/C][C]0.384317[/C][/ROW]
[ROW][C]33[/C][C]0.113485[/C][C]0.9562[/C][C]0.171098[/C][/ROW]
[ROW][C]34[/C][C]0.032425[/C][C]0.2732[/C][C]0.39274[/C][/ROW]
[ROW][C]35[/C][C]-0.002317[/C][C]-0.0195[/C][C]0.492239[/C][/ROW]
[ROW][C]36[/C][C]-0.042461[/C][C]-0.3578[/C][C]0.360783[/C][/ROW]
[ROW][C]37[/C][C]-0.027932[/C][C]-0.2354[/C][C]0.407303[/C][/ROW]
[ROW][C]38[/C][C]0.07234[/C][C]0.6096[/C][C]0.272053[/C][/ROW]
[ROW][C]39[/C][C]0.010585[/C][C]0.0892[/C][C]0.46459[/C][/ROW]
[ROW][C]40[/C][C]-0.048366[/C][C]-0.4075[/C][C]0.342418[/C][/ROW]
[ROW][C]41[/C][C]-0.119191[/C][C]-1.0043[/C][C]0.159318[/C][/ROW]
[ROW][C]42[/C][C]0.068794[/C][C]0.5797[/C][C]0.281987[/C][/ROW]
[ROW][C]43[/C][C]-0.080304[/C][C]-0.6767[/C][C]0.250412[/C][/ROW]
[ROW][C]44[/C][C]-0.006175[/C][C]-0.052[/C][C]0.479326[/C][/ROW]
[ROW][C]45[/C][C]-0.032788[/C][C]-0.2763[/C][C]0.391568[/C][/ROW]
[ROW][C]46[/C][C]0.018662[/C][C]0.1572[/C][C]0.437749[/C][/ROW]
[ROW][C]47[/C][C]-0.056111[/C][C]-0.4728[/C][C]0.318905[/C][/ROW]
[ROW][C]48[/C][C]-0.052331[/C][C]-0.441[/C][C]0.330294[/C][/ROW]
[/TABLE]
Source: https://freestatistics.org/blog/index.php?pk=207909&T=2

Globally Unique Identifier (entire table): ba.freestatistics.org/blog/index.php?pk=207909&T=2

As an alternative you can also use a QR Code:  

The GUIDs for individual cells are displayed in the table below:

Partial Autocorrelation Function
Time lag kPACF(k)T-STATP-value
10.2470542.08170.020487
2-0.469156-3.95329e-05
3-0.152896-1.28830.100909
4-0.335033-2.8230.003084
50.0660830.55680.2897
60.0889790.74980.22794
70.006450.05430.478405
8-0.059042-0.49750.310188
9-0.181178-1.52660.065647
10-0.347825-2.93080.002272
110.2007591.69160.047551
120.5478624.61648e-06
13-0.195015-1.64320.052379
140.0604080.5090.306163
15-0.013844-0.11660.453734
160.074740.62980.265433
17-0.142442-1.20020.117018
18-0.21564-1.8170.036717
19-0.035157-0.29620.383956
20-0.160437-1.35190.090354
21-0.109943-0.92640.178689
22-0.118183-0.99580.161358
23-0.172478-1.45330.07527
240.009210.07760.469179
25-0.04503-0.37940.352751
26-0.010044-0.08460.466396
270.0068070.05740.477212
28-0.040966-0.34520.365488
290.0813070.68510.247755
30-0.054076-0.45570.325016
31-0.035556-0.29960.382678
32-0.035044-0.29530.384317
330.1134850.95620.171098
340.0324250.27320.39274
35-0.002317-0.01950.492239
36-0.042461-0.35780.360783
37-0.027932-0.23540.407303
380.072340.60960.272053
390.0105850.08920.46459
40-0.048366-0.40750.342418
41-0.119191-1.00430.159318
420.0687940.57970.281987
43-0.080304-0.67670.250412
44-0.006175-0.0520.479326
45-0.032788-0.27630.391568
460.0186620.15720.437749
47-0.056111-0.47280.318905
48-0.052331-0.4410.330294


Parameters (Session):
par1 = 48 ; par2 = 1 ; par3 = 1 ; par4 = 0 ; par5 = 12 ; par6 = White Noise ; par7 = 0.95 ;
Parameters (R input):
par1 = 48 ; par2 = 1 ; par3 = 1 ; par4 = 0 ; par5 = 12 ; par6 = White Noise ; par7 = 0.95 ; par8 = ;
R code (references can be found in the software module):
if (par1 == 'Default') {
par1 = 10*log10(length(x))
} else {
par1 <- as.numeric(par1)
}
par2 <- as.numeric(par2)
par3 <- as.numeric(par3)
par4 <- as.numeric(par4)
par5 <- as.numeric(par5)
if (par6 == 'White Noise') par6 <- 'white' else par6 <- 'ma'
par7 <- as.numeric(par7)
if (par8 != '') par8 <- as.numeric(par8)
ox <- x
if (par8 == '') {
if (par2 == 0) {
x <- log(x)
} else {
x <- (x ^ par2 - 1) / par2
}
} else {
x <- log(x,base=par8)
}
if (par3 > 0) x <- diff(x,lag=1,difference=par3)
if (par4 > 0) x <- diff(x,lag=par5,difference=par4)
bitmap(file='picts.png')
op <- par(mfrow=c(2,1))
plot(ox,type='l',main='Original Time Series',xlab='time',ylab='value')
if (par8=='') {
mytitle <- paste('Working Time Series (lambda=',par2,', d=',par3,', D=',par4,')',sep='')
mysub <- paste('(lambda=',par2,', d=',par3,', D=',par4,', CI=', par7, ', CI type=',par6,')',sep='')
} else {
mytitle <- paste('Working Time Series (base=',par8,', d=',par3,', D=',par4,')',sep='')
mysub <- paste('(base=',par8,', d=',par3,', D=',par4,', CI=', par7, ', CI type=',par6,')',sep='')
}
plot(x,type='l', main=mytitle,xlab='time',ylab='value')
par(op)
dev.off()
bitmap(file='pic1.png')
racf <- acf(x, par1, main='Autocorrelation', xlab='time lag', ylab='ACF', ci.type=par6, ci=par7, sub=mysub)
dev.off()
bitmap(file='pic2.png')
rpacf <- pacf(x,par1,main='Partial Autocorrelation',xlab='lags',ylab='PACF',sub=mysub)
dev.off()
(myacf <- c(racf$acf))
(mypacf <- c(rpacf$acf))
lengthx <- length(x)
sqrtn <- sqrt(lengthx)
load(file='createtable')
a<-table.start()
a<-table.row.start(a)
a<-table.element(a,'Autocorrelation Function',4,TRUE)
a<-table.row.end(a)
a<-table.row.start(a)
a<-table.element(a,'Time lag k',header=TRUE)
a<-table.element(a,hyperlink('basics.htm','ACF(k)','click here for more information about the Autocorrelation Function'),header=TRUE)
a<-table.element(a,'T-STAT',header=TRUE)
a<-table.element(a,'P-value',header=TRUE)
a<-table.row.end(a)
for (i in 2:(par1+1)) {
a<-table.row.start(a)
a<-table.element(a,i-1,header=TRUE)
a<-table.element(a,round(myacf[i],6))
mytstat <- myacf[i]*sqrtn
a<-table.element(a,round(mytstat,4))
a<-table.element(a,round(1-pt(abs(mytstat),lengthx),6))
a<-table.row.end(a)
}
a<-table.end(a)
table.save(a,file='mytable.tab')
a<-table.start()
a<-table.row.start(a)
a<-table.element(a,'Partial Autocorrelation Function',4,TRUE)
a<-table.row.end(a)
a<-table.row.start(a)
a<-table.element(a,'Time lag k',header=TRUE)
a<-table.element(a,hyperlink('basics.htm','PACF(k)','click here for more information about the Partial Autocorrelation Function'),header=TRUE)
a<-table.element(a,'T-STAT',header=TRUE)
a<-table.element(a,'P-value',header=TRUE)
a<-table.row.end(a)
for (i in 1:par1) {
a<-table.row.start(a)
a<-table.element(a,i,header=TRUE)
a<-table.element(a,round(mypacf[i],6))
mytstat <- mypacf[i]*sqrtn
a<-table.element(a,round(mytstat,4))
a<-table.element(a,round(1-pt(abs(mytstat),lengthx),6))
a<-table.row.end(a)
}
a<-table.end(a)
table.save(a,file='mytable1.tab')