Free Statistics

of Irreproducible Research!

Author's title

Author*The author of this computation has been verified*
R Software Modulerwasp_CARE Data Boxplot.wasp
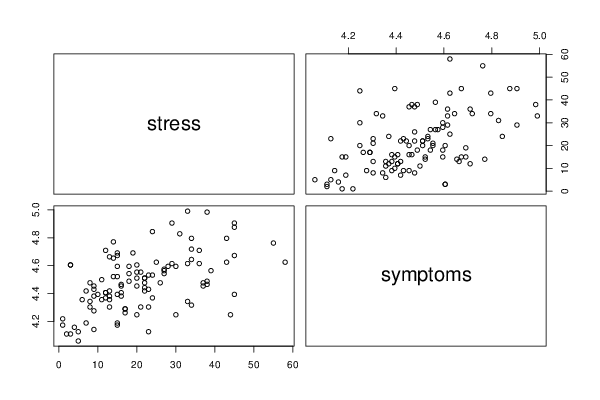
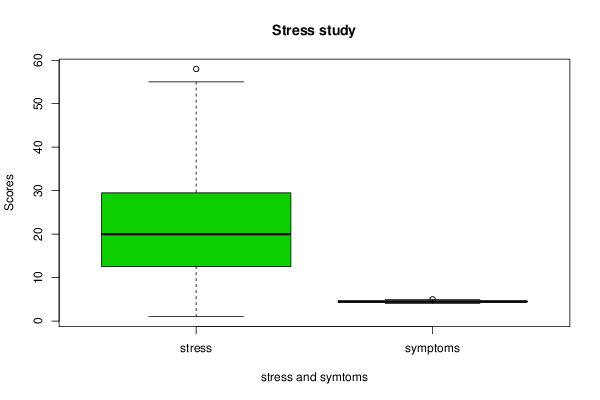
Title produced by softwareCARE Data - Boxplots and Scatterplot Matrix
Date of computationWed, 22 May 2013 06:31:38 -0400
Cite this page as followsStatistical Computations at FreeStatistics.org, Office for Research Development and Education, URL https://freestatistics.org/blog/index.php?v=date/2013/May/22/t1369218720z7mjv25v7ppgplw.htm/, Retrieved Sun, 28 Apr 2024 11:14:44 +0000
Statistical Computations at FreeStatistics.org, Office for Research Development and Education, URL https://freestatistics.org/blog/index.php?pk=209421, Retrieved Sun, 28 Apr 2024 11:14:44 +0000
QR Codes:

Original text written by user:
IsPrivate?No (this computation is public)
User-defined keywords
Estimated Impact81
Family? (F = Feedback message, R = changed R code, M = changed R Module, P = changed Parameters, D = changed Data)
-     [Wilcoxon-Mann-Whitney Test] [] [2013-05-22 09:22:39] [180e044edce56e655340260fe3c965df]
- RMPD    [CARE Data - Boxplots and Scatterplot Matrix] [] [2013-05-22 10:31:38] [0b0dba78d6906383d09f0ee03b825a5b] [Current]
Feedback Forum

Post a new message
Dataseries X:
30	4.59511985
27	4.543294782
9	4.382026635
20	4.248495242
3	4.605170186
15	4.691347882
5	4.127134385
10	4.394449155
23	4.304065093
34	4.795790546
20	4.605170186
17	4.290459441
26	4.477336814
16	4.465908119
17	4.290459441
15	4.17438727
38	4.48863637
16	4.454347296
38	4.983606622
15	4.672828834
5	4.060443011
18	4.48863637
8	4.304065093
33	4.990432587
12	4.406719247
22	4.510859507
23	4.532599493
45	4.875197323
8	4.477336814
45	4.672828834
9	4.143134726
45	4.905274778
21	4.304065093
16	4.406719247
17	4.262679877
31	4.828313737
15	4.189654742
22	4.442651256
14	4.521788577
13	4.304065093
37	4.477336814
23	4.127134385
22	4.510859507
15	4.59511985
43	4.795790546
27	4.564348191
21	4.553876892
36	4.615120517
38	4.465908119
12	4.369447852
1	4.219507705
25	4.624972813
20	4.553876892
11	4.356708827
55	4.762173935
39	4.564348191
24	4.532599493
2	4.110873864
3	4.110873864
16	4.382026635
45	4.394449155
24	4.369447852
12	4.406719247
34	4.718498871
43	4.624972813
18	4.543294782
18	4.59511985
34	4.317488114
29	4.905274778
15	4.394449155
6	4.356708827
58	4.624972813
37	4.454347296
13	4.418840608
12	4.709530201
9	4.276666119
20	4.454347296
29	4.615120517
13	4.382026635
36	4.709530201
33	4.343805422
23	4.430816799
22	4.418840608
1	4.17438727
3	4.605170186
15	4.521788577
13	4.663439094
44	4.248495242
11	4.49980967
20	4.510859507
28	4.59511985
14	4.770684624
7	4.189654742
8	4.343805422
9	4.430816799
33	4.615120517
4	4.158883083
22	4.477336814
7	4.418840608
14	4.65396035
24	4.844187086
13	4.356708827
30	4.248495242
19	4.691347882
34	4.644390899
9	4.454347296
27	4.574710979


Summary of computational transaction
Raw Inputview raw input (R code)
Raw Outputview raw output of R engine
Computing time4 seconds
R Server'Sir Ronald Aylmer Fisher' @ fisher.wessa.net

\begin{tabular}{lllllllll}
\hline
Summary of computational transaction \tabularnewline
Raw Input & view raw input (R code)  \tabularnewline
Raw Output & view raw output of R engine  \tabularnewline
Computing time & 4 seconds \tabularnewline
R Server & 'Sir Ronald Aylmer Fisher' @ fisher.wessa.net \tabularnewline
\hline
\end{tabular}
%Source: https://freestatistics.org/blog/index.php?pk=209421&T=0

[TABLE]
[ROW][C]Summary of computational transaction[/C][/ROW]
[ROW][C]Raw Input[/C][C]view raw input (R code) [/C][/ROW]
[ROW][C]Raw Output[/C][C]view raw output of R engine [/C][/ROW]
[ROW][C]Computing time[/C][C]4 seconds[/C][/ROW]
[ROW][C]R Server[/C][C]'Sir Ronald Aylmer Fisher' @ fisher.wessa.net[/C][/ROW]
[/TABLE]
Source: https://freestatistics.org/blog/index.php?pk=209421&T=0

Globally Unique Identifier (entire table): ba.freestatistics.org/blog/index.php?pk=209421&T=0

As an alternative you can also use a QR Code:  

The GUIDs for individual cells are displayed in the table below:

Summary of computational transaction
Raw Inputview raw input (R code)
Raw Outputview raw output of R engine
Computing time4 seconds
R Server'Sir Ronald Aylmer Fisher' @ fisher.wessa.net


Boxplot statistics
Variablelower whiskerlower hingemedianupper hingeupper whisker
stress112.52029.555
symptoms4.064.3574.4774.614.984

\begin{tabular}{lllllllll}
\hline
Boxplot statistics \tabularnewline
Variable & lower whisker & lower hinge & median & upper hinge & upper whisker \tabularnewline
stress & 1 & 12.5 & 20 & 29.5 & 55 \tabularnewline
symptoms & 4.06 & 4.357 & 4.477 & 4.61 & 4.984 \tabularnewline
\hline
\end{tabular}
%Source: https://freestatistics.org/blog/index.php?pk=209421&T=1

[TABLE]
[ROW][C]Boxplot statistics[/C][/ROW]
[ROW][C]Variable[/C][C]lower whisker[/C][C]lower hinge[/C][C]median[/C][C]upper hinge[/C][C]upper whisker[/C][/ROW]
[ROW][C]stress[/C][C]1[/C][C]12.5[/C][C]20[/C][C]29.5[/C][C]55[/C][/ROW]
[ROW][C]symptoms[/C][C]4.06[/C][C]4.357[/C][C]4.477[/C][C]4.61[/C][C]4.984[/C][/ROW]
[/TABLE]
Source: https://freestatistics.org/blog/index.php?pk=209421&T=1

Globally Unique Identifier (entire table): ba.freestatistics.org/blog/index.php?pk=209421&T=1

As an alternative you can also use a QR Code:  

The GUIDs for individual cells are displayed in the table below:

Boxplot statistics
Variablelower whiskerlower hingemedianupper hingeupper whisker
stress112.52029.555
symptoms4.064.3574.4774.614.984


Boxplot Means
Variabletrimmed meanunbiased SD
stress21.2912.49
symptoms4.4830.2024

\begin{tabular}{lllllllll}
\hline
Boxplot Means \tabularnewline
Variable & trimmed mean & unbiased SD \tabularnewline
stress & 21.29 & 12.49 \tabularnewline
symptoms & 4.483 & 0.2024 \tabularnewline
\hline
\end{tabular}
%Source: https://freestatistics.org/blog/index.php?pk=209421&T=2

[TABLE]
[ROW][C]Boxplot Means[/C][/ROW]
[ROW][C]Variable[/C][C]trimmed mean[/C][C]unbiased SD[/C][/ROW]
[ROW][C]stress[/C][C]21.29[/C][C]12.49[/C][/ROW]
[ROW][C]symptoms[/C][C]4.483[/C][C]0.2024[/C][/ROW]
[/TABLE]
Source: https://freestatistics.org/blog/index.php?pk=209421&T=2

Globally Unique Identifier (entire table): ba.freestatistics.org/blog/index.php?pk=209421&T=2

As an alternative you can also use a QR Code:  

The GUIDs for individual cells are displayed in the table below:

Boxplot Means
Variabletrimmed meanunbiased SD
stress21.2912.49
symptoms4.4830.2024


Parameters (Session):
par1 = two.sided ; par2 = 1 ; par3 = 2 ; par4 = T-Test ; par5 = paired ; par6 = 0.0 ; par7 = 0.95 ; par8 = TRUE ;
Parameters (R input):
par1 = 3 ; par2 = FALSE ; par3 = 0 ;
R code (references can be found in the software module):
par1 <- as.numeric(par1) #colour
par2<- as.logical(par2) # Notches ?
par3<-as.numeric(par3) # % trim
if(par3>45){par3<-45;warning('trim limited to 45%')}
if(par3<0){par3<-0;warning('negative trim makes no sense. Trim is zero.')}
lotrm<-as.integer(length(y[1,])*par3/100)+1
hitrm<-as.integer(length(y[1,])*(100-par3)/100)
y1<-array(dim=c(dim(y)[1], hitrm-lotrm+1), dimnames=list(dimnames(y)[[1]], 1:(hitrm-lotrm+1) ))
for(i in 1:dim(y)[1]){
tmp<-order(y[i,])
y1[i,]<- y[i, tmp[lotrm:hitrm] ]
}
bitmap(file='test2.png')
pairs(t(y))
dev.off()
y<-y1
z <- as.data.frame(t(y))
bitmap(file='test1.png')
(r<-boxplot(z ,xlab=xlab,ylab=ylab,main=main,notch=par2,col=par1))
dev.off()
load(file='createtable')
a<-table.start()
a<-table.row.start(a)
a<-table.element(a,hyperlink('overview.htm','Boxplot statistics','Boxplot overview'),6,TRUE)
a<-table.row.end(a)
a<-table.row.start(a)
a<-table.element(a,'Variable',1,TRUE)
a<-table.element(a,hyperlink('lower_whisker.htm','lower whisker','definition of lower whisker'),1,TRUE)
a<-table.element(a,hyperlink('lower_hinge.htm','lower hinge','definition of lower hinge'),1,TRUE)
a<-table.element(a,hyperlink('central_tendency.htm','median','definitions about measures of central tendency'),1,TRUE)
a<-table.element(a,hyperlink('upper_hinge.htm','upper hinge','definition of upper hinge'),1,TRUE)
a<-table.element(a,hyperlink('upper_whisker.htm','upper whisker','definition of upper whisker'),1,TRUE)
a<-table.row.end(a)
for (i in 1:length(y[,1]))
{
a<-table.row.start(a)
a<-table.element(a,dimnames(t(x))[[2]][i],1,TRUE)
for (j in 1:5)
{
a<-table.element(a,signif(r$stats[j,i], digits=4))
}
a<-table.row.end(a)
}
a<-table.end(a)
table.save(a,file='mytable.tab')
if (par2){
a<-table.start()
a<-table.row.start(a)
a<-table.element(a,'Boxplot Notches',4,TRUE)
a<-table.row.end(a)
a<-table.row.start(a)
a<-table.element(a,'Variable',1,TRUE)
a<-table.element(a,'lower bound',1,TRUE)
a<-table.element(a,'median',1,TRUE)
a<-table.element(a,'upper bound',1,TRUE)
a<-table.row.end(a)
for (i in 1:length(y[,1]))
{
a<-table.row.start(a)
a<-table.element(a,dimnames(t(x))[[2]][i],1,TRUE)
a<-table.element(a,signif(r$conf[1,i], digits=4))
a<-table.element(a, signif(r$stats[3,i], digits=4))
a<-table.element(a,signif(r$conf[2,i], digits=4))
a<-table.row.end(a)
}
a<-table.end(a)
table.save(a,file='mytable1.tab')
}
a<-table.start()
a<-table.row.start(a)
a<-table.element(a,'Boxplot Means',4,TRUE)
a<-table.row.end(a)
a<-table.row.start(a)
a<-table.element(a,'Variable',1,TRUE)
a<-table.element(a,hyperlink('trimmed_mean.htm','trimmed mean','definition of trimmed mean'),1,TRUE)
a<-table.element(a,hyperlink('unbiased1.htm','unbiased SD','definition of unbiased SD'),1,TRUE)
a<-table.row.end(a)
for (i in 1:length(y[,1]))
{
a<-table.row.start(a)
a<-table.element(a,dimnames(t(x))[[2]][i],1,TRUE)
a<-table.element(a,signif(mean(z[i], trim=par3/100, na.rm=TRUE), digits=4))
a<-table.element(a,signif(sd(z[i], na.rm=TRUE), digits=4))
a<-table.row.end(a)
}
a<-table.end(a)
table.save(a,file='mytable2.tab')