Free Statistics
of Irreproducible Research!
Description of Statistical Computation | ||||||||||||||||||||||||||||||
|---|---|---|---|---|---|---|---|---|---|---|---|---|---|---|---|---|---|---|---|---|---|---|---|---|---|---|---|---|---|---|
| Author's title | ||||||||||||||||||||||||||||||
| Author | *The author of this computation has been verified* | |||||||||||||||||||||||||||||
| R Software Module | rwasp_Distributional Plots.wasp | |||||||||||||||||||||||||||||
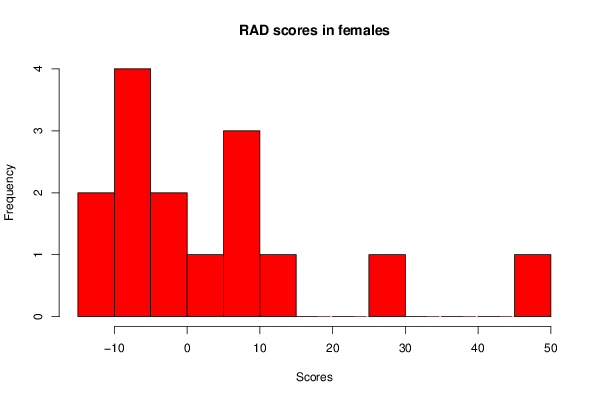
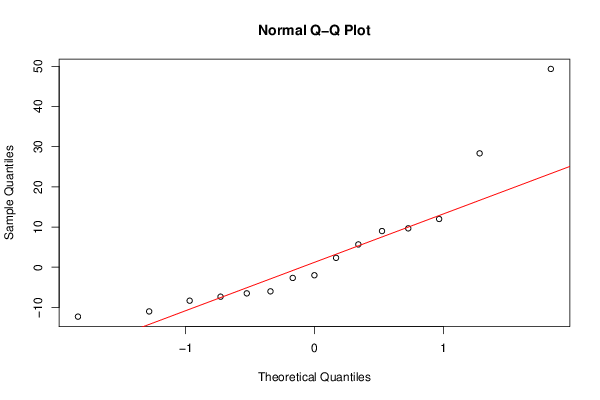
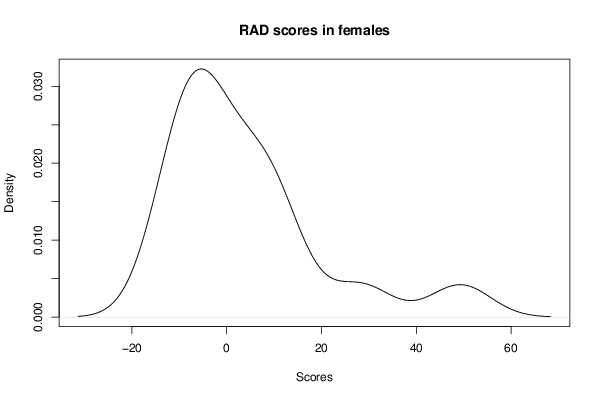
| Title produced by software | Histogram, QQplot and Density | |||||||||||||||||||||||||||||
| Date of computation | Wed, 22 May 2013 10:23:16 -0400 | |||||||||||||||||||||||||||||
| Cite this page as follows | Statistical Computations at FreeStatistics.org, Office for Research Development and Education, URL https://freestatistics.org/blog/index.php?v=date/2013/May/22/t1369232614apluii0dfy5hsx0.htm/, Retrieved Sun, 28 Apr 2024 18:51:28 +0000 | |||||||||||||||||||||||||||||
| Statistical Computations at FreeStatistics.org, Office for Research Development and Education, URL https://freestatistics.org/blog/index.php?pk=209776, Retrieved Sun, 28 Apr 2024 18:51:28 +0000 | ||||||||||||||||||||||||||||||
| QR Codes: | ||||||||||||||||||||||||||||||
|
| ||||||||||||||||||||||||||||||
| Original text written by user: | ||||||||||||||||||||||||||||||
| IsPrivate? | No (this computation is public) | |||||||||||||||||||||||||||||
| User-defined keywords | ||||||||||||||||||||||||||||||
| Estimated Impact | 99 | |||||||||||||||||||||||||||||
Tree of Dependent Computations | ||||||||||||||||||||||||||||||
| Family? (F = Feedback message, R = changed R code, M = changed R Module, P = changed Parameters, D = changed Data) | ||||||||||||||||||||||||||||||
| - [Simple Linear Regression] [RAD BPVT Regression] [2013-05-18 11:35:15] [98fd0e87c3eb04e0cc2efde01dbafab6] - RMPD [Histogram, QQplot and Density] [sd] [2013-05-22 14:23:16] [8e2a207cbdb8841df0c48f3b81f1e1ea] [Current] - R D [Histogram, QQplot and Density] [males RAD score] [2013-05-22 14:27:06] [2ee6cc98396251620517a4ca41e95edf] - RMPD [Wilcoxon-Mann-Whitney Test] [wilcoxon mann whi...] [2013-05-22 14:31:41] [2ee6cc98396251620517a4ca41e95edf] - RMPD [MC Exam - Q11] [multiple choice] [2013-05-22 14:54:17] [2ee6cc98396251620517a4ca41e95edf] - RMPD [CARE Data - Boxplots and Scatterplot Matrix] [gender] [2013-05-22 15:00:46] [2ee6cc98396251620517a4ca41e95edf] - RMPD [T-Tests] [t tst] [2013-05-22 15:07:05] [2ee6cc98396251620517a4ca41e95edf] | ||||||||||||||||||||||||||||||
| Feedback Forum | ||||||||||||||||||||||||||||||
Post a new message | ||||||||||||||||||||||||||||||
Dataset | ||||||||||||||||||||||||||||||
| Dataseries X: | ||||||||||||||||||||||||||||||
-6.5 -7.33 49.33 -11 -2.67 -8.33 9 9.67 2.33 -12.3 -6 5.67 28.33 12 -2 | ||||||||||||||||||||||||||||||
Tables (Output of Computation) | ||||||||||||||||||||||||||||||
| ||||||||||||||||||||||||||||||
Figures (Output of Computation) | ||||||||||||||||||||||||||||||
Input Parameters & R Code | ||||||||||||||||||||||||||||||
| Parameters (Session): | ||||||||||||||||||||||||||||||
| par1 = 10 ; | ||||||||||||||||||||||||||||||
| Parameters (R input): | ||||||||||||||||||||||||||||||
| par1 = 10 ; | ||||||||||||||||||||||||||||||
| R code (references can be found in the software module): | ||||||||||||||||||||||||||||||
x <- x[!is.na(x)] | ||||||||||||||||||||||||||||||