Free Statistics
of Irreproducible Research!
Description of Statistical Computation | ||||||||||||||||||||||||||||||
|---|---|---|---|---|---|---|---|---|---|---|---|---|---|---|---|---|---|---|---|---|---|---|---|---|---|---|---|---|---|---|
| Author's title | ||||||||||||||||||||||||||||||
| Author | *The author of this computation has been verified* | |||||||||||||||||||||||||||||
| R Software Module | rwasp_Distributional Plots.wasp | |||||||||||||||||||||||||||||
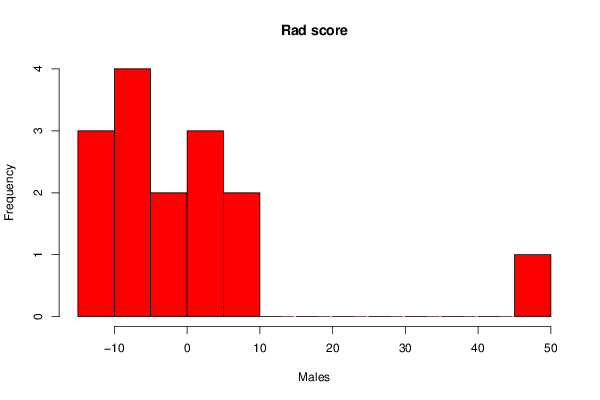
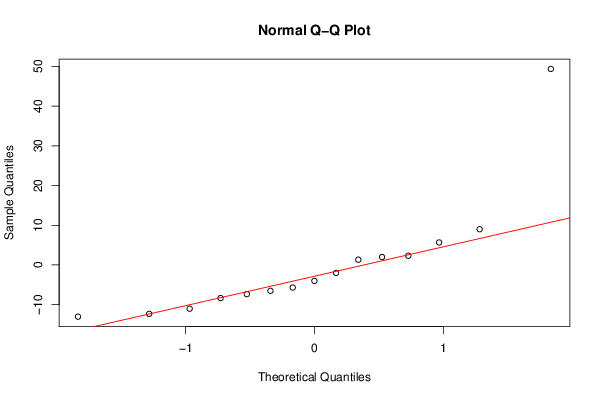
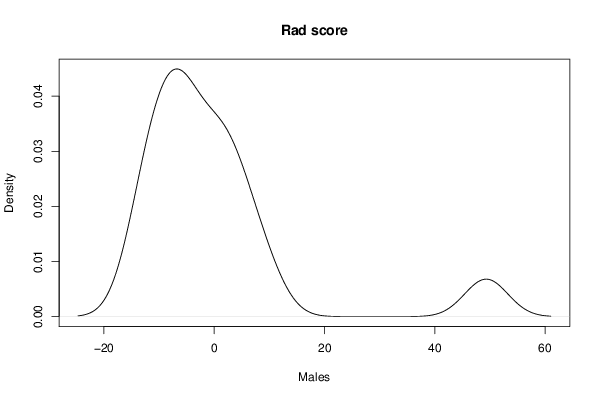
| Title produced by software | Histogram, QQplot and Density | |||||||||||||||||||||||||||||
| Date of computation | Wed, 22 May 2013 10:28:53 -0400 | |||||||||||||||||||||||||||||
| Cite this page as follows | Statistical Computations at FreeStatistics.org, Office for Research Development and Education, URL https://freestatistics.org/blog/index.php?v=date/2013/May/22/t1369232946mfjql4m7xoiv30d.htm/, Retrieved Sat, 27 Apr 2024 17:20:35 +0000 | |||||||||||||||||||||||||||||
| Statistical Computations at FreeStatistics.org, Office for Research Development and Education, URL https://freestatistics.org/blog/index.php?pk=209827, Retrieved Sat, 27 Apr 2024 17:20:35 +0000 | ||||||||||||||||||||||||||||||
| QR Codes: | ||||||||||||||||||||||||||||||
|
| ||||||||||||||||||||||||||||||
| Original text written by user: | ||||||||||||||||||||||||||||||
| IsPrivate? | No (this computation is public) | |||||||||||||||||||||||||||||
| User-defined keywords | ||||||||||||||||||||||||||||||
| Estimated Impact | 101 | |||||||||||||||||||||||||||||
Tree of Dependent Computations | ||||||||||||||||||||||||||||||
| Family? (F = Feedback message, R = changed R code, M = changed R Module, P = changed Parameters, D = changed Data) | ||||||||||||||||||||||||||||||
| - [Histogram, QQplot and Density] [female RAD score] [2013-05-22 14:26:38] [6eaf64816823b5554e496a2fe08fe185] - R D [Histogram, QQplot and Density] [Males Rad scores] [2013-05-22 14:28:53] [8b4130a30b96bca4cc7b238e4b3ba88c] [Current] - D [Histogram, QQplot and Density] [Reproduced analys...] [2013-05-22 14:32:18] [6eaf64816823b5554e496a2fe08fe185] - RMPD [Kolmogorov-Smirnov Test] [] [2013-05-22 14:37:18] [6eaf64816823b5554e496a2fe08fe185] - R D [Kolmogorov-Smirnov Test] [] [2013-05-22 14:40:26] [6eaf64816823b5554e496a2fe08fe185] - RM [Wilcoxon-Mann-Whitney Test] [Mann whitney u ] [2013-05-22 14:42:33] [6eaf64816823b5554e496a2fe08fe185] | ||||||||||||||||||||||||||||||
| Feedback Forum | ||||||||||||||||||||||||||||||
Post a new message | ||||||||||||||||||||||||||||||
Dataset | ||||||||||||||||||||||||||||||
| Dataseries X: | ||||||||||||||||||||||||||||||
-6.5 -7.33 49.33 -11 -8.33 9 2.33 -12.3 5.67 -2 1.33 -13 -5.67 -4 2 | ||||||||||||||||||||||||||||||
Tables (Output of Computation) | ||||||||||||||||||||||||||||||
| ||||||||||||||||||||||||||||||
Figures (Output of Computation) | ||||||||||||||||||||||||||||||
Input Parameters & R Code | ||||||||||||||||||||||||||||||
| Parameters (Session): | ||||||||||||||||||||||||||||||
| par1 = 10 ; | ||||||||||||||||||||||||||||||
| Parameters (R input): | ||||||||||||||||||||||||||||||
| par1 = 10 ; | ||||||||||||||||||||||||||||||
| R code (references can be found in the software module): | ||||||||||||||||||||||||||||||
x <- x[!is.na(x)] | ||||||||||||||||||||||||||||||