Free Statistics
of Irreproducible Research!
Description of Statistical Computation | ||||||||||||||||||||||||||||||
|---|---|---|---|---|---|---|---|---|---|---|---|---|---|---|---|---|---|---|---|---|---|---|---|---|---|---|---|---|---|---|
| Author's title | ||||||||||||||||||||||||||||||
| Author | *The author of this computation has been verified* | |||||||||||||||||||||||||||||
| R Software Module | rwasp_Distributional Plots.wasp | |||||||||||||||||||||||||||||
| Title produced by software | Histogram, QQplot and Density | |||||||||||||||||||||||||||||
| Date of computation | Wed, 22 May 2013 10:28:58 -0400 | |||||||||||||||||||||||||||||
| Cite this page as follows | Statistical Computations at FreeStatistics.org, Office for Research Development and Education, URL https://freestatistics.org/blog/index.php?v=date/2013/May/22/t13692329504jmyuzmltrhi7kx.htm/, Retrieved Sat, 27 Apr 2024 23:39:27 +0000 | |||||||||||||||||||||||||||||
| Statistical Computations at FreeStatistics.org, Office for Research Development and Education, URL https://freestatistics.org/blog/index.php?pk=209829, Retrieved Sat, 27 Apr 2024 23:39:27 +0000 | ||||||||||||||||||||||||||||||
| QR Codes: | ||||||||||||||||||||||||||||||
|
| ||||||||||||||||||||||||||||||
| Original text written by user: | ||||||||||||||||||||||||||||||
| IsPrivate? | No (this computation is public) | |||||||||||||||||||||||||||||
| User-defined keywords | ||||||||||||||||||||||||||||||
| Estimated Impact | 88 | |||||||||||||||||||||||||||||
Tree of Dependent Computations | ||||||||||||||||||||||||||||||
| Family? (F = Feedback message, R = changed R code, M = changed R Module, P = changed Parameters, D = changed Data) | ||||||||||||||||||||||||||||||
| - [Simple Linear Regression] [RAD BPVT Regression] [2013-05-18 11:35:15] [98fd0e87c3eb04e0cc2efde01dbafab6] - RMPD [Histogram, QQplot and Density] [girls rad scores] [2013-05-22 14:28:58] [17d6ba23881f46084902e2c0f93f8a82] [Current] - RMPD [Wilcoxon-Mann-Whitney Test] [wilcoxon man whit...] [2013-05-22 14:37:08] [f622c700cda00095ab5b447e729c09d5] - RMPD [Wilcoxon-Mann-Whitney Test] [wilcoxon man whit...] [2013-05-22 14:38:19] [f622c700cda00095ab5b447e729c09d5] - RMP [Kolmogorov-Smirnov Test] [k- g test] [2013-05-22 14:38:58] [f622c700cda00095ab5b447e729c09d5] - RMP [T-Tests] [t test] [2013-05-22 15:14:46] [f622c700cda00095ab5b447e729c09d5] | ||||||||||||||||||||||||||||||
| Feedback Forum | ||||||||||||||||||||||||||||||
Post a new message | ||||||||||||||||||||||||||||||
Dataset | ||||||||||||||||||||||||||||||
| Dataseries X: | ||||||||||||||||||||||||||||||
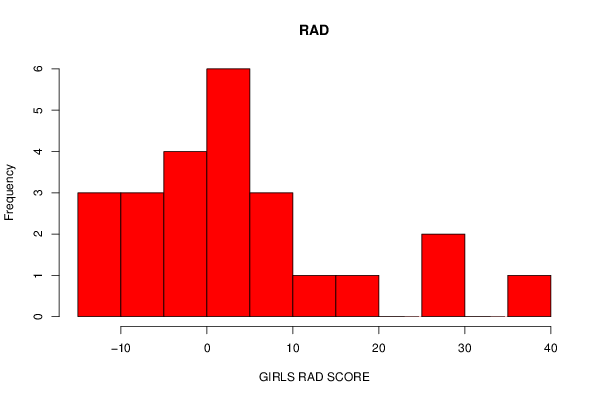
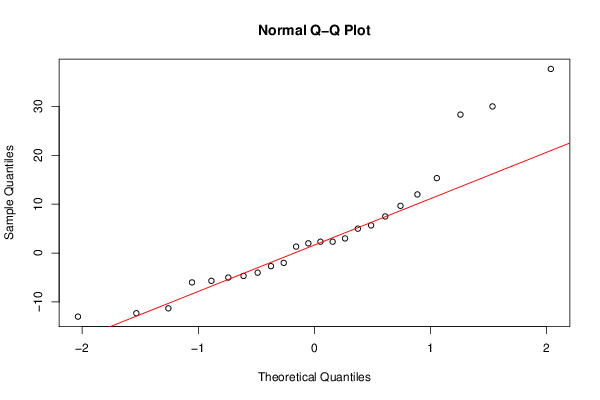
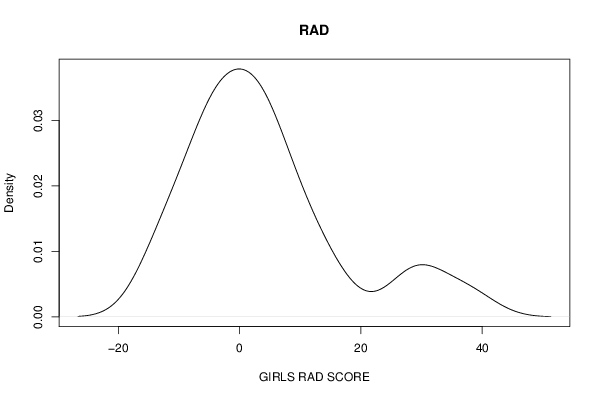
-2.67 9.67 -6 28.33 12 -11.3 3 -4.67 -5 2.33 37.67 7.5 5 30 15.33 2.33 -12.3 5.67 -2 1.33 -13 -5.67 -4 2 | ||||||||||||||||||||||||||||||
Tables (Output of Computation) | ||||||||||||||||||||||||||||||
| ||||||||||||||||||||||||||||||
Figures (Output of Computation) | ||||||||||||||||||||||||||||||
Input Parameters & R Code | ||||||||||||||||||||||||||||||
| Parameters (Session): | ||||||||||||||||||||||||||||||
| par1 = 119047215_0.962233451660722_Wed May 22 09:56:06 2013 ; par2 = x3 ; par3 = 1414c9756505ddfb8ba0a3b6fc9d691f ; par4 = 18 ; | ||||||||||||||||||||||||||||||
| Parameters (R input): | ||||||||||||||||||||||||||||||
| par1 = 10 ; | ||||||||||||||||||||||||||||||
| R code (references can be found in the software module): | ||||||||||||||||||||||||||||||
par1 <- '10' | ||||||||||||||||||||||||||||||