par1 <- 'a-119186536-2012'
if (exists('par1')) {
mylist <- list('aston2',
'119062746',
'102697687',
'119223174',
'119209536',
'119043099',
'119208193',
'119043468',
'109086158',
'119019636',
'103823050',
'119037320',
'119084069',
'129140960',
'119015351',
'81860034',
'119045369',
'103135584',
'119095102',
'119057236',
'119080061',
'119209547',
'119026612',
'119049057',
'119036068',
'119025464',
'119083497',
'119027745',
'119017609',
'119022304',
'102196939',
'119076178',
'119184783',
'129075961',
'119104437',
'119047215',
'119029196',
'119120611',
'119022061',
'100932571',
'119027583',
'119042645',
'119048072',
'119041970',
'119008984',
'119038589',
'119009121',
'119055531',
'119034721',
'119016598',
'119055391',
'119054132',
'119210901',
'119034798',
'119014516',
'129160474',
'119062229',
'71390039',
'119207093',
'119106877',
'119035762',
'119012316',
'119073225',
'101853394',
'119106268',
'119035153',
'119074093',
'119031937',
'119106604',
'119207598',
'119207990',
'119033241',
'119186536',
'103247717',
'119215319',
'119036459',
'119208230',
'119036002',
'119194586',
'119213278',
'119059012',
'119071645',
'109110039',
'119035979',
'119020713',
'119026715',
'119063846',
'119078013',
'119083420',
'119034961',
'119074691',
'102791734',
'119215010',
'119010976',
'119015915',
'129013871',
'119020159',
'103182762',
'101181943',
'119006980',
'119214644',
'119042047',
'119051784',
'129004189',
'119055874',
'119058325',
'119065415',
'119167801',
'119016370',
'119060834',
'119101045',
'119094150',
'119092400',
'119037261',
'119169355',
'Amanda')
if (length(which(mylist == par1)) > 0) {
par1 <- paste(par1,'_',runif(1),'_',date(),sep='')
} else {
load(file='createtable')
a<-table.start()
a<-table.row.start(a)
a<-table.element(a,'Error',1,TRUE)
a<-table.row.end(a)
a<-table.row.start(a)
a<-table.element(a,'The User ID you entered does not exist! ')
a<-table.row.end(a)
a<-table.end(a)
table.save(a,file='mytable1a.tab')
stop('The User ID you entered does not exist!')
}
library(digest)
myran <- runif(1)
if (myran <= 1) {
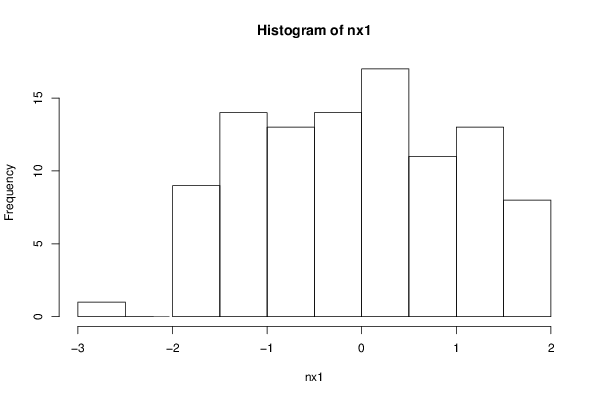
nx1 <- rnorm(100)
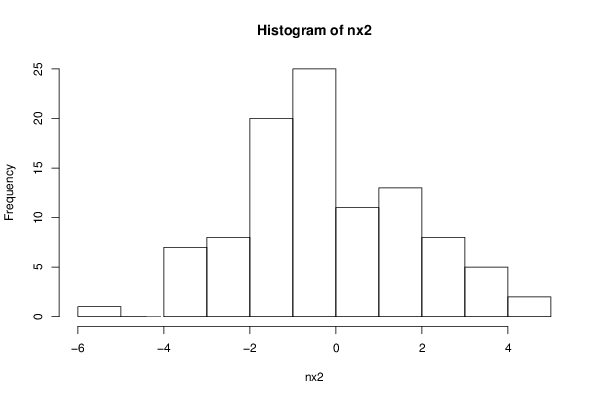
nx2 <- rnorm(100, sd=2.0, mean=0.0)
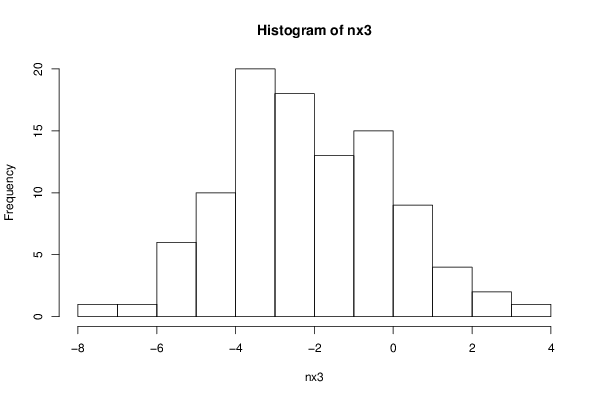
nx3 <- rnorm(100, sd=2.0, mean=-2.0)
answer <- 'nx1'
}
if (myran < 0.66) {
nx2 <- rnorm(100)
nx3 <- rnorm(100, sd=2.0, mean=0.0)
nx1 <- rnorm(100, sd=2.0, mean=-2.0)
answer <- 'nx2'
}
if (myran < 0.33) {
nx3 <- rnorm(100)
nx1 <- rnorm(100, sd=2.0, mean=0.0)
nx2 <- rnorm(100, sd=2.0, mean=-2.0)
answer <- 'nx3'
}
answer <- digest(answer,ser=F)
allmeans<- c(mean(nx1),mean(nx2),mean(nx3))
names(allmeans)<-c('Sample 1', 'Sample 2', 'Sample 3')
allmeans
allsd<- c(sd(nx1), sd(nx2), sd(nx3))
names(allsd)<- c('Sample 1', 'Sample 2', 'Sample 3')
allsd
load(file='createtable')
a<-table.start()
a<-table.row.start(a)
a<-table.element(a,'Identify the sample most similar to a standard normal distribution.',1,TRUE)
a<-table.row.end(a)
a<-table.row.start(a)
a<-table.element(a,hyperlink(paste('https://automated.biganalytics.eu/rwasp_mcq20122.wasp?par1=',par1,'&par2=nx1&par3=',answer,'&par0=1',sep=''),'The sample called nx1','',target=''))
a<-table.row.end(a)
a<-table.row.start(a)
a<-table.element(a,hyperlink(paste('https://automated.biganalytics.eu/rwasp_mcq20122.wasp?par1=',par1,'&par2=nx2&par3=',answer,'&par0=1',sep=''),'The sample called nx2','',target=''))
a<-table.row.end(a)
a<-table.row.start(a)
a<-table.element(a,hyperlink(paste('https://automated.biganalytics.eu/rwasp_mcq20122.wasp?par1=',par1,'&par2=nx3&par3=',answer,'&par0=1',sep=''),'The sample called nx3','',target=''))
a<-table.row.end(a)
a<-table.row.start(a)
a<-table.element(a,hyperlink(paste('https://automated.biganalytics.eu/rwasp_mcq20122.wasp?par1=',par1,'&par2=wnga&par3=',answer,'&par0=1',sep=''),'Avoid Guessing Penalty','',target=''))
a<-table.row.end(a)
a<-table.end(a)
table.save(a,file='mytable1.tab')
a<-table.start()
a<-table.row.start(a)
a<-table.element(a,'Means of the three samples',4,TRUE)
a<-table.row.end(a)
a<-table.row.start(a)
a<-table.element(a,'Sample',1,TRUE)
a<-table.element(a,'nx1',1,TRUE)
a<-table.element(a,'nx2',1,TRUE)
a<-table.element(a,'nx3',1,TRUE)
a<-table.row.end(a)
a<-table.row.start(a)
a<-table.element(a,'Value',1,TRUE)
a<-table.element(a,round(mean(nx1),3))
a<-table.element(a,round(mean(nx2),3))
a<-table.element(a,round(mean(nx3),3))
a<-table.row.end(a)
a<-table.end(a)
table.save(a,file='mytable2.tab')
a<-table.start()
a<-table.row.start(a)
a<-table.element(a,'Standard deviations of the three samples',4,TRUE)
a<-table.row.end(a)
a<-table.row.start(a)
a<-table.element(a,'Sample',1,TRUE)
a<-table.element(a,'nx1',1,TRUE)
a<-table.element(a,'nx2',1,TRUE)
a<-table.element(a,'nx3',1,TRUE)
a<-table.row.end(a)
a<-table.row.start(a)
a<-table.element(a,'Value',1,TRUE)
a<-table.element(a,round(sd(nx1),3))
a<-table.element(a,round(sd(nx2),3))
a<-table.element(a,round(sd(nx3),3))
a<-table.row.end(a)
a<-table.end(a)
table.save(a,file='mytable3.tab')
bitmap(file='hist1.png')
hist(nx1)
dev.off()
bitmap(file='hist2.png')
hist(nx2)
dev.off()
bitmap(file='hist3.png')
hist(nx3)
dev.off()
bitmap(file='pairs.png')
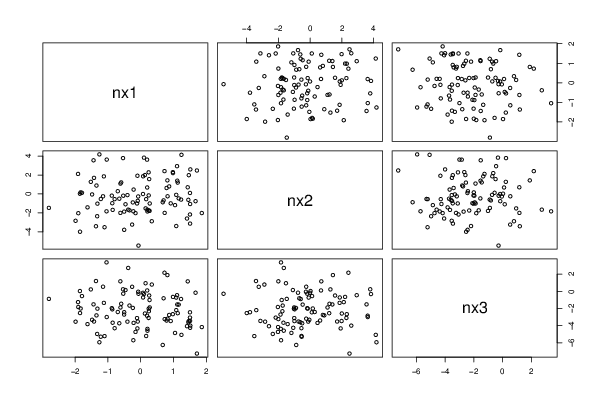
pairs(x=cbind(nx1, nx2, nx3))
dev.off()
}
|