Free Statistics

of Irreproducible Research!

Author's title

Author*Unverified author*
R Software Modulerwasp_autocorrelation.wasp
Title produced by software(Partial) Autocorrelation Function
Date of computationFri, 24 May 2013 10:23:23 -0400
Cite this page as followsStatistical Computations at FreeStatistics.org, Office for Research Development and Education, URL https://freestatistics.org/blog/index.php?v=date/2013/May/24/t1369405457y3uzww42jnoj21k.htm/, Retrieved Tue, 30 Apr 2024 22:51:12 +0000
Statistical Computations at FreeStatistics.org, Office for Research Development and Education, URL https://freestatistics.org/blog/index.php?pk=210425, Retrieved Tue, 30 Apr 2024 22:51:12 +0000
QR Codes:

Original text written by user:
IsPrivate?No (this computation is public)
User-defined keywords
Estimated Impact113
Family? (F = Feedback message, R = changed R code, M = changed R Module, P = changed Parameters, D = changed Data)
-       [(Partial) Autocorrelation Function] [opdracht 6 bis oe...] [2013-05-24 14:23:23] [28ee828acec30dee1c1aebeda9b64e12] [Current]
Feedback Forum

Post a new message
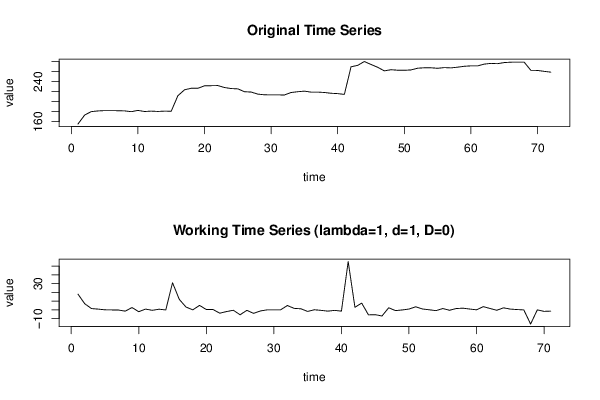
Dataseries X:
155.28
173.24
180.16
181.52
182.25
182.19
182
181.65
180.07
182.62
180.38
181.15
180.5
181.14
180.93
211.91
223.81
226.88
226.8
231.81
232.06
232.32
228.37
226.31
225.72
219.98
219.31
215.19
213.81
213.7
213.6
213.52
218.39
219.97
221.09
219.17
219.17
218.45
216.88
216.19
214.59
269.87
272.71
280.35
274.5
268.86
261.7
263.98
263.01
262.79
263.59
267
267.89
267.86
266.84
268.24
267.67
269.07
270.87
271.68
271.63
275.21
276.66
276.08
278.3
279.06
279.28
279.12
262.72
262.55
260.7
259.14


Summary of computational transaction
Raw Inputview raw input (R code)
Raw Outputview raw output of R engine
Computing time3 seconds
R Server'Sir Maurice George Kendall' @ kendall.wessa.net

\begin{tabular}{lllllllll}
\hline
Summary of computational transaction \tabularnewline
Raw Input & view raw input (R code)  \tabularnewline
Raw Output & view raw output of R engine  \tabularnewline
Computing time & 3 seconds \tabularnewline
R Server & 'Sir Maurice George Kendall' @ kendall.wessa.net \tabularnewline
\hline
\end{tabular}
%Source: https://freestatistics.org/blog/index.php?pk=210425&T=0

[TABLE]
[ROW][C]Summary of computational transaction[/C][/ROW]
[ROW][C]Raw Input[/C][C]view raw input (R code) [/C][/ROW]
[ROW][C]Raw Output[/C][C]view raw output of R engine [/C][/ROW]
[ROW][C]Computing time[/C][C]3 seconds[/C][/ROW]
[ROW][C]R Server[/C][C]'Sir Maurice George Kendall' @ kendall.wessa.net[/C][/ROW]
[/TABLE]
Source: https://freestatistics.org/blog/index.php?pk=210425&T=0

Globally Unique Identifier (entire table): ba.freestatistics.org/blog/index.php?pk=210425&T=0

As an alternative you can also use a QR Code:  

The GUIDs for individual cells are displayed in the table below:

Summary of computational transaction
Raw Inputview raw input (R code)
Raw Outputview raw output of R engine
Computing time3 seconds
R Server'Sir Maurice George Kendall' @ kendall.wessa.net


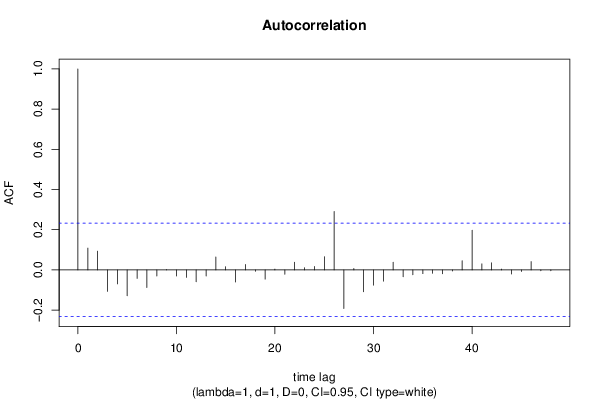
Autocorrelation Function
Time lag kACF(k)T-STATP-value
10.1083790.91320.182108
20.0933520.78660.217068
3-0.106965-0.90130.185238
4-0.0697-0.58730.279431
5-0.128857-1.08580.140627
6-0.042314-0.35650.361246
7-0.087766-0.73950.231013
8-0.030029-0.2530.400488
90.0008240.00690.49724
10-0.030031-0.2530.400483
11-0.037045-0.31210.377922
12-0.058617-0.49390.311445
13-0.029989-0.25270.40062
140.0638830.53830.29603
150.0161520.13610.446064
16-0.060014-0.50570.307321
170.0272830.22990.409419
18-0.006951-0.05860.47673
19-0.046016-0.38770.349686
200.00390.03290.486938
21-0.02147-0.18090.428477
220.0380570.32070.374699
230.0104960.08840.464888
240.0167490.14110.444082
250.0651570.5490.292355
260.2909672.45170.00834
27-0.192169-1.61920.054915
280.0067620.0570.477361
29-0.108319-0.91270.182242
30-0.075682-0.63770.262858
31-0.05583-0.47040.319744
320.0385160.32450.373241
33-0.03376-0.28450.388442
34-0.02393-0.20160.420388
35-0.018494-0.15580.438303
36-0.016505-0.13910.444894
37-0.019474-0.16410.435064
38-0.005805-0.04890.480564
390.045570.3840.351071
400.1973621.6630.050361
410.0299220.25210.400836
420.0352360.29690.383705
430.0041410.03490.486133
44-0.020493-0.17270.431699
45-0.008337-0.07020.472096
460.041390.34880.364152
47-0.003847-0.03240.487115
48-0.004563-0.03850.484718

\begin{tabular}{lllllllll}
\hline
Autocorrelation Function \tabularnewline
Time lag k & ACF(k) & T-STAT & P-value \tabularnewline
1 & 0.108379 & 0.9132 & 0.182108 \tabularnewline
2 & 0.093352 & 0.7866 & 0.217068 \tabularnewline
3 & -0.106965 & -0.9013 & 0.185238 \tabularnewline
4 & -0.0697 & -0.5873 & 0.279431 \tabularnewline
5 & -0.128857 & -1.0858 & 0.140627 \tabularnewline
6 & -0.042314 & -0.3565 & 0.361246 \tabularnewline
7 & -0.087766 & -0.7395 & 0.231013 \tabularnewline
8 & -0.030029 & -0.253 & 0.400488 \tabularnewline
9 & 0.000824 & 0.0069 & 0.49724 \tabularnewline
10 & -0.030031 & -0.253 & 0.400483 \tabularnewline
11 & -0.037045 & -0.3121 & 0.377922 \tabularnewline
12 & -0.058617 & -0.4939 & 0.311445 \tabularnewline
13 & -0.029989 & -0.2527 & 0.40062 \tabularnewline
14 & 0.063883 & 0.5383 & 0.29603 \tabularnewline
15 & 0.016152 & 0.1361 & 0.446064 \tabularnewline
16 & -0.060014 & -0.5057 & 0.307321 \tabularnewline
17 & 0.027283 & 0.2299 & 0.409419 \tabularnewline
18 & -0.006951 & -0.0586 & 0.47673 \tabularnewline
19 & -0.046016 & -0.3877 & 0.349686 \tabularnewline
20 & 0.0039 & 0.0329 & 0.486938 \tabularnewline
21 & -0.02147 & -0.1809 & 0.428477 \tabularnewline
22 & 0.038057 & 0.3207 & 0.374699 \tabularnewline
23 & 0.010496 & 0.0884 & 0.464888 \tabularnewline
24 & 0.016749 & 0.1411 & 0.444082 \tabularnewline
25 & 0.065157 & 0.549 & 0.292355 \tabularnewline
26 & 0.290967 & 2.4517 & 0.00834 \tabularnewline
27 & -0.192169 & -1.6192 & 0.054915 \tabularnewline
28 & 0.006762 & 0.057 & 0.477361 \tabularnewline
29 & -0.108319 & -0.9127 & 0.182242 \tabularnewline
30 & -0.075682 & -0.6377 & 0.262858 \tabularnewline
31 & -0.05583 & -0.4704 & 0.319744 \tabularnewline
32 & 0.038516 & 0.3245 & 0.373241 \tabularnewline
33 & -0.03376 & -0.2845 & 0.388442 \tabularnewline
34 & -0.02393 & -0.2016 & 0.420388 \tabularnewline
35 & -0.018494 & -0.1558 & 0.438303 \tabularnewline
36 & -0.016505 & -0.1391 & 0.444894 \tabularnewline
37 & -0.019474 & -0.1641 & 0.435064 \tabularnewline
38 & -0.005805 & -0.0489 & 0.480564 \tabularnewline
39 & 0.04557 & 0.384 & 0.351071 \tabularnewline
40 & 0.197362 & 1.663 & 0.050361 \tabularnewline
41 & 0.029922 & 0.2521 & 0.400836 \tabularnewline
42 & 0.035236 & 0.2969 & 0.383705 \tabularnewline
43 & 0.004141 & 0.0349 & 0.486133 \tabularnewline
44 & -0.020493 & -0.1727 & 0.431699 \tabularnewline
45 & -0.008337 & -0.0702 & 0.472096 \tabularnewline
46 & 0.04139 & 0.3488 & 0.364152 \tabularnewline
47 & -0.003847 & -0.0324 & 0.487115 \tabularnewline
48 & -0.004563 & -0.0385 & 0.484718 \tabularnewline
\hline
\end{tabular}
%Source: https://freestatistics.org/blog/index.php?pk=210425&T=1

[TABLE]
[ROW][C]Autocorrelation Function[/C][/ROW]
[ROW][C]Time lag k[/C][C]ACF(k)[/C][C]T-STAT[/C][C]P-value[/C][/ROW]
[ROW][C]1[/C][C]0.108379[/C][C]0.9132[/C][C]0.182108[/C][/ROW]
[ROW][C]2[/C][C]0.093352[/C][C]0.7866[/C][C]0.217068[/C][/ROW]
[ROW][C]3[/C][C]-0.106965[/C][C]-0.9013[/C][C]0.185238[/C][/ROW]
[ROW][C]4[/C][C]-0.0697[/C][C]-0.5873[/C][C]0.279431[/C][/ROW]
[ROW][C]5[/C][C]-0.128857[/C][C]-1.0858[/C][C]0.140627[/C][/ROW]
[ROW][C]6[/C][C]-0.042314[/C][C]-0.3565[/C][C]0.361246[/C][/ROW]
[ROW][C]7[/C][C]-0.087766[/C][C]-0.7395[/C][C]0.231013[/C][/ROW]
[ROW][C]8[/C][C]-0.030029[/C][C]-0.253[/C][C]0.400488[/C][/ROW]
[ROW][C]9[/C][C]0.000824[/C][C]0.0069[/C][C]0.49724[/C][/ROW]
[ROW][C]10[/C][C]-0.030031[/C][C]-0.253[/C][C]0.400483[/C][/ROW]
[ROW][C]11[/C][C]-0.037045[/C][C]-0.3121[/C][C]0.377922[/C][/ROW]
[ROW][C]12[/C][C]-0.058617[/C][C]-0.4939[/C][C]0.311445[/C][/ROW]
[ROW][C]13[/C][C]-0.029989[/C][C]-0.2527[/C][C]0.40062[/C][/ROW]
[ROW][C]14[/C][C]0.063883[/C][C]0.5383[/C][C]0.29603[/C][/ROW]
[ROW][C]15[/C][C]0.016152[/C][C]0.1361[/C][C]0.446064[/C][/ROW]
[ROW][C]16[/C][C]-0.060014[/C][C]-0.5057[/C][C]0.307321[/C][/ROW]
[ROW][C]17[/C][C]0.027283[/C][C]0.2299[/C][C]0.409419[/C][/ROW]
[ROW][C]18[/C][C]-0.006951[/C][C]-0.0586[/C][C]0.47673[/C][/ROW]
[ROW][C]19[/C][C]-0.046016[/C][C]-0.3877[/C][C]0.349686[/C][/ROW]
[ROW][C]20[/C][C]0.0039[/C][C]0.0329[/C][C]0.486938[/C][/ROW]
[ROW][C]21[/C][C]-0.02147[/C][C]-0.1809[/C][C]0.428477[/C][/ROW]
[ROW][C]22[/C][C]0.038057[/C][C]0.3207[/C][C]0.374699[/C][/ROW]
[ROW][C]23[/C][C]0.010496[/C][C]0.0884[/C][C]0.464888[/C][/ROW]
[ROW][C]24[/C][C]0.016749[/C][C]0.1411[/C][C]0.444082[/C][/ROW]
[ROW][C]25[/C][C]0.065157[/C][C]0.549[/C][C]0.292355[/C][/ROW]
[ROW][C]26[/C][C]0.290967[/C][C]2.4517[/C][C]0.00834[/C][/ROW]
[ROW][C]27[/C][C]-0.192169[/C][C]-1.6192[/C][C]0.054915[/C][/ROW]
[ROW][C]28[/C][C]0.006762[/C][C]0.057[/C][C]0.477361[/C][/ROW]
[ROW][C]29[/C][C]-0.108319[/C][C]-0.9127[/C][C]0.182242[/C][/ROW]
[ROW][C]30[/C][C]-0.075682[/C][C]-0.6377[/C][C]0.262858[/C][/ROW]
[ROW][C]31[/C][C]-0.05583[/C][C]-0.4704[/C][C]0.319744[/C][/ROW]
[ROW][C]32[/C][C]0.038516[/C][C]0.3245[/C][C]0.373241[/C][/ROW]
[ROW][C]33[/C][C]-0.03376[/C][C]-0.2845[/C][C]0.388442[/C][/ROW]
[ROW][C]34[/C][C]-0.02393[/C][C]-0.2016[/C][C]0.420388[/C][/ROW]
[ROW][C]35[/C][C]-0.018494[/C][C]-0.1558[/C][C]0.438303[/C][/ROW]
[ROW][C]36[/C][C]-0.016505[/C][C]-0.1391[/C][C]0.444894[/C][/ROW]
[ROW][C]37[/C][C]-0.019474[/C][C]-0.1641[/C][C]0.435064[/C][/ROW]
[ROW][C]38[/C][C]-0.005805[/C][C]-0.0489[/C][C]0.480564[/C][/ROW]
[ROW][C]39[/C][C]0.04557[/C][C]0.384[/C][C]0.351071[/C][/ROW]
[ROW][C]40[/C][C]0.197362[/C][C]1.663[/C][C]0.050361[/C][/ROW]
[ROW][C]41[/C][C]0.029922[/C][C]0.2521[/C][C]0.400836[/C][/ROW]
[ROW][C]42[/C][C]0.035236[/C][C]0.2969[/C][C]0.383705[/C][/ROW]
[ROW][C]43[/C][C]0.004141[/C][C]0.0349[/C][C]0.486133[/C][/ROW]
[ROW][C]44[/C][C]-0.020493[/C][C]-0.1727[/C][C]0.431699[/C][/ROW]
[ROW][C]45[/C][C]-0.008337[/C][C]-0.0702[/C][C]0.472096[/C][/ROW]
[ROW][C]46[/C][C]0.04139[/C][C]0.3488[/C][C]0.364152[/C][/ROW]
[ROW][C]47[/C][C]-0.003847[/C][C]-0.0324[/C][C]0.487115[/C][/ROW]
[ROW][C]48[/C][C]-0.004563[/C][C]-0.0385[/C][C]0.484718[/C][/ROW]
[/TABLE]
Source: https://freestatistics.org/blog/index.php?pk=210425&T=1

Globally Unique Identifier (entire table): ba.freestatistics.org/blog/index.php?pk=210425&T=1

As an alternative you can also use a QR Code:  

The GUIDs for individual cells are displayed in the table below:

Autocorrelation Function
Time lag kACF(k)T-STATP-value
10.1083790.91320.182108
20.0933520.78660.217068
3-0.106965-0.90130.185238
4-0.0697-0.58730.279431
5-0.128857-1.08580.140627
6-0.042314-0.35650.361246
7-0.087766-0.73950.231013
8-0.030029-0.2530.400488
90.0008240.00690.49724
10-0.030031-0.2530.400483
11-0.037045-0.31210.377922
12-0.058617-0.49390.311445
13-0.029989-0.25270.40062
140.0638830.53830.29603
150.0161520.13610.446064
16-0.060014-0.50570.307321
170.0272830.22990.409419
18-0.006951-0.05860.47673
19-0.046016-0.38770.349686
200.00390.03290.486938
21-0.02147-0.18090.428477
220.0380570.32070.374699
230.0104960.08840.464888
240.0167490.14110.444082
250.0651570.5490.292355
260.2909672.45170.00834
27-0.192169-1.61920.054915
280.0067620.0570.477361
29-0.108319-0.91270.182242
30-0.075682-0.63770.262858
31-0.05583-0.47040.319744
320.0385160.32450.373241
33-0.03376-0.28450.388442
34-0.02393-0.20160.420388
35-0.018494-0.15580.438303
36-0.016505-0.13910.444894
37-0.019474-0.16410.435064
38-0.005805-0.04890.480564
390.045570.3840.351071
400.1973621.6630.050361
410.0299220.25210.400836
420.0352360.29690.383705
430.0041410.03490.486133
44-0.020493-0.17270.431699
45-0.008337-0.07020.472096
460.041390.34880.364152
47-0.003847-0.03240.487115
48-0.004563-0.03850.484718


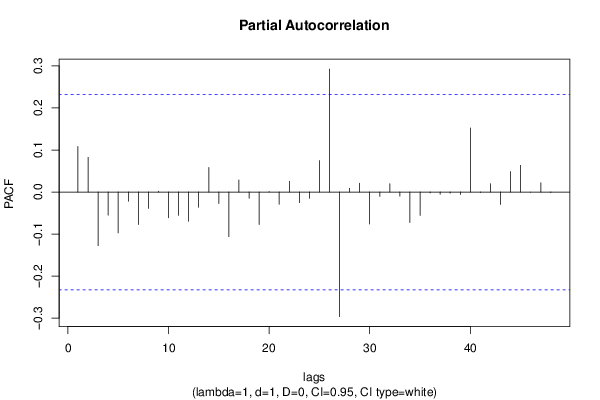
Partial Autocorrelation Function
Time lag kPACF(k)T-STATP-value
10.1083790.91320.182108
20.0825760.69580.244414
3-0.127554-1.07480.143054
4-0.054898-0.46260.32254
5-0.097273-0.81960.207584
6-0.021787-0.18360.427431
7-0.077364-0.65190.25829
8-0.038917-0.32790.371968
90.0020270.01710.49321
10-0.061091-0.51480.304159
11-0.055526-0.46790.320654
12-0.069667-0.5870.279525
13-0.036186-0.30490.380665
140.0584280.49230.312005
15-0.02747-0.23150.408809
16-0.106042-0.89350.187297
170.0286540.24140.404954
18-0.014936-0.12590.450101
19-0.077401-0.65220.258192
200.0004770.0040.498401
21-0.02907-0.24490.403603
220.0256110.21580.414879
23-0.025299-0.21320.415902
24-0.014743-0.12420.450745
250.0746850.62930.265583
260.2928712.46780.008004
27-0.296493-2.49830.007398
280.0087530.07380.470708
290.0209860.17680.430071
30-0.075897-0.63950.262272
31-0.010378-0.08740.465283
320.0196360.16550.434528
33-0.009712-0.08180.467504
34-0.072346-0.60960.272038
35-0.055627-0.46870.320352
36-0.001953-0.01650.49346
37-0.005395-0.04550.481933
38-0.002589-0.02180.491329
39-0.005751-0.04850.480742
400.1525241.28520.101451
41-0.001178-0.00990.496055
420.0198230.1670.433909
43-0.029697-0.25020.401564
440.0488990.4120.34078
450.0634040.53430.297418
46-3e-0600.499988
470.0220280.18560.426641
48-0.001035-0.00870.496534

\begin{tabular}{lllllllll}
\hline
Partial Autocorrelation Function \tabularnewline
Time lag k & PACF(k) & T-STAT & P-value \tabularnewline
1 & 0.108379 & 0.9132 & 0.182108 \tabularnewline
2 & 0.082576 & 0.6958 & 0.244414 \tabularnewline
3 & -0.127554 & -1.0748 & 0.143054 \tabularnewline
4 & -0.054898 & -0.4626 & 0.32254 \tabularnewline
5 & -0.097273 & -0.8196 & 0.207584 \tabularnewline
6 & -0.021787 & -0.1836 & 0.427431 \tabularnewline
7 & -0.077364 & -0.6519 & 0.25829 \tabularnewline
8 & -0.038917 & -0.3279 & 0.371968 \tabularnewline
9 & 0.002027 & 0.0171 & 0.49321 \tabularnewline
10 & -0.061091 & -0.5148 & 0.304159 \tabularnewline
11 & -0.055526 & -0.4679 & 0.320654 \tabularnewline
12 & -0.069667 & -0.587 & 0.279525 \tabularnewline
13 & -0.036186 & -0.3049 & 0.380665 \tabularnewline
14 & 0.058428 & 0.4923 & 0.312005 \tabularnewline
15 & -0.02747 & -0.2315 & 0.408809 \tabularnewline
16 & -0.106042 & -0.8935 & 0.187297 \tabularnewline
17 & 0.028654 & 0.2414 & 0.404954 \tabularnewline
18 & -0.014936 & -0.1259 & 0.450101 \tabularnewline
19 & -0.077401 & -0.6522 & 0.258192 \tabularnewline
20 & 0.000477 & 0.004 & 0.498401 \tabularnewline
21 & -0.02907 & -0.2449 & 0.403603 \tabularnewline
22 & 0.025611 & 0.2158 & 0.414879 \tabularnewline
23 & -0.025299 & -0.2132 & 0.415902 \tabularnewline
24 & -0.014743 & -0.1242 & 0.450745 \tabularnewline
25 & 0.074685 & 0.6293 & 0.265583 \tabularnewline
26 & 0.292871 & 2.4678 & 0.008004 \tabularnewline
27 & -0.296493 & -2.4983 & 0.007398 \tabularnewline
28 & 0.008753 & 0.0738 & 0.470708 \tabularnewline
29 & 0.020986 & 0.1768 & 0.430071 \tabularnewline
30 & -0.075897 & -0.6395 & 0.262272 \tabularnewline
31 & -0.010378 & -0.0874 & 0.465283 \tabularnewline
32 & 0.019636 & 0.1655 & 0.434528 \tabularnewline
33 & -0.009712 & -0.0818 & 0.467504 \tabularnewline
34 & -0.072346 & -0.6096 & 0.272038 \tabularnewline
35 & -0.055627 & -0.4687 & 0.320352 \tabularnewline
36 & -0.001953 & -0.0165 & 0.49346 \tabularnewline
37 & -0.005395 & -0.0455 & 0.481933 \tabularnewline
38 & -0.002589 & -0.0218 & 0.491329 \tabularnewline
39 & -0.005751 & -0.0485 & 0.480742 \tabularnewline
40 & 0.152524 & 1.2852 & 0.101451 \tabularnewline
41 & -0.001178 & -0.0099 & 0.496055 \tabularnewline
42 & 0.019823 & 0.167 & 0.433909 \tabularnewline
43 & -0.029697 & -0.2502 & 0.401564 \tabularnewline
44 & 0.048899 & 0.412 & 0.34078 \tabularnewline
45 & 0.063404 & 0.5343 & 0.297418 \tabularnewline
46 & -3e-06 & 0 & 0.499988 \tabularnewline
47 & 0.022028 & 0.1856 & 0.426641 \tabularnewline
48 & -0.001035 & -0.0087 & 0.496534 \tabularnewline
\hline
\end{tabular}
%Source: https://freestatistics.org/blog/index.php?pk=210425&T=2

[TABLE]
[ROW][C]Partial Autocorrelation Function[/C][/ROW]
[ROW][C]Time lag k[/C][C]PACF(k)[/C][C]T-STAT[/C][C]P-value[/C][/ROW]
[ROW][C]1[/C][C]0.108379[/C][C]0.9132[/C][C]0.182108[/C][/ROW]
[ROW][C]2[/C][C]0.082576[/C][C]0.6958[/C][C]0.244414[/C][/ROW]
[ROW][C]3[/C][C]-0.127554[/C][C]-1.0748[/C][C]0.143054[/C][/ROW]
[ROW][C]4[/C][C]-0.054898[/C][C]-0.4626[/C][C]0.32254[/C][/ROW]
[ROW][C]5[/C][C]-0.097273[/C][C]-0.8196[/C][C]0.207584[/C][/ROW]
[ROW][C]6[/C][C]-0.021787[/C][C]-0.1836[/C][C]0.427431[/C][/ROW]
[ROW][C]7[/C][C]-0.077364[/C][C]-0.6519[/C][C]0.25829[/C][/ROW]
[ROW][C]8[/C][C]-0.038917[/C][C]-0.3279[/C][C]0.371968[/C][/ROW]
[ROW][C]9[/C][C]0.002027[/C][C]0.0171[/C][C]0.49321[/C][/ROW]
[ROW][C]10[/C][C]-0.061091[/C][C]-0.5148[/C][C]0.304159[/C][/ROW]
[ROW][C]11[/C][C]-0.055526[/C][C]-0.4679[/C][C]0.320654[/C][/ROW]
[ROW][C]12[/C][C]-0.069667[/C][C]-0.587[/C][C]0.279525[/C][/ROW]
[ROW][C]13[/C][C]-0.036186[/C][C]-0.3049[/C][C]0.380665[/C][/ROW]
[ROW][C]14[/C][C]0.058428[/C][C]0.4923[/C][C]0.312005[/C][/ROW]
[ROW][C]15[/C][C]-0.02747[/C][C]-0.2315[/C][C]0.408809[/C][/ROW]
[ROW][C]16[/C][C]-0.106042[/C][C]-0.8935[/C][C]0.187297[/C][/ROW]
[ROW][C]17[/C][C]0.028654[/C][C]0.2414[/C][C]0.404954[/C][/ROW]
[ROW][C]18[/C][C]-0.014936[/C][C]-0.1259[/C][C]0.450101[/C][/ROW]
[ROW][C]19[/C][C]-0.077401[/C][C]-0.6522[/C][C]0.258192[/C][/ROW]
[ROW][C]20[/C][C]0.000477[/C][C]0.004[/C][C]0.498401[/C][/ROW]
[ROW][C]21[/C][C]-0.02907[/C][C]-0.2449[/C][C]0.403603[/C][/ROW]
[ROW][C]22[/C][C]0.025611[/C][C]0.2158[/C][C]0.414879[/C][/ROW]
[ROW][C]23[/C][C]-0.025299[/C][C]-0.2132[/C][C]0.415902[/C][/ROW]
[ROW][C]24[/C][C]-0.014743[/C][C]-0.1242[/C][C]0.450745[/C][/ROW]
[ROW][C]25[/C][C]0.074685[/C][C]0.6293[/C][C]0.265583[/C][/ROW]
[ROW][C]26[/C][C]0.292871[/C][C]2.4678[/C][C]0.008004[/C][/ROW]
[ROW][C]27[/C][C]-0.296493[/C][C]-2.4983[/C][C]0.007398[/C][/ROW]
[ROW][C]28[/C][C]0.008753[/C][C]0.0738[/C][C]0.470708[/C][/ROW]
[ROW][C]29[/C][C]0.020986[/C][C]0.1768[/C][C]0.430071[/C][/ROW]
[ROW][C]30[/C][C]-0.075897[/C][C]-0.6395[/C][C]0.262272[/C][/ROW]
[ROW][C]31[/C][C]-0.010378[/C][C]-0.0874[/C][C]0.465283[/C][/ROW]
[ROW][C]32[/C][C]0.019636[/C][C]0.1655[/C][C]0.434528[/C][/ROW]
[ROW][C]33[/C][C]-0.009712[/C][C]-0.0818[/C][C]0.467504[/C][/ROW]
[ROW][C]34[/C][C]-0.072346[/C][C]-0.6096[/C][C]0.272038[/C][/ROW]
[ROW][C]35[/C][C]-0.055627[/C][C]-0.4687[/C][C]0.320352[/C][/ROW]
[ROW][C]36[/C][C]-0.001953[/C][C]-0.0165[/C][C]0.49346[/C][/ROW]
[ROW][C]37[/C][C]-0.005395[/C][C]-0.0455[/C][C]0.481933[/C][/ROW]
[ROW][C]38[/C][C]-0.002589[/C][C]-0.0218[/C][C]0.491329[/C][/ROW]
[ROW][C]39[/C][C]-0.005751[/C][C]-0.0485[/C][C]0.480742[/C][/ROW]
[ROW][C]40[/C][C]0.152524[/C][C]1.2852[/C][C]0.101451[/C][/ROW]
[ROW][C]41[/C][C]-0.001178[/C][C]-0.0099[/C][C]0.496055[/C][/ROW]
[ROW][C]42[/C][C]0.019823[/C][C]0.167[/C][C]0.433909[/C][/ROW]
[ROW][C]43[/C][C]-0.029697[/C][C]-0.2502[/C][C]0.401564[/C][/ROW]
[ROW][C]44[/C][C]0.048899[/C][C]0.412[/C][C]0.34078[/C][/ROW]
[ROW][C]45[/C][C]0.063404[/C][C]0.5343[/C][C]0.297418[/C][/ROW]
[ROW][C]46[/C][C]-3e-06[/C][C]0[/C][C]0.499988[/C][/ROW]
[ROW][C]47[/C][C]0.022028[/C][C]0.1856[/C][C]0.426641[/C][/ROW]
[ROW][C]48[/C][C]-0.001035[/C][C]-0.0087[/C][C]0.496534[/C][/ROW]
[/TABLE]
Source: https://freestatistics.org/blog/index.php?pk=210425&T=2

Globally Unique Identifier (entire table): ba.freestatistics.org/blog/index.php?pk=210425&T=2

As an alternative you can also use a QR Code:  

The GUIDs for individual cells are displayed in the table below:

Partial Autocorrelation Function
Time lag kPACF(k)T-STATP-value
10.1083790.91320.182108
20.0825760.69580.244414
3-0.127554-1.07480.143054
4-0.054898-0.46260.32254
5-0.097273-0.81960.207584
6-0.021787-0.18360.427431
7-0.077364-0.65190.25829
8-0.038917-0.32790.371968
90.0020270.01710.49321
10-0.061091-0.51480.304159
11-0.055526-0.46790.320654
12-0.069667-0.5870.279525
13-0.036186-0.30490.380665
140.0584280.49230.312005
15-0.02747-0.23150.408809
16-0.106042-0.89350.187297
170.0286540.24140.404954
18-0.014936-0.12590.450101
19-0.077401-0.65220.258192
200.0004770.0040.498401
21-0.02907-0.24490.403603
220.0256110.21580.414879
23-0.025299-0.21320.415902
24-0.014743-0.12420.450745
250.0746850.62930.265583
260.2928712.46780.008004
27-0.296493-2.49830.007398
280.0087530.07380.470708
290.0209860.17680.430071
30-0.075897-0.63950.262272
31-0.010378-0.08740.465283
320.0196360.16550.434528
33-0.009712-0.08180.467504
34-0.072346-0.60960.272038
35-0.055627-0.46870.320352
36-0.001953-0.01650.49346
37-0.005395-0.04550.481933
38-0.002589-0.02180.491329
39-0.005751-0.04850.480742
400.1525241.28520.101451
41-0.001178-0.00990.496055
420.0198230.1670.433909
43-0.029697-0.25020.401564
440.0488990.4120.34078
450.0634040.53430.297418
46-3e-0600.499988
470.0220280.18560.426641
48-0.001035-0.00870.496534


Parameters (Session):
par1 = 48 ; par2 = 1 ; par3 = 1 ; par4 = 0 ; par5 = 12 ; par6 = White Noise ; par7 = 0.95 ;
Parameters (R input):
par1 = 48 ; par2 = 1 ; par3 = 1 ; par4 = 0 ; par5 = 12 ; par6 = White Noise ; par7 = 0.95 ; par8 = ;
R code (references can be found in the software module):
par8 <- ''
par7 <- '0.95'
par6 <- 'White Noise'
par5 <- '12'
par4 <- '0'
par3 <- '0'
par2 <- '1'
par1 <- '48'
if (par1 == 'Default') {
par1 = 10*log10(length(x))
} else {
par1 <- as.numeric(par1)
}
par2 <- as.numeric(par2)
par3 <- as.numeric(par3)
par4 <- as.numeric(par4)
par5 <- as.numeric(par5)
if (par6 == 'White Noise') par6 <- 'white' else par6 <- 'ma'
par7 <- as.numeric(par7)
if (par8 != '') par8 <- as.numeric(par8)
ox <- x
if (par8 == '') {
if (par2 == 0) {
x <- log(x)
} else {
x <- (x ^ par2 - 1) / par2
}
} else {
x <- log(x,base=par8)
}
if (par3 > 0) x <- diff(x,lag=1,difference=par3)
if (par4 > 0) x <- diff(x,lag=par5,difference=par4)
bitmap(file='picts.png')
op <- par(mfrow=c(2,1))
plot(ox,type='l',main='Original Time Series',xlab='time',ylab='value')
if (par8=='') {
mytitle <- paste('Working Time Series (lambda=',par2,', d=',par3,', D=',par4,')',sep='')
mysub <- paste('(lambda=',par2,', d=',par3,', D=',par4,', CI=', par7, ', CI type=',par6,')',sep='')
} else {
mytitle <- paste('Working Time Series (base=',par8,', d=',par3,', D=',par4,')',sep='')
mysub <- paste('(base=',par8,', d=',par3,', D=',par4,', CI=', par7, ', CI type=',par6,')',sep='')
}
plot(x,type='l', main=mytitle,xlab='time',ylab='value')
par(op)
dev.off()
bitmap(file='pic1.png')
racf <- acf(x, par1, main='Autocorrelation', xlab='time lag', ylab='ACF', ci.type=par6, ci=par7, sub=mysub)
dev.off()
bitmap(file='pic2.png')
rpacf <- pacf(x,par1,main='Partial Autocorrelation',xlab='lags',ylab='PACF',sub=mysub)
dev.off()
(myacf <- c(racf$acf))
(mypacf <- c(rpacf$acf))
lengthx <- length(x)
sqrtn <- sqrt(lengthx)
load(file='createtable')
a<-table.start()
a<-table.row.start(a)
a<-table.element(a,'Autocorrelation Function',4,TRUE)
a<-table.row.end(a)
a<-table.row.start(a)
a<-table.element(a,'Time lag k',header=TRUE)
a<-table.element(a,hyperlink('basics.htm','ACF(k)','click here for more information about the Autocorrelation Function'),header=TRUE)
a<-table.element(a,'T-STAT',header=TRUE)
a<-table.element(a,'P-value',header=TRUE)
a<-table.row.end(a)
for (i in 2:(par1+1)) {
a<-table.row.start(a)
a<-table.element(a,i-1,header=TRUE)
a<-table.element(a,round(myacf[i],6))
mytstat <- myacf[i]*sqrtn
a<-table.element(a,round(mytstat,4))
a<-table.element(a,round(1-pt(abs(mytstat),lengthx),6))
a<-table.row.end(a)
}
a<-table.end(a)
table.save(a,file='mytable.tab')
a<-table.start()
a<-table.row.start(a)
a<-table.element(a,'Partial Autocorrelation Function',4,TRUE)
a<-table.row.end(a)
a<-table.row.start(a)
a<-table.element(a,'Time lag k',header=TRUE)
a<-table.element(a,hyperlink('basics.htm','PACF(k)','click here for more information about the Partial Autocorrelation Function'),header=TRUE)
a<-table.element(a,'T-STAT',header=TRUE)
a<-table.element(a,'P-value',header=TRUE)
a<-table.row.end(a)
for (i in 1:par1) {
a<-table.row.start(a)
a<-table.element(a,i,header=TRUE)
a<-table.element(a,round(mypacf[i],6))
mytstat <- mypacf[i]*sqrtn
a<-table.element(a,round(mytstat,4))
a<-table.element(a,round(1-pt(abs(mytstat),lengthx),6))
a<-table.row.end(a)
}
a<-table.end(a)
table.save(a,file='mytable1.tab')