Free Statistics

of Irreproducible Research!

Author's title

Author*Unverified author*
R Software Modulerwasp_twosampletests_mean.wasp
Title produced by softwarePaired and Unpaired Two Samples Tests about the Mean
Date of computationFri, 01 Nov 2013 18:07:58 -0400
Cite this page as followsStatistical Computations at FreeStatistics.org, Office for Research Development and Education, URL https://freestatistics.org/blog/index.php?v=date/2013/Nov/01/t1383343846u9hbwlgd12s61tv.htm/, Retrieved Mon, 29 Apr 2024 12:30:37 +0000
Statistical Computations at FreeStatistics.org, Office for Research Development and Education, URL https://freestatistics.org/blog/index.php?pk=221722, Retrieved Mon, 29 Apr 2024 12:30:37 +0000
QR Codes:

Original text written by user:
IsPrivate?No (this computation is public)
User-defined keywords
Estimated Impact64
Family? (F = Feedback message, R = changed R code, M = changed R Module, P = changed Parameters, D = changed Data)
-       [Paired and Unpaired Two Samples Tests about the Mean] [] [2013-11-01 22:07:58] [d41d8cd98f00b204e9800998ecf8427e] [Current]
Feedback Forum

Post a new message
Dataseries X:
52792117,596	36361044,798
9817684,280	58987856,120
27004830,074	2686941,048
13875207,231	22200509,400
40847986,206	50632268,368
57657199,379	17509460,320
33135196,435	18875537,457
7039635,987	16238483,496
8579609,420	3265808,236
32920447,802	37083270,836
27438431,426	58957430,634
54556562,144	17615360,627
16958873,113	29057116,106
57160689,248	15338592,208
30942147,512	57924863,630
28153012,700	48981537,260
36119785,686	12163566,577
9845637,610	45935987,523
19012326,326	21533386,919
41872234,131	29200765,169
33038681,382	14681808,420
1429002,988	68340235,240
36442251,000	6778449,060
19142553,224	22285123,234
10306108,416	64824345,086
32552845,124	21168774,205
27342318,448	21333969,025
9927903,168	2474425,280
19962132,886	52386211,904
10076578,476	43979764,583
34556371,040	42301947,814
14816666,092	38066037,224
19990601,747	26493078,291
23729529,338	44237870,722
12057368,840
11805589,848
3890720,530
53180992,296
18186921,663
32914142,490
32411086,961
27707941,848
23247527,828
3033894,172
7283147,700
28571004,280
38622407,926


Summary of computational transaction
Raw Inputview raw input (R code)
Raw Outputview raw output of R engine
Computing time3 seconds
R Server'Sir Ronald Aylmer Fisher' @ fisher.wessa.net

\begin{tabular}{lllllllll}
\hline
Summary of computational transaction \tabularnewline
Raw Input & view raw input (R code)  \tabularnewline
Raw Output & view raw output of R engine  \tabularnewline
Computing time & 3 seconds \tabularnewline
R Server & 'Sir Ronald Aylmer Fisher' @ fisher.wessa.net \tabularnewline
\hline
\end{tabular}
%Source: https://freestatistics.org/blog/index.php?pk=221722&T=0

[TABLE]
[ROW][C]Summary of computational transaction[/C][/ROW]
[ROW][C]Raw Input[/C][C]view raw input (R code) [/C][/ROW]
[ROW][C]Raw Output[/C][C]view raw output of R engine [/C][/ROW]
[ROW][C]Computing time[/C][C]3 seconds[/C][/ROW]
[ROW][C]R Server[/C][C]'Sir Ronald Aylmer Fisher' @ fisher.wessa.net[/C][/ROW]
[/TABLE]
Source: https://freestatistics.org/blog/index.php?pk=221722&T=0

Globally Unique Identifier (entire table): ba.freestatistics.org/blog/index.php?pk=221722&T=0

As an alternative you can also use a QR Code:  

The GUIDs for individual cells are displayed in the table below:

Summary of computational transaction
Raw Inputview raw input (R code)
Raw Outputview raw output of R engine
Computing time3 seconds
R Server'Sir Ronald Aylmer Fisher' @ fisher.wessa.net


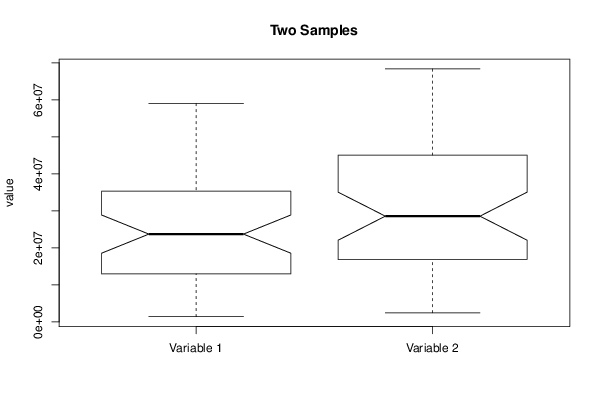
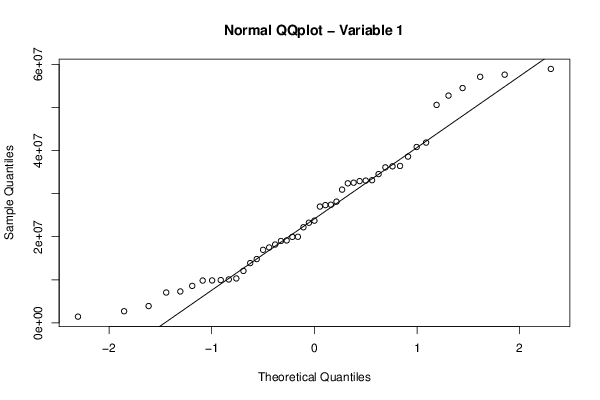
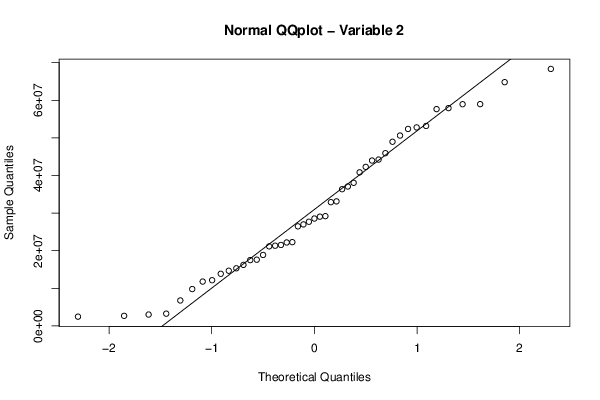
Two Sample t-test (unpaired)
Mean of Sample 126023838.7050426
Mean of Sample 231111608.7862766
t-stat-1.44413347470028
df92
p-value0.152098415387536
H0 value0
Alternativetwo.sided
CI Level0.95
CI[-12084872.9939198,1909332.83145167]
F-test to compare two variances
F-stat0.727263078993337
df46
p-value0.283775381650588
H0 value1
Alternativetwo.sided
CI Level0.95
CI[0.405087551136266,1.30567227895125]

\begin{tabular}{lllllllll}
\hline
Two Sample t-test (unpaired) \tabularnewline
Mean of Sample 1 & 26023838.7050426 \tabularnewline
Mean of Sample 2 & 31111608.7862766 \tabularnewline
t-stat & -1.44413347470028 \tabularnewline
df & 92 \tabularnewline
p-value & 0.152098415387536 \tabularnewline
H0 value & 0 \tabularnewline
Alternative & two.sided \tabularnewline
CI Level & 0.95 \tabularnewline
CI & [-12084872.9939198,1909332.83145167] \tabularnewline
F-test to compare two variances \tabularnewline
F-stat & 0.727263078993337 \tabularnewline
df & 46 \tabularnewline
p-value & 0.283775381650588 \tabularnewline
H0 value & 1 \tabularnewline
Alternative & two.sided \tabularnewline
CI Level & 0.95 \tabularnewline
CI & [0.405087551136266,1.30567227895125] \tabularnewline
\hline
\end{tabular}
%Source: https://freestatistics.org/blog/index.php?pk=221722&T=1

[TABLE]
[ROW][C]Two Sample t-test (unpaired)[/C][/ROW]
[ROW][C]Mean of Sample 1[/C][C]26023838.7050426[/C][/ROW]
[ROW][C]Mean of Sample 2[/C][C]31111608.7862766[/C][/ROW]
[ROW][C]t-stat[/C][C]-1.44413347470028[/C][/ROW]
[ROW][C]df[/C][C]92[/C][/ROW]
[ROW][C]p-value[/C][C]0.152098415387536[/C][/ROW]
[ROW][C]H0 value[/C][C]0[/C][/ROW]
[ROW][C]Alternative[/C][C]two.sided[/C][/ROW]
[ROW][C]CI Level[/C][C]0.95[/C][/ROW]
[ROW][C]CI[/C][C][-12084872.9939198,1909332.83145167][/C][/ROW]
[ROW][C]F-test to compare two variances[/C][/ROW]
[ROW][C]F-stat[/C][C]0.727263078993337[/C][/ROW]
[ROW][C]df[/C][C]46[/C][/ROW]
[ROW][C]p-value[/C][C]0.283775381650588[/C][/ROW]
[ROW][C]H0 value[/C][C]1[/C][/ROW]
[ROW][C]Alternative[/C][C]two.sided[/C][/ROW]
[ROW][C]CI Level[/C][C]0.95[/C][/ROW]
[ROW][C]CI[/C][C][0.405087551136266,1.30567227895125][/C][/ROW]
[/TABLE]
Source: https://freestatistics.org/blog/index.php?pk=221722&T=1

Globally Unique Identifier (entire table): ba.freestatistics.org/blog/index.php?pk=221722&T=1

As an alternative you can also use a QR Code:  

The GUIDs for individual cells are displayed in the table below:

Two Sample t-test (unpaired)
Mean of Sample 126023838.7050426
Mean of Sample 231111608.7862766
t-stat-1.44413347470028
df92
p-value0.152098415387536
H0 value0
Alternativetwo.sided
CI Level0.95
CI[-12084872.9939198,1909332.83145167]
F-test to compare two variances
F-stat0.727263078993337
df46
p-value0.283775381650588
H0 value1
Alternativetwo.sided
CI Level0.95
CI[0.405087551136266,1.30567227895125]


Welch Two Sample t-test (unpaired)
Mean of Sample 126023838.7050426
Mean of Sample 231111608.7862766
t-stat-1.44413347470028
df89.7619832808702
p-value0.152182896281065
H0 value0
Alternativetwo.sided
CI Level0.95
CI[-12087198.1996319,1911658.03716386]

\begin{tabular}{lllllllll}
\hline
Welch Two Sample t-test (unpaired) \tabularnewline
Mean of Sample 1 & 26023838.7050426 \tabularnewline
Mean of Sample 2 & 31111608.7862766 \tabularnewline
t-stat & -1.44413347470028 \tabularnewline
df & 89.7619832808702 \tabularnewline
p-value & 0.152182896281065 \tabularnewline
H0 value & 0 \tabularnewline
Alternative & two.sided \tabularnewline
CI Level & 0.95 \tabularnewline
CI & [-12087198.1996319,1911658.03716386] \tabularnewline
\hline
\end{tabular}
%Source: https://freestatistics.org/blog/index.php?pk=221722&T=2

[TABLE]
[ROW][C]Welch Two Sample t-test (unpaired)[/C][/ROW]
[ROW][C]Mean of Sample 1[/C][C]26023838.7050426[/C][/ROW]
[ROW][C]Mean of Sample 2[/C][C]31111608.7862766[/C][/ROW]
[ROW][C]t-stat[/C][C]-1.44413347470028[/C][/ROW]
[ROW][C]df[/C][C]89.7619832808702[/C][/ROW]
[ROW][C]p-value[/C][C]0.152182896281065[/C][/ROW]
[ROW][C]H0 value[/C][C]0[/C][/ROW]
[ROW][C]Alternative[/C][C]two.sided[/C][/ROW]
[ROW][C]CI Level[/C][C]0.95[/C][/ROW]
[ROW][C]CI[/C][C][-12087198.1996319,1911658.03716386][/C][/ROW]
[/TABLE]
Source: https://freestatistics.org/blog/index.php?pk=221722&T=2

Globally Unique Identifier (entire table): ba.freestatistics.org/blog/index.php?pk=221722&T=2

As an alternative you can also use a QR Code:  

The GUIDs for individual cells are displayed in the table below:

Welch Two Sample t-test (unpaired)
Mean of Sample 126023838.7050426
Mean of Sample 231111608.7862766
t-stat-1.44413347470028
df89.7619832808702
p-value0.152182896281065
H0 value0
Alternativetwo.sided
CI Level0.95
CI[-12087198.1996319,1911658.03716386]


Wicoxon rank sum test with continuity correction (unpaired)
W933.5
p-value0.19727136331097
H0 value0
Alternativetwo.sided
Kolmogorov-Smirnov Test to compare Distributions of two Samples
KS Statistic0.191489361702128
p-value0.354893929935333
Kolmogorov-Smirnov Test to compare Distributional Shape of two Samples
KS Statistic0.127659574468085
p-value0.843910830823568

\begin{tabular}{lllllllll}
\hline
Wicoxon rank sum test with continuity correction (unpaired) \tabularnewline
W & 933.5 \tabularnewline
p-value & 0.19727136331097 \tabularnewline
H0 value & 0 \tabularnewline
Alternative & two.sided \tabularnewline
Kolmogorov-Smirnov Test to compare Distributions of two Samples \tabularnewline
KS Statistic & 0.191489361702128 \tabularnewline
p-value & 0.354893929935333 \tabularnewline
Kolmogorov-Smirnov Test to compare Distributional Shape of two Samples \tabularnewline
KS Statistic & 0.127659574468085 \tabularnewline
p-value & 0.843910830823568 \tabularnewline
\hline
\end{tabular}
%Source: https://freestatistics.org/blog/index.php?pk=221722&T=3

[TABLE]
[ROW][C]Wicoxon rank sum test with continuity correction (unpaired)[/C][/ROW]
[ROW][C]W[/C][C]933.5[/C][/ROW]
[ROW][C]p-value[/C][C]0.19727136331097[/C][/ROW]
[ROW][C]H0 value[/C][C]0[/C][/ROW]
[ROW][C]Alternative[/C][C]two.sided[/C][/ROW]
[ROW][C]Kolmogorov-Smirnov Test to compare Distributions of two Samples[/C][/ROW]
[ROW][C]KS Statistic[/C][C]0.191489361702128[/C][/ROW]
[ROW][C]p-value[/C][C]0.354893929935333[/C][/ROW]
[ROW][C]Kolmogorov-Smirnov Test to compare Distributional Shape of two Samples[/C][/ROW]
[ROW][C]KS Statistic[/C][C]0.127659574468085[/C][/ROW]
[ROW][C]p-value[/C][C]0.843910830823568[/C][/ROW]
[/TABLE]
Source: https://freestatistics.org/blog/index.php?pk=221722&T=3

Globally Unique Identifier (entire table): ba.freestatistics.org/blog/index.php?pk=221722&T=3

As an alternative you can also use a QR Code:  

The GUIDs for individual cells are displayed in the table below:

Wicoxon rank sum test with continuity correction (unpaired)
W933.5
p-value0.19727136331097
H0 value0
Alternativetwo.sided
Kolmogorov-Smirnov Test to compare Distributions of two Samples
KS Statistic0.191489361702128
p-value0.354893929935333
Kolmogorov-Smirnov Test to compare Distributional Shape of two Samples
KS Statistic0.127659574468085
p-value0.843910830823568


Parameters (Session):
par1 = two.sided ; par2 = 1 ; par3 = 2 ; par4 = Wilcoxon-Mann_Whitney ; par5 = unpaired ; par6 = 0.0 ; par7 = 0.95 ; par8 = TRUE ;
Parameters (R input):
par1 = 1 ; par2 = 2 ; par3 = 0.95 ; par4 = two.sided ; par5 = unpaired ; par6 = 0.0 ;
R code (references can be found in the software module):
par1 <- as.numeric(par1) #column number of first sample
par2 <- as.numeric(par2) #column number of second sample
par3 <- as.numeric(par3) #confidence (= 1 - alpha)
if (par5 == 'unpaired') paired <- FALSE else paired <- TRUE
par6 <- as.numeric(par6) #H0
z <- t(y)
if (par1 == par2) stop('Please, select two different column numbers')
if (par1 < 1) stop('Please, select a column number greater than zero for the first sample')
if (par2 < 1) stop('Please, select a column number greater than zero for the second sample')
if (par1 > length(z[1,])) stop('The column number for the first sample should be smaller')
if (par2 > length(z[1,])) stop('The column number for the second sample should be smaller')
if (par3 <= 0) stop('The confidence level should be larger than zero')
if (par3 >= 1) stop('The confidence level should be smaller than zero')
(r.t <- t.test(z[,par1],z[,par2],var.equal=TRUE,alternative=par4,paired=paired,mu=par6,conf.level=par3))
(v.t <- var.test(z[,par1],z[,par2],conf.level=par3))
(r.w <- t.test(z[,par1],z[,par2],var.equal=FALSE,alternative=par4,paired=paired,mu=par6,conf.level=par3))
(w.t <- wilcox.test(z[,par1],z[,par2],alternative=par4,paired=paired,mu=par6,conf.level=par3))
(ks.t <- ks.test(z[,par1],z[,par2],alternative=par4))
m1 <- mean(z[,par1],na.rm=T)
m2 <- mean(z[,par2],na.rm=T)
mdiff <- m1 - m2
newsam1 <- z[!is.na(z[,par1]),par1]
newsam2 <- z[,par2]+mdiff
newsam2 <- newsam2[!is.na(newsam2)]
(ks1.t <- ks.test(newsam1,newsam2,alternative=par4))
mydf <- data.frame(cbind(z[,par1],z[,par2]))
colnames(mydf) <- c('Variable 1','Variable 2')
bitmap(file='test1.png')
boxplot(mydf, notch=TRUE, ylab='value',main=main)
dev.off()
bitmap(file='test2.png')
qqnorm(z[,par1],main='Normal QQplot - Variable 1')
qqline(z[,par1])
dev.off()
bitmap(file='test3.png')
qqnorm(z[,par2],main='Normal QQplot - Variable 2')
qqline(z[,par2])
dev.off()
load(file='createtable')
a<-table.start()
a<-table.row.start(a)
a<-table.element(a,paste('Two Sample t-test (',par5,')',sep=''),2,TRUE)
a<-table.row.end(a)
if(!paired){
a<-table.row.start(a)
a<-table.element(a,'Mean of Sample 1',header=TRUE)
a<-table.element(a,r.t$estimate[[1]])
a<-table.row.end(a)
a<-table.row.start(a)
a<-table.element(a,'Mean of Sample 2',header=TRUE)
a<-table.element(a,r.t$estimate[[2]])
a<-table.row.end(a)
} else {
a<-table.row.start(a)
a<-table.element(a,'Difference: Mean1 - Mean2',header=TRUE)
a<-table.element(a,r.t$estimate)
a<-table.row.end(a)
}
a<-table.row.start(a)
a<-table.element(a,'t-stat',header=TRUE)
a<-table.element(a,r.t$statistic[[1]])
a<-table.row.end(a)
a<-table.row.start(a)
a<-table.element(a,'df',header=TRUE)
a<-table.element(a,r.t$parameter[[1]])
a<-table.row.end(a)
a<-table.row.start(a)
a<-table.element(a,'p-value',header=TRUE)
a<-table.element(a,r.t$p.value)
a<-table.row.end(a)
a<-table.row.start(a)
a<-table.element(a,'H0 value',header=TRUE)
a<-table.element(a,r.t$null.value[[1]])
a<-table.row.end(a)
a<-table.row.start(a)
a<-table.element(a,'Alternative',header=TRUE)
a<-table.element(a,r.t$alternative)
a<-table.row.end(a)
a<-table.row.start(a)
a<-table.element(a,'CI Level',header=TRUE)
a<-table.element(a,attr(r.t$conf.int,'conf.level'))
a<-table.row.end(a)
a<-table.row.start(a)
a<-table.element(a,'CI',header=TRUE)
a<-table.element(a,paste('[',r.t$conf.int[1],',',r.t$conf.int[2],']',sep=''))
a<-table.row.end(a)
a<-table.row.start(a)
a<-table.element(a,'F-test to compare two variances',2,TRUE)
a<-table.row.end(a)
a<-table.row.start(a)
a<-table.element(a,'F-stat',header=TRUE)
a<-table.element(a,v.t$statistic[[1]])
a<-table.row.end(a)
a<-table.row.start(a)
a<-table.element(a,'df',header=TRUE)
a<-table.element(a,v.t$parameter[[1]])
a<-table.row.end(a)
a<-table.row.start(a)
a<-table.element(a,'p-value',header=TRUE)
a<-table.element(a,v.t$p.value)
a<-table.row.end(a)
a<-table.row.start(a)
a<-table.element(a,'H0 value',header=TRUE)
a<-table.element(a,v.t$null.value[[1]])
a<-table.row.end(a)
a<-table.row.start(a)
a<-table.element(a,'Alternative',header=TRUE)
a<-table.element(a,v.t$alternative)
a<-table.row.end(a)
a<-table.row.start(a)
a<-table.element(a,'CI Level',header=TRUE)
a<-table.element(a,attr(v.t$conf.int,'conf.level'))
a<-table.row.end(a)
a<-table.row.start(a)
a<-table.element(a,'CI',header=TRUE)
a<-table.element(a,paste('[',v.t$conf.int[1],',',v.t$conf.int[2],']',sep=''))
a<-table.row.end(a)
a<-table.end(a)
table.save(a,file='mytable.tab')
a<-table.start()
a<-table.row.start(a)
a<-table.element(a,paste('Welch Two Sample t-test (',par5,')',sep=''),2,TRUE)
a<-table.row.end(a)
if(!paired){
a<-table.row.start(a)
a<-table.element(a,'Mean of Sample 1',header=TRUE)
a<-table.element(a,r.w$estimate[[1]])
a<-table.row.end(a)
a<-table.row.start(a)
a<-table.element(a,'Mean of Sample 2',header=TRUE)
a<-table.element(a,r.w$estimate[[2]])
a<-table.row.end(a)
} else {
a<-table.row.start(a)
a<-table.element(a,'Difference: Mean1 - Mean2',header=TRUE)
a<-table.element(a,r.w$estimate)
a<-table.row.end(a)
}
a<-table.row.start(a)
a<-table.element(a,'t-stat',header=TRUE)
a<-table.element(a,r.w$statistic[[1]])
a<-table.row.end(a)
a<-table.row.start(a)
a<-table.element(a,'df',header=TRUE)
a<-table.element(a,r.w$parameter[[1]])
a<-table.row.end(a)
a<-table.row.start(a)
a<-table.element(a,'p-value',header=TRUE)
a<-table.element(a,r.w$p.value)
a<-table.row.end(a)
a<-table.row.start(a)
a<-table.element(a,'H0 value',header=TRUE)
a<-table.element(a,r.w$null.value[[1]])
a<-table.row.end(a)
a<-table.row.start(a)
a<-table.element(a,'Alternative',header=TRUE)
a<-table.element(a,r.w$alternative)
a<-table.row.end(a)
a<-table.row.start(a)
a<-table.element(a,'CI Level',header=TRUE)
a<-table.element(a,attr(r.w$conf.int,'conf.level'))
a<-table.row.end(a)
a<-table.row.start(a)
a<-table.element(a,'CI',header=TRUE)
a<-table.element(a,paste('[',r.w$conf.int[1],',',r.w$conf.int[2],']',sep=''))
a<-table.row.end(a)
a<-table.end(a)
table.save(a,file='mytable1.tab')
a<-table.start()
a<-table.row.start(a)
a<-table.element(a,paste('Wicoxon rank sum test with continuity correction (',par5,')',sep=''),2,TRUE)
a<-table.row.end(a)
a<-table.row.start(a)
a<-table.element(a,'W',header=TRUE)
a<-table.element(a,w.t$statistic[[1]])
a<-table.row.end(a)
a<-table.row.start(a)
a<-table.element(a,'p-value',header=TRUE)
a<-table.element(a,w.t$p.value)
a<-table.row.end(a)
a<-table.row.start(a)
a<-table.element(a,'H0 value',header=TRUE)
a<-table.element(a,w.t$null.value[[1]])
a<-table.row.end(a)
a<-table.row.start(a)
a<-table.element(a,'Alternative',header=TRUE)
a<-table.element(a,w.t$alternative)
a<-table.row.end(a)
a<-table.row.start(a)
a<-table.element(a,'Kolmogorov-Smirnov Test to compare Distributions of two Samples',2,TRUE)
a<-table.row.end(a)
a<-table.row.start(a)
a<-table.element(a,'KS Statistic',header=TRUE)
a<-table.element(a,ks.t$statistic[[1]])
a<-table.row.end(a)
a<-table.row.start(a)
a<-table.element(a,'p-value',header=TRUE)
a<-table.element(a,ks.t$p.value)
a<-table.row.end(a)
a<-table.row.start(a)
a<-table.element(a,'Kolmogorov-Smirnov Test to compare Distributional Shape of two Samples',2,TRUE)
a<-table.row.end(a)
a<-table.row.start(a)
a<-table.element(a,'KS Statistic',header=TRUE)
a<-table.element(a,ks1.t$statistic[[1]])
a<-table.row.end(a)
a<-table.row.start(a)
a<-table.element(a,'p-value',header=TRUE)
a<-table.element(a,ks1.t$p.value)
a<-table.row.end(a)
a<-table.end(a)
table.save(a,file='mytable2.tab')