Free Statistics

of Irreproducible Research!

Author's title

Author*The author of this computation has been verified*
R Software Modulerwasp_exponentialsmoothing.wasp
Title produced by softwareExponential Smoothing
Date of computationThu, 14 Nov 2013 07:20:25 -0500
Cite this page as followsStatistical Computations at FreeStatistics.org, Office for Research Development and Education, URL https://freestatistics.org/blog/index.php?v=date/2013/Nov/14/t13844316358m7r69xrcn04dd8.htm/, Retrieved Mon, 29 Apr 2024 13:11:33 +0000
Statistical Computations at FreeStatistics.org, Office for Research Development and Education, URL https://freestatistics.org/blog/index.php?pk=225299, Retrieved Mon, 29 Apr 2024 13:11:33 +0000
QR Codes:

Original text written by user:
IsPrivate?No (this computation is public)
User-defined keywords
Estimated Impact58
Family? (F = Feedback message, R = changed R code, M = changed R Module, P = changed Parameters, D = changed Data)
-       [Exponential Smoothing] [zdqs] [2013-11-14 12:20:25] [e931f330ae8eb739e69629b6955c783c] [Current]
Feedback Forum

Post a new message
Dataseries X:
1045620
1050293
1030185
1015746
999514
990204
962206
947314
958768


Summary of computational transaction
Raw Inputview raw input (R code)
Raw Outputview raw output of R engine
Computing time3 seconds
R Server'Gwilym Jenkins' @ jenkins.wessa.net

\begin{tabular}{lllllllll}
\hline
Summary of computational transaction \tabularnewline
Raw Input & view raw input (R code)  \tabularnewline
Raw Output & view raw output of R engine  \tabularnewline
Computing time & 3 seconds \tabularnewline
R Server & 'Gwilym Jenkins' @ jenkins.wessa.net \tabularnewline
\hline
\end{tabular}
%Source: https://freestatistics.org/blog/index.php?pk=225299&T=0

[TABLE]
[ROW][C]Summary of computational transaction[/C][/ROW]
[ROW][C]Raw Input[/C][C]view raw input (R code) [/C][/ROW]
[ROW][C]Raw Output[/C][C]view raw output of R engine [/C][/ROW]
[ROW][C]Computing time[/C][C]3 seconds[/C][/ROW]
[ROW][C]R Server[/C][C]'Gwilym Jenkins' @ jenkins.wessa.net[/C][/ROW]
[/TABLE]
Source: https://freestatistics.org/blog/index.php?pk=225299&T=0

Globally Unique Identifier (entire table): ba.freestatistics.org/blog/index.php?pk=225299&T=0

As an alternative you can also use a QR Code:  

The GUIDs for individual cells are displayed in the table below:

Summary of computational transaction
Raw Inputview raw input (R code)
Raw Outputview raw output of R engine
Computing time3 seconds
R Server'Gwilym Jenkins' @ jenkins.wessa.net


Estimated Parameters of Exponential Smoothing
ParameterValue
alpha0.999933083789849
betaFALSE
gammaFALSE

\begin{tabular}{lllllllll}
\hline
Estimated Parameters of Exponential Smoothing \tabularnewline
Parameter & Value \tabularnewline
alpha & 0.999933083789849 \tabularnewline
beta & FALSE \tabularnewline
gamma & FALSE \tabularnewline
\hline
\end{tabular}
%Source: https://freestatistics.org/blog/index.php?pk=225299&T=1

[TABLE]
[ROW][C]Estimated Parameters of Exponential Smoothing[/C][/ROW]
[ROW][C]Parameter[/C][C]Value[/C][/ROW]
[ROW][C]alpha[/C][C]0.999933083789849[/C][/ROW]
[ROW][C]beta[/C][C]FALSE[/C][/ROW]
[ROW][C]gamma[/C][C]FALSE[/C][/ROW]
[/TABLE]
Source: https://freestatistics.org/blog/index.php?pk=225299&T=1

Globally Unique Identifier (entire table): ba.freestatistics.org/blog/index.php?pk=225299&T=1

As an alternative you can also use a QR Code:  

The GUIDs for individual cells are displayed in the table below:

Estimated Parameters of Exponential Smoothing
ParameterValue
alpha0.999933083789849
betaFALSE
gammaFALSE


Interpolation Forecasts of Exponential Smoothing
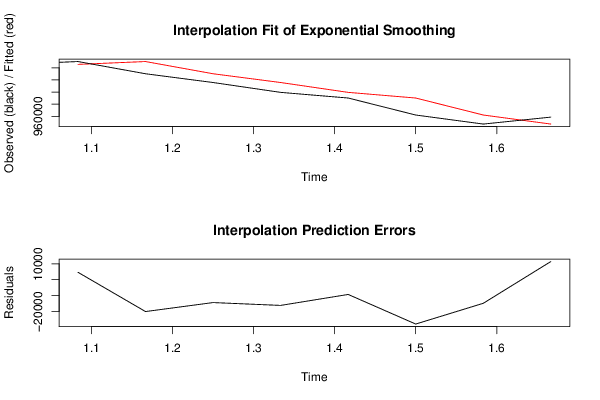
tObservedFittedResiduals
2105029310456204673
310301851050292.68730055-20107.6873005501
410157461030186.34553023-14440.345530229
59995141015746.9662932-16232.9662931962
6990204999515.086248584-9311.08624858386
7962206990204.623062604-27998.6230626041
8947314962207.873561745-14893.8735617448
9958768947314.99664157311453.0033584267

\begin{tabular}{lllllllll}
\hline
Interpolation Forecasts of Exponential Smoothing \tabularnewline
t & Observed & Fitted & Residuals \tabularnewline
2 & 1050293 & 1045620 & 4673 \tabularnewline
3 & 1030185 & 1050292.68730055 & -20107.6873005501 \tabularnewline
4 & 1015746 & 1030186.34553023 & -14440.345530229 \tabularnewline
5 & 999514 & 1015746.9662932 & -16232.9662931962 \tabularnewline
6 & 990204 & 999515.086248584 & -9311.08624858386 \tabularnewline
7 & 962206 & 990204.623062604 & -27998.6230626041 \tabularnewline
8 & 947314 & 962207.873561745 & -14893.8735617448 \tabularnewline
9 & 958768 & 947314.996641573 & 11453.0033584267 \tabularnewline
\hline
\end{tabular}
%Source: https://freestatistics.org/blog/index.php?pk=225299&T=2

[TABLE]
[ROW][C]Interpolation Forecasts of Exponential Smoothing[/C][/ROW]
[ROW][C]t[/C][C]Observed[/C][C]Fitted[/C][C]Residuals[/C][/ROW]
[ROW][C]2[/C][C]1050293[/C][C]1045620[/C][C]4673[/C][/ROW]
[ROW][C]3[/C][C]1030185[/C][C]1050292.68730055[/C][C]-20107.6873005501[/C][/ROW]
[ROW][C]4[/C][C]1015746[/C][C]1030186.34553023[/C][C]-14440.345530229[/C][/ROW]
[ROW][C]5[/C][C]999514[/C][C]1015746.9662932[/C][C]-16232.9662931962[/C][/ROW]
[ROW][C]6[/C][C]990204[/C][C]999515.086248584[/C][C]-9311.08624858386[/C][/ROW]
[ROW][C]7[/C][C]962206[/C][C]990204.623062604[/C][C]-27998.6230626041[/C][/ROW]
[ROW][C]8[/C][C]947314[/C][C]962207.873561745[/C][C]-14893.8735617448[/C][/ROW]
[ROW][C]9[/C][C]958768[/C][C]947314.996641573[/C][C]11453.0033584267[/C][/ROW]
[/TABLE]
Source: https://freestatistics.org/blog/index.php?pk=225299&T=2

Globally Unique Identifier (entire table): ba.freestatistics.org/blog/index.php?pk=225299&T=2

As an alternative you can also use a QR Code:  

The GUIDs for individual cells are displayed in the table below:

Interpolation Forecasts of Exponential Smoothing
tObservedFittedResiduals
2105029310456204673
310301851050292.68730055-20107.6873005501
410157461030186.34553023-14440.345530229
59995141015746.9662932-16232.9662931962
6990204999515.086248584-9311.08624858386
7962206990204.623062604-27998.6230626041
8947314962207.873561745-14893.8735617448
9958768947314.99664157311453.0033584267


Extrapolation Forecasts of Exponential Smoothing
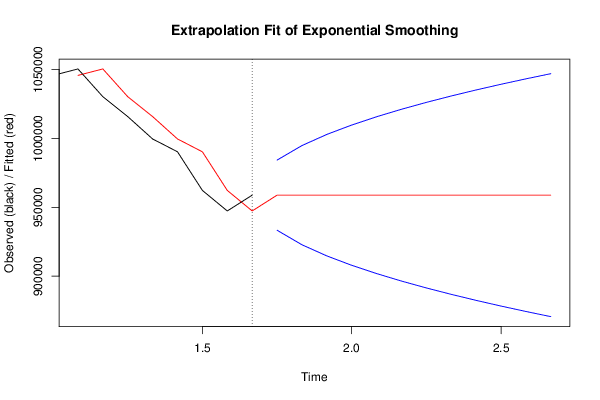
tForecast95% Lower Bound95% Upper Bound
10958767.23360842933333.455473689984201.011743151
11958767.23360842922799.643055451994734.82416139
12958767.23360842914716.602850561002817.86436628
13958767.23360842907902.2302156681009632.23700117
14958767.23360842901898.6212627331015635.84595411
15958767.23360842896470.9289820351021063.53823481
16958767.23360842891479.6413637671026054.82585307
17958767.23360842886833.8576966641030700.60952018
18958767.23360842882470.4376728021035064.02954404
19958767.23360842878343.4089665841039191.05825026
20958767.23360842874418.0660369491043116.40117989
21958767.23360842870667.4460378511046867.02117899

\begin{tabular}{lllllllll}
\hline
Extrapolation Forecasts of Exponential Smoothing \tabularnewline
t & Forecast & 95% Lower Bound & 95% Upper Bound \tabularnewline
10 & 958767.23360842 & 933333.455473689 & 984201.011743151 \tabularnewline
11 & 958767.23360842 & 922799.643055451 & 994734.82416139 \tabularnewline
12 & 958767.23360842 & 914716.60285056 & 1002817.86436628 \tabularnewline
13 & 958767.23360842 & 907902.230215668 & 1009632.23700117 \tabularnewline
14 & 958767.23360842 & 901898.621262733 & 1015635.84595411 \tabularnewline
15 & 958767.23360842 & 896470.928982035 & 1021063.53823481 \tabularnewline
16 & 958767.23360842 & 891479.641363767 & 1026054.82585307 \tabularnewline
17 & 958767.23360842 & 886833.857696664 & 1030700.60952018 \tabularnewline
18 & 958767.23360842 & 882470.437672802 & 1035064.02954404 \tabularnewline
19 & 958767.23360842 & 878343.408966584 & 1039191.05825026 \tabularnewline
20 & 958767.23360842 & 874418.066036949 & 1043116.40117989 \tabularnewline
21 & 958767.23360842 & 870667.446037851 & 1046867.02117899 \tabularnewline
\hline
\end{tabular}
%Source: https://freestatistics.org/blog/index.php?pk=225299&T=3

[TABLE]
[ROW][C]Extrapolation Forecasts of Exponential Smoothing[/C][/ROW]
[ROW][C]t[/C][C]Forecast[/C][C]95% Lower Bound[/C][C]95% Upper Bound[/C][/ROW]
[ROW][C]10[/C][C]958767.23360842[/C][C]933333.455473689[/C][C]984201.011743151[/C][/ROW]
[ROW][C]11[/C][C]958767.23360842[/C][C]922799.643055451[/C][C]994734.82416139[/C][/ROW]
[ROW][C]12[/C][C]958767.23360842[/C][C]914716.60285056[/C][C]1002817.86436628[/C][/ROW]
[ROW][C]13[/C][C]958767.23360842[/C][C]907902.230215668[/C][C]1009632.23700117[/C][/ROW]
[ROW][C]14[/C][C]958767.23360842[/C][C]901898.621262733[/C][C]1015635.84595411[/C][/ROW]
[ROW][C]15[/C][C]958767.23360842[/C][C]896470.928982035[/C][C]1021063.53823481[/C][/ROW]
[ROW][C]16[/C][C]958767.23360842[/C][C]891479.641363767[/C][C]1026054.82585307[/C][/ROW]
[ROW][C]17[/C][C]958767.23360842[/C][C]886833.857696664[/C][C]1030700.60952018[/C][/ROW]
[ROW][C]18[/C][C]958767.23360842[/C][C]882470.437672802[/C][C]1035064.02954404[/C][/ROW]
[ROW][C]19[/C][C]958767.23360842[/C][C]878343.408966584[/C][C]1039191.05825026[/C][/ROW]
[ROW][C]20[/C][C]958767.23360842[/C][C]874418.066036949[/C][C]1043116.40117989[/C][/ROW]
[ROW][C]21[/C][C]958767.23360842[/C][C]870667.446037851[/C][C]1046867.02117899[/C][/ROW]
[/TABLE]
Source: https://freestatistics.org/blog/index.php?pk=225299&T=3

Globally Unique Identifier (entire table): ba.freestatistics.org/blog/index.php?pk=225299&T=3

As an alternative you can also use a QR Code:  

The GUIDs for individual cells are displayed in the table below:

Extrapolation Forecasts of Exponential Smoothing
tForecast95% Lower Bound95% Upper Bound
10958767.23360842933333.455473689984201.011743151
11958767.23360842922799.643055451994734.82416139
12958767.23360842914716.602850561002817.86436628
13958767.23360842907902.2302156681009632.23700117
14958767.23360842901898.6212627331015635.84595411
15958767.23360842896470.9289820351021063.53823481
16958767.23360842891479.6413637671026054.82585307
17958767.23360842886833.8576966641030700.60952018
18958767.23360842882470.4376728021035064.02954404
19958767.23360842878343.4089665841039191.05825026
20958767.23360842874418.0660369491043116.40117989
21958767.23360842870667.4460378511046867.02117899


Parameters (Session):
par1 = 12 ; par2 = Single ; par3 = additive ;
Parameters (R input):
par1 = 12 ; par2 = Single ; par3 = additive ;
R code (references can be found in the software module):
par1 <- as.numeric(par1)
if (par2 == 'Single') K <- 1
if (par2 == 'Double') K <- 2
if (par2 == 'Triple') K <- par1
nx <- length(x)
nxmK <- nx - K
x <- ts(x, frequency = par1)
if (par2 == 'Single') fit <- HoltWinters(x, gamma=F, beta=F)
if (par2 == 'Double') fit <- HoltWinters(x, gamma=F)
if (par2 == 'Triple') fit <- HoltWinters(x, seasonal=par3)
fit
myresid <- x - fit$fitted[,'xhat']
bitmap(file='test1.png')
op <- par(mfrow=c(2,1))
plot(fit,ylab='Observed (black) / Fitted (red)',main='Interpolation Fit of Exponential Smoothing')
plot(myresid,ylab='Residuals',main='Interpolation Prediction Errors')
par(op)
dev.off()
bitmap(file='test2.png')
p <- predict(fit, par1, prediction.interval=TRUE)
np <- length(p[,1])
plot(fit,p,ylab='Observed (black) / Fitted (red)',main='Extrapolation Fit of Exponential Smoothing')
dev.off()
bitmap(file='test3.png')
op <- par(mfrow = c(2,2))
acf(as.numeric(myresid),lag.max = nx/2,main='Residual ACF')
spectrum(myresid,main='Residals Periodogram')
cpgram(myresid,main='Residal Cumulative Periodogram')
qqnorm(myresid,main='Residual Normal QQ Plot')
qqline(myresid)
par(op)
dev.off()
load(file='createtable')
a<-table.start()
a<-table.row.start(a)
a<-table.element(a,'Estimated Parameters of Exponential Smoothing',2,TRUE)
a<-table.row.end(a)
a<-table.row.start(a)
a<-table.element(a,'Parameter',header=TRUE)
a<-table.element(a,'Value',header=TRUE)
a<-table.row.end(a)
a<-table.row.start(a)
a<-table.element(a,'alpha',header=TRUE)
a<-table.element(a,fit$alpha)
a<-table.row.end(a)
a<-table.row.start(a)
a<-table.element(a,'beta',header=TRUE)
a<-table.element(a,fit$beta)
a<-table.row.end(a)
a<-table.row.start(a)
a<-table.element(a,'gamma',header=TRUE)
a<-table.element(a,fit$gamma)
a<-table.row.end(a)
a<-table.end(a)
table.save(a,file='mytable.tab')
a<-table.start()
a<-table.row.start(a)
a<-table.element(a,'Interpolation Forecasts of Exponential Smoothing',4,TRUE)
a<-table.row.end(a)
a<-table.row.start(a)
a<-table.element(a,'t',header=TRUE)
a<-table.element(a,'Observed',header=TRUE)
a<-table.element(a,'Fitted',header=TRUE)
a<-table.element(a,'Residuals',header=TRUE)
a<-table.row.end(a)
for (i in 1:nxmK) {
a<-table.row.start(a)
a<-table.element(a,i+K,header=TRUE)
a<-table.element(a,x[i+K])
a<-table.element(a,fit$fitted[i,'xhat'])
a<-table.element(a,myresid[i])
a<-table.row.end(a)
}
a<-table.end(a)
table.save(a,file='mytable1.tab')
a<-table.start()
a<-table.row.start(a)
a<-table.element(a,'Extrapolation Forecasts of Exponential Smoothing',4,TRUE)
a<-table.row.end(a)
a<-table.row.start(a)
a<-table.element(a,'t',header=TRUE)
a<-table.element(a,'Forecast',header=TRUE)
a<-table.element(a,'95% Lower Bound',header=TRUE)
a<-table.element(a,'95% Upper Bound',header=TRUE)
a<-table.row.end(a)
for (i in 1:np) {
a<-table.row.start(a)
a<-table.element(a,nx+i,header=TRUE)
a<-table.element(a,p[i,'fit'])
a<-table.element(a,p[i,'lwr'])
a<-table.element(a,p[i,'upr'])
a<-table.row.end(a)
}
a<-table.end(a)
table.save(a,file='mytable2.tab')