Free Statistics

of Irreproducible Research!

Author's title

Author*Unverified author*
R Software Modulerwasp_centraltendency.wasp
Title produced by softwareCentral Tendency
Date of computationWed, 09 Oct 2013 10:47:19 -0400
Cite this page as followsStatistical Computations at FreeStatistics.org, Office for Research Development and Education, URL https://freestatistics.org/blog/index.php?v=date/2013/Oct/09/t1381330048t76w99gd1q9yh02.htm/, Retrieved Sun, 28 Apr 2024 22:19:10 +0000
Statistical Computations at FreeStatistics.org, Office for Research Development and Education, URL https://freestatistics.org/blog/index.php?pk=214442, Retrieved Sun, 28 Apr 2024 22:19:10 +0000
QR Codes:

Original text written by user:
IsPrivate?No (this computation is public)
User-defined keywords
Estimated Impact71
Family? (F = Feedback message, R = changed R code, M = changed R Module, P = changed Parameters, D = changed Data)
-       [Central Tendency] [] [2013-10-09 14:47:19] [27a1831061bd99e933e6c6e7cff94cc2] [Current]
Feedback Forum

Post a new message
Dataseries X:
339
139
186
155
153
222
102
107
188
162
185
24
394
209
248
254
202
258
215
309
240
258
276
48
455
345
311
346
310
297
300
274
292
304
186
14
321
206
160
217
204
246
234
175
364
328
158
40
556
193
221
278
230
253
240
252
228
306
206
48
557
279
399
364
306
471
293
333
316
329
265
61
679
428
394
352
387
590
177
199
203
255
261
115


Summary of computational transaction
Raw Inputview raw input (R code)
Raw Outputview raw output of R engine
Computing time2 seconds
R Server'Sir Maurice George Kendall' @ kendall.wessa.net

\begin{tabular}{lllllllll}
\hline
Summary of computational transaction \tabularnewline
Raw Input & view raw input (R code)  \tabularnewline
Raw Output & view raw output of R engine  \tabularnewline
Computing time & 2 seconds \tabularnewline
R Server & 'Sir Maurice George Kendall' @ kendall.wessa.net \tabularnewline
\hline
\end{tabular}
%Source: https://freestatistics.org/blog/index.php?pk=214442&T=0

[TABLE]
[ROW][C]Summary of computational transaction[/C][/ROW]
[ROW][C]Raw Input[/C][C]view raw input (R code) [/C][/ROW]
[ROW][C]Raw Output[/C][C]view raw output of R engine [/C][/ROW]
[ROW][C]Computing time[/C][C]2 seconds[/C][/ROW]
[ROW][C]R Server[/C][C]'Sir Maurice George Kendall' @ kendall.wessa.net[/C][/ROW]
[/TABLE]
Source: https://freestatistics.org/blog/index.php?pk=214442&T=0

Globally Unique Identifier (entire table): ba.freestatistics.org/blog/index.php?pk=214442&T=0

As an alternative you can also use a QR Code:  

The GUIDs for individual cells are displayed in the table below:

Summary of computational transaction
Raw Inputview raw input (R code)
Raw Outputview raw output of R engine
Computing time2 seconds
R Server'Sir Maurice George Kendall' @ kendall.wessa.net


Central Tendency - Ungrouped Data
MeasureValueS.E.Value/S.E.
Arithmetic Mean261.71428571428613.32686918135219.6380921995165
Geometric Mean225.454172184979
Harmonic Mean162.274062409832
Quadratic Mean288.505838844934
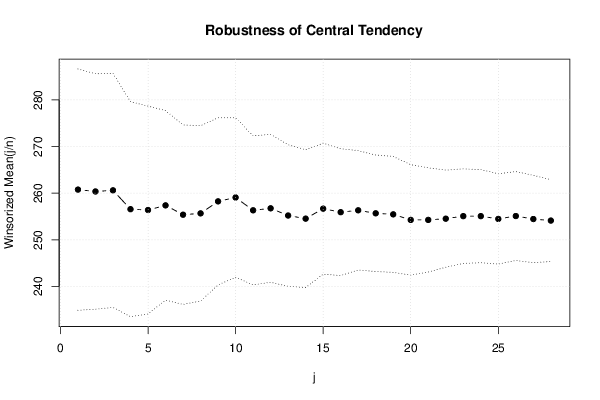
Winsorized Mean ( 1 / 28 )260.7738095238112.937582970712120.156300455359
Winsorized Mean ( 2 / 28 )260.36904761904812.62371685068220.6253871739037
Winsorized Mean ( 3 / 28 )260.61904761904812.55440146731420.7591774325189
Winsorized Mean ( 4 / 28 )256.57142857142911.521778197756322.2683881053527
Winsorized Mean ( 5 / 28 )256.39285714285711.146562054167523.0019674135305
Winsorized Mean ( 6 / 28 )257.39285714285710.163155783146425.3260761356913
Winsorized Mean ( 7 / 28 )255.3928571428579.6237153564784726.5378648144381
Winsorized Mean ( 8 / 28 )255.6785714285719.3991943221436627.2021795342837
Winsorized Mean ( 9 / 28 )258.258.9605797460943328.8206798352042
Winsorized Mean ( 10 / 28 )259.0833333333338.5510214575281330.2985245236687
Winsorized Mean ( 11 / 28 )256.3333333333337.9947869800500632.0625595119644
Winsorized Mean ( 12 / 28 )256.7619047619057.9299069891068832.3789301834955
Winsorized Mean ( 13 / 28 )255.2142857142867.5891351103817633.6289026354477
Winsorized Mean ( 14 / 28 )254.5476190476197.3873526375010134.457217834091
Winsorized Mean ( 15 / 28 )256.6904761904767.0223186569874736.5535215259791
Winsorized Mean ( 16 / 28 )255.9285714285716.7982310503770237.6463479296394
Winsorized Mean ( 17 / 28 )256.3333333333336.3990535851199340.0580070042544
Winsorized Mean ( 18 / 28 )255.6904761904766.2477988364976540.9248893701273
Winsorized Mean ( 19 / 28 )255.4642857142866.2159098154019641.0984543374952
Winsorized Mean ( 20 / 28 )254.273809523815.9213469531089342.9418866243442
Winsorized Mean ( 21 / 28 )254.273809523815.5863161432508845.5172609289238
Winsorized Mean ( 22 / 28 )254.5357142857145.2087090676699348.8673318050337
Winsorized Mean ( 23 / 28 )255.0833333333335.0683568401875650.3286057743112
Winsorized Mean ( 24 / 28 )255.0833333333334.9951556662474551.0661429546522
Winsorized Mean ( 25 / 28 )254.4880952380954.8424842858196852.553210339436
Winsorized Mean ( 26 / 28 )255.1071428571434.7651686677144953.5358054764302
Winsorized Mean ( 27 / 28 )254.4642857142864.6828395609477854.3397403225969
Winsorized Mean ( 28 / 28 )254.1309523809524.3896157309731257.8936672264511
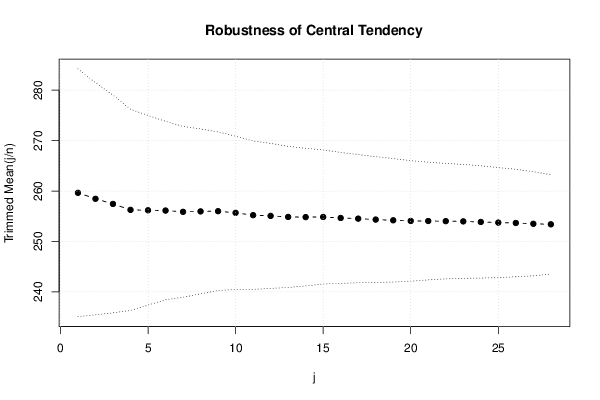
Trimmed Mean ( 1 / 28 )259.64634146341512.285036566575721.1351704210505
Trimmed Mean ( 2 / 28 )258.462511.512581776534422.4504377051907
Trimmed Mean ( 3 / 28 )257.43589743589710.801366906745823.833640654788
Trimmed Mean ( 4 / 28 )256.2631578947379.9790019615058625.6802392547146
Trimmed Mean ( 5 / 28 )256.1756756756769.4078936447848927.2298651906723
Trimmed Mean ( 6 / 28 )256.1258.8512515913829628.9365856744314
Trimmed Mean ( 7 / 28 )255.8714285714298.4784203338585730.1791393320765
Trimmed Mean ( 8 / 28 )255.9558823529418.1759200662943331.3060646725416
Trimmed Mean ( 9 / 28 )2567.8687366404662632.5338121857425
Trimmed Mean ( 10 / 28 )255.6718757.5999312956213433.641340303603
Trimmed Mean ( 11 / 28 )255.2096774193557.3638223057885634.6572291972254
Trimmed Mean ( 12 / 28 )255.0666666666677.1939187542892435.4558725749561
Trimmed Mean ( 13 / 28 )254.8620689655176.9982474807261236.4179845979201
Trimmed Mean ( 14 / 28 )254.8214285714296.8252352199063537.3351863139048
Trimmed Mean ( 15 / 28 )254.8518518518526.6495801692481938.326006359085
Trimmed Mean ( 16 / 28 )254.6538461538466.4999062886494939.1780796283998
Trimmed Mean ( 17 / 28 )254.526.3534814496158140.0599265171996
Trimmed Mean ( 18 / 28 )254.3333333333336.242181871378540.7443004023154
Trimmed Mean ( 19 / 28 )254.1956521739136.1250747458885941.5008245155768
Trimmed Mean ( 20 / 28 )254.0681818181825.9756728218377142.5170837482444
Trimmed Mean ( 21 / 28 )254.0476190476195.8393069510802643.5064676640471
Trimmed Mean ( 22 / 28 )254.0255.7261755595215144.3620698247028
Trimmed Mean ( 23 / 28 )253.9736842105265.6496184795601844.9541301115077
Trimmed Mean ( 24 / 28 )253.8611111111115.5660753574993545.6086371107204
Trimmed Mean ( 25 / 28 )253.7352941176475.4567345140746446.4994757328185
Trimmed Mean ( 26 / 28 )253.656255.3320412660162347.5720718098485
Trimmed Mean ( 27 / 28 )253.55.1630317209682349.099059176894
Trimmed Mean ( 28 / 28 )253.3928571428574.9313647095621651.3839215038215
Median253.5
Midrange346.5
Midmean - Weighted Average at Xnp252.511627906977
Midmean - Weighted Average at X(n+1)p254.047619047619
Midmean - Empirical Distribution Function252.511627906977
Midmean - Empirical Distribution Function - Averaging254.047619047619
Midmean - Empirical Distribution Function - Interpolation254.047619047619
Midmean - Closest Observation252.511627906977
Midmean - True Basic - Statistics Graphics Toolkit254.047619047619
Midmean - MS Excel (old versions)254.068181818182
Number of observations84

\begin{tabular}{lllllllll}
\hline
Central Tendency - Ungrouped Data \tabularnewline
Measure & Value & S.E. & Value/S.E. \tabularnewline
Arithmetic Mean & 261.714285714286 & 13.326869181352 & 19.6380921995165 \tabularnewline
Geometric Mean & 225.454172184979 &  &  \tabularnewline
Harmonic Mean & 162.274062409832 &  &  \tabularnewline
Quadratic Mean & 288.505838844934 &  &  \tabularnewline
Winsorized Mean ( 1 / 28 ) & 260.77380952381 & 12.9375829707121 & 20.156300455359 \tabularnewline
Winsorized Mean ( 2 / 28 ) & 260.369047619048 & 12.623716850682 & 20.6253871739037 \tabularnewline
Winsorized Mean ( 3 / 28 ) & 260.619047619048 & 12.554401467314 & 20.7591774325189 \tabularnewline
Winsorized Mean ( 4 / 28 ) & 256.571428571429 & 11.5217781977563 & 22.2683881053527 \tabularnewline
Winsorized Mean ( 5 / 28 ) & 256.392857142857 & 11.1465620541675 & 23.0019674135305 \tabularnewline
Winsorized Mean ( 6 / 28 ) & 257.392857142857 & 10.1631557831464 & 25.3260761356913 \tabularnewline
Winsorized Mean ( 7 / 28 ) & 255.392857142857 & 9.62371535647847 & 26.5378648144381 \tabularnewline
Winsorized Mean ( 8 / 28 ) & 255.678571428571 & 9.39919432214366 & 27.2021795342837 \tabularnewline
Winsorized Mean ( 9 / 28 ) & 258.25 & 8.96057974609433 & 28.8206798352042 \tabularnewline
Winsorized Mean ( 10 / 28 ) & 259.083333333333 & 8.55102145752813 & 30.2985245236687 \tabularnewline
Winsorized Mean ( 11 / 28 ) & 256.333333333333 & 7.99478698005006 & 32.0625595119644 \tabularnewline
Winsorized Mean ( 12 / 28 ) & 256.761904761905 & 7.92990698910688 & 32.3789301834955 \tabularnewline
Winsorized Mean ( 13 / 28 ) & 255.214285714286 & 7.58913511038176 & 33.6289026354477 \tabularnewline
Winsorized Mean ( 14 / 28 ) & 254.547619047619 & 7.38735263750101 & 34.457217834091 \tabularnewline
Winsorized Mean ( 15 / 28 ) & 256.690476190476 & 7.02231865698747 & 36.5535215259791 \tabularnewline
Winsorized Mean ( 16 / 28 ) & 255.928571428571 & 6.79823105037702 & 37.6463479296394 \tabularnewline
Winsorized Mean ( 17 / 28 ) & 256.333333333333 & 6.39905358511993 & 40.0580070042544 \tabularnewline
Winsorized Mean ( 18 / 28 ) & 255.690476190476 & 6.24779883649765 & 40.9248893701273 \tabularnewline
Winsorized Mean ( 19 / 28 ) & 255.464285714286 & 6.21590981540196 & 41.0984543374952 \tabularnewline
Winsorized Mean ( 20 / 28 ) & 254.27380952381 & 5.92134695310893 & 42.9418866243442 \tabularnewline
Winsorized Mean ( 21 / 28 ) & 254.27380952381 & 5.58631614325088 & 45.5172609289238 \tabularnewline
Winsorized Mean ( 22 / 28 ) & 254.535714285714 & 5.20870906766993 & 48.8673318050337 \tabularnewline
Winsorized Mean ( 23 / 28 ) & 255.083333333333 & 5.06835684018756 & 50.3286057743112 \tabularnewline
Winsorized Mean ( 24 / 28 ) & 255.083333333333 & 4.99515566624745 & 51.0661429546522 \tabularnewline
Winsorized Mean ( 25 / 28 ) & 254.488095238095 & 4.84248428581968 & 52.553210339436 \tabularnewline
Winsorized Mean ( 26 / 28 ) & 255.107142857143 & 4.76516866771449 & 53.5358054764302 \tabularnewline
Winsorized Mean ( 27 / 28 ) & 254.464285714286 & 4.68283956094778 & 54.3397403225969 \tabularnewline
Winsorized Mean ( 28 / 28 ) & 254.130952380952 & 4.38961573097312 & 57.8936672264511 \tabularnewline
Trimmed Mean ( 1 / 28 ) & 259.646341463415 & 12.2850365665757 & 21.1351704210505 \tabularnewline
Trimmed Mean ( 2 / 28 ) & 258.4625 & 11.5125817765344 & 22.4504377051907 \tabularnewline
Trimmed Mean ( 3 / 28 ) & 257.435897435897 & 10.8013669067458 & 23.833640654788 \tabularnewline
Trimmed Mean ( 4 / 28 ) & 256.263157894737 & 9.97900196150586 & 25.6802392547146 \tabularnewline
Trimmed Mean ( 5 / 28 ) & 256.175675675676 & 9.40789364478489 & 27.2298651906723 \tabularnewline
Trimmed Mean ( 6 / 28 ) & 256.125 & 8.85125159138296 & 28.9365856744314 \tabularnewline
Trimmed Mean ( 7 / 28 ) & 255.871428571429 & 8.47842033385857 & 30.1791393320765 \tabularnewline
Trimmed Mean ( 8 / 28 ) & 255.955882352941 & 8.17592006629433 & 31.3060646725416 \tabularnewline
Trimmed Mean ( 9 / 28 ) & 256 & 7.86873664046626 & 32.5338121857425 \tabularnewline
Trimmed Mean ( 10 / 28 ) & 255.671875 & 7.59993129562134 & 33.641340303603 \tabularnewline
Trimmed Mean ( 11 / 28 ) & 255.209677419355 & 7.36382230578856 & 34.6572291972254 \tabularnewline
Trimmed Mean ( 12 / 28 ) & 255.066666666667 & 7.19391875428924 & 35.4558725749561 \tabularnewline
Trimmed Mean ( 13 / 28 ) & 254.862068965517 & 6.99824748072612 & 36.4179845979201 \tabularnewline
Trimmed Mean ( 14 / 28 ) & 254.821428571429 & 6.82523521990635 & 37.3351863139048 \tabularnewline
Trimmed Mean ( 15 / 28 ) & 254.851851851852 & 6.64958016924819 & 38.326006359085 \tabularnewline
Trimmed Mean ( 16 / 28 ) & 254.653846153846 & 6.49990628864949 & 39.1780796283998 \tabularnewline
Trimmed Mean ( 17 / 28 ) & 254.52 & 6.35348144961581 & 40.0599265171996 \tabularnewline
Trimmed Mean ( 18 / 28 ) & 254.333333333333 & 6.2421818713785 & 40.7443004023154 \tabularnewline
Trimmed Mean ( 19 / 28 ) & 254.195652173913 & 6.12507474588859 & 41.5008245155768 \tabularnewline
Trimmed Mean ( 20 / 28 ) & 254.068181818182 & 5.97567282183771 & 42.5170837482444 \tabularnewline
Trimmed Mean ( 21 / 28 ) & 254.047619047619 & 5.83930695108026 & 43.5064676640471 \tabularnewline
Trimmed Mean ( 22 / 28 ) & 254.025 & 5.72617555952151 & 44.3620698247028 \tabularnewline
Trimmed Mean ( 23 / 28 ) & 253.973684210526 & 5.64961847956018 & 44.9541301115077 \tabularnewline
Trimmed Mean ( 24 / 28 ) & 253.861111111111 & 5.56607535749935 & 45.6086371107204 \tabularnewline
Trimmed Mean ( 25 / 28 ) & 253.735294117647 & 5.45673451407464 & 46.4994757328185 \tabularnewline
Trimmed Mean ( 26 / 28 ) & 253.65625 & 5.33204126601623 & 47.5720718098485 \tabularnewline
Trimmed Mean ( 27 / 28 ) & 253.5 & 5.16303172096823 & 49.099059176894 \tabularnewline
Trimmed Mean ( 28 / 28 ) & 253.392857142857 & 4.93136470956216 & 51.3839215038215 \tabularnewline
Median & 253.5 &  &  \tabularnewline
Midrange & 346.5 &  &  \tabularnewline
Midmean - Weighted Average at Xnp & 252.511627906977 &  &  \tabularnewline
Midmean - Weighted Average at X(n+1)p & 254.047619047619 &  &  \tabularnewline
Midmean - Empirical Distribution Function & 252.511627906977 &  &  \tabularnewline
Midmean - Empirical Distribution Function - Averaging & 254.047619047619 &  &  \tabularnewline
Midmean - Empirical Distribution Function - Interpolation & 254.047619047619 &  &  \tabularnewline
Midmean - Closest Observation & 252.511627906977 &  &  \tabularnewline
Midmean - True Basic - Statistics Graphics Toolkit & 254.047619047619 &  &  \tabularnewline
Midmean - MS Excel (old versions) & 254.068181818182 &  &  \tabularnewline
Number of observations & 84 &  &  \tabularnewline
\hline
\end{tabular}
%Source: https://freestatistics.org/blog/index.php?pk=214442&T=1

[TABLE]
[ROW][C]Central Tendency - Ungrouped Data[/C][/ROW]
[ROW][C]Measure[/C][C]Value[/C][C]S.E.[/C][C]Value/S.E.[/C][/ROW]
[ROW][C]Arithmetic Mean[/C][C]261.714285714286[/C][C]13.326869181352[/C][C]19.6380921995165[/C][/ROW]
[ROW][C]Geometric Mean[/C][C]225.454172184979[/C][C][/C][C][/C][/ROW]
[ROW][C]Harmonic Mean[/C][C]162.274062409832[/C][C][/C][C][/C][/ROW]
[ROW][C]Quadratic Mean[/C][C]288.505838844934[/C][C][/C][C][/C][/ROW]
[ROW][C]Winsorized Mean ( 1 / 28 )[/C][C]260.77380952381[/C][C]12.9375829707121[/C][C]20.156300455359[/C][/ROW]
[ROW][C]Winsorized Mean ( 2 / 28 )[/C][C]260.369047619048[/C][C]12.623716850682[/C][C]20.6253871739037[/C][/ROW]
[ROW][C]Winsorized Mean ( 3 / 28 )[/C][C]260.619047619048[/C][C]12.554401467314[/C][C]20.7591774325189[/C][/ROW]
[ROW][C]Winsorized Mean ( 4 / 28 )[/C][C]256.571428571429[/C][C]11.5217781977563[/C][C]22.2683881053527[/C][/ROW]
[ROW][C]Winsorized Mean ( 5 / 28 )[/C][C]256.392857142857[/C][C]11.1465620541675[/C][C]23.0019674135305[/C][/ROW]
[ROW][C]Winsorized Mean ( 6 / 28 )[/C][C]257.392857142857[/C][C]10.1631557831464[/C][C]25.3260761356913[/C][/ROW]
[ROW][C]Winsorized Mean ( 7 / 28 )[/C][C]255.392857142857[/C][C]9.62371535647847[/C][C]26.5378648144381[/C][/ROW]
[ROW][C]Winsorized Mean ( 8 / 28 )[/C][C]255.678571428571[/C][C]9.39919432214366[/C][C]27.2021795342837[/C][/ROW]
[ROW][C]Winsorized Mean ( 9 / 28 )[/C][C]258.25[/C][C]8.96057974609433[/C][C]28.8206798352042[/C][/ROW]
[ROW][C]Winsorized Mean ( 10 / 28 )[/C][C]259.083333333333[/C][C]8.55102145752813[/C][C]30.2985245236687[/C][/ROW]
[ROW][C]Winsorized Mean ( 11 / 28 )[/C][C]256.333333333333[/C][C]7.99478698005006[/C][C]32.0625595119644[/C][/ROW]
[ROW][C]Winsorized Mean ( 12 / 28 )[/C][C]256.761904761905[/C][C]7.92990698910688[/C][C]32.3789301834955[/C][/ROW]
[ROW][C]Winsorized Mean ( 13 / 28 )[/C][C]255.214285714286[/C][C]7.58913511038176[/C][C]33.6289026354477[/C][/ROW]
[ROW][C]Winsorized Mean ( 14 / 28 )[/C][C]254.547619047619[/C][C]7.38735263750101[/C][C]34.457217834091[/C][/ROW]
[ROW][C]Winsorized Mean ( 15 / 28 )[/C][C]256.690476190476[/C][C]7.02231865698747[/C][C]36.5535215259791[/C][/ROW]
[ROW][C]Winsorized Mean ( 16 / 28 )[/C][C]255.928571428571[/C][C]6.79823105037702[/C][C]37.6463479296394[/C][/ROW]
[ROW][C]Winsorized Mean ( 17 / 28 )[/C][C]256.333333333333[/C][C]6.39905358511993[/C][C]40.0580070042544[/C][/ROW]
[ROW][C]Winsorized Mean ( 18 / 28 )[/C][C]255.690476190476[/C][C]6.24779883649765[/C][C]40.9248893701273[/C][/ROW]
[ROW][C]Winsorized Mean ( 19 / 28 )[/C][C]255.464285714286[/C][C]6.21590981540196[/C][C]41.0984543374952[/C][/ROW]
[ROW][C]Winsorized Mean ( 20 / 28 )[/C][C]254.27380952381[/C][C]5.92134695310893[/C][C]42.9418866243442[/C][/ROW]
[ROW][C]Winsorized Mean ( 21 / 28 )[/C][C]254.27380952381[/C][C]5.58631614325088[/C][C]45.5172609289238[/C][/ROW]
[ROW][C]Winsorized Mean ( 22 / 28 )[/C][C]254.535714285714[/C][C]5.20870906766993[/C][C]48.8673318050337[/C][/ROW]
[ROW][C]Winsorized Mean ( 23 / 28 )[/C][C]255.083333333333[/C][C]5.06835684018756[/C][C]50.3286057743112[/C][/ROW]
[ROW][C]Winsorized Mean ( 24 / 28 )[/C][C]255.083333333333[/C][C]4.99515566624745[/C][C]51.0661429546522[/C][/ROW]
[ROW][C]Winsorized Mean ( 25 / 28 )[/C][C]254.488095238095[/C][C]4.84248428581968[/C][C]52.553210339436[/C][/ROW]
[ROW][C]Winsorized Mean ( 26 / 28 )[/C][C]255.107142857143[/C][C]4.76516866771449[/C][C]53.5358054764302[/C][/ROW]
[ROW][C]Winsorized Mean ( 27 / 28 )[/C][C]254.464285714286[/C][C]4.68283956094778[/C][C]54.3397403225969[/C][/ROW]
[ROW][C]Winsorized Mean ( 28 / 28 )[/C][C]254.130952380952[/C][C]4.38961573097312[/C][C]57.8936672264511[/C][/ROW]
[ROW][C]Trimmed Mean ( 1 / 28 )[/C][C]259.646341463415[/C][C]12.2850365665757[/C][C]21.1351704210505[/C][/ROW]
[ROW][C]Trimmed Mean ( 2 / 28 )[/C][C]258.4625[/C][C]11.5125817765344[/C][C]22.4504377051907[/C][/ROW]
[ROW][C]Trimmed Mean ( 3 / 28 )[/C][C]257.435897435897[/C][C]10.8013669067458[/C][C]23.833640654788[/C][/ROW]
[ROW][C]Trimmed Mean ( 4 / 28 )[/C][C]256.263157894737[/C][C]9.97900196150586[/C][C]25.6802392547146[/C][/ROW]
[ROW][C]Trimmed Mean ( 5 / 28 )[/C][C]256.175675675676[/C][C]9.40789364478489[/C][C]27.2298651906723[/C][/ROW]
[ROW][C]Trimmed Mean ( 6 / 28 )[/C][C]256.125[/C][C]8.85125159138296[/C][C]28.9365856744314[/C][/ROW]
[ROW][C]Trimmed Mean ( 7 / 28 )[/C][C]255.871428571429[/C][C]8.47842033385857[/C][C]30.1791393320765[/C][/ROW]
[ROW][C]Trimmed Mean ( 8 / 28 )[/C][C]255.955882352941[/C][C]8.17592006629433[/C][C]31.3060646725416[/C][/ROW]
[ROW][C]Trimmed Mean ( 9 / 28 )[/C][C]256[/C][C]7.86873664046626[/C][C]32.5338121857425[/C][/ROW]
[ROW][C]Trimmed Mean ( 10 / 28 )[/C][C]255.671875[/C][C]7.59993129562134[/C][C]33.641340303603[/C][/ROW]
[ROW][C]Trimmed Mean ( 11 / 28 )[/C][C]255.209677419355[/C][C]7.36382230578856[/C][C]34.6572291972254[/C][/ROW]
[ROW][C]Trimmed Mean ( 12 / 28 )[/C][C]255.066666666667[/C][C]7.19391875428924[/C][C]35.4558725749561[/C][/ROW]
[ROW][C]Trimmed Mean ( 13 / 28 )[/C][C]254.862068965517[/C][C]6.99824748072612[/C][C]36.4179845979201[/C][/ROW]
[ROW][C]Trimmed Mean ( 14 / 28 )[/C][C]254.821428571429[/C][C]6.82523521990635[/C][C]37.3351863139048[/C][/ROW]
[ROW][C]Trimmed Mean ( 15 / 28 )[/C][C]254.851851851852[/C][C]6.64958016924819[/C][C]38.326006359085[/C][/ROW]
[ROW][C]Trimmed Mean ( 16 / 28 )[/C][C]254.653846153846[/C][C]6.49990628864949[/C][C]39.1780796283998[/C][/ROW]
[ROW][C]Trimmed Mean ( 17 / 28 )[/C][C]254.52[/C][C]6.35348144961581[/C][C]40.0599265171996[/C][/ROW]
[ROW][C]Trimmed Mean ( 18 / 28 )[/C][C]254.333333333333[/C][C]6.2421818713785[/C][C]40.7443004023154[/C][/ROW]
[ROW][C]Trimmed Mean ( 19 / 28 )[/C][C]254.195652173913[/C][C]6.12507474588859[/C][C]41.5008245155768[/C][/ROW]
[ROW][C]Trimmed Mean ( 20 / 28 )[/C][C]254.068181818182[/C][C]5.97567282183771[/C][C]42.5170837482444[/C][/ROW]
[ROW][C]Trimmed Mean ( 21 / 28 )[/C][C]254.047619047619[/C][C]5.83930695108026[/C][C]43.5064676640471[/C][/ROW]
[ROW][C]Trimmed Mean ( 22 / 28 )[/C][C]254.025[/C][C]5.72617555952151[/C][C]44.3620698247028[/C][/ROW]
[ROW][C]Trimmed Mean ( 23 / 28 )[/C][C]253.973684210526[/C][C]5.64961847956018[/C][C]44.9541301115077[/C][/ROW]
[ROW][C]Trimmed Mean ( 24 / 28 )[/C][C]253.861111111111[/C][C]5.56607535749935[/C][C]45.6086371107204[/C][/ROW]
[ROW][C]Trimmed Mean ( 25 / 28 )[/C][C]253.735294117647[/C][C]5.45673451407464[/C][C]46.4994757328185[/C][/ROW]
[ROW][C]Trimmed Mean ( 26 / 28 )[/C][C]253.65625[/C][C]5.33204126601623[/C][C]47.5720718098485[/C][/ROW]
[ROW][C]Trimmed Mean ( 27 / 28 )[/C][C]253.5[/C][C]5.16303172096823[/C][C]49.099059176894[/C][/ROW]
[ROW][C]Trimmed Mean ( 28 / 28 )[/C][C]253.392857142857[/C][C]4.93136470956216[/C][C]51.3839215038215[/C][/ROW]
[ROW][C]Median[/C][C]253.5[/C][C][/C][C][/C][/ROW]
[ROW][C]Midrange[/C][C]346.5[/C][C][/C][C][/C][/ROW]
[ROW][C]Midmean - Weighted Average at Xnp[/C][C]252.511627906977[/C][C][/C][C][/C][/ROW]
[ROW][C]Midmean - Weighted Average at X(n+1)p[/C][C]254.047619047619[/C][C][/C][C][/C][/ROW]
[ROW][C]Midmean - Empirical Distribution Function[/C][C]252.511627906977[/C][C][/C][C][/C][/ROW]
[ROW][C]Midmean - Empirical Distribution Function - Averaging[/C][C]254.047619047619[/C][C][/C][C][/C][/ROW]
[ROW][C]Midmean - Empirical Distribution Function - Interpolation[/C][C]254.047619047619[/C][C][/C][C][/C][/ROW]
[ROW][C]Midmean - Closest Observation[/C][C]252.511627906977[/C][C][/C][C][/C][/ROW]
[ROW][C]Midmean - True Basic - Statistics Graphics Toolkit[/C][C]254.047619047619[/C][C][/C][C][/C][/ROW]
[ROW][C]Midmean - MS Excel (old versions)[/C][C]254.068181818182[/C][C][/C][C][/C][/ROW]
[ROW][C]Number of observations[/C][C]84[/C][C][/C][C][/C][/ROW]
[/TABLE]
Source: https://freestatistics.org/blog/index.php?pk=214442&T=1

Globally Unique Identifier (entire table): ba.freestatistics.org/blog/index.php?pk=214442&T=1

As an alternative you can also use a QR Code:  

The GUIDs for individual cells are displayed in the table below:

Central Tendency - Ungrouped Data
MeasureValueS.E.Value/S.E.
Arithmetic Mean261.71428571428613.32686918135219.6380921995165
Geometric Mean225.454172184979
Harmonic Mean162.274062409832
Quadratic Mean288.505838844934
Winsorized Mean ( 1 / 28 )260.7738095238112.937582970712120.156300455359
Winsorized Mean ( 2 / 28 )260.36904761904812.62371685068220.6253871739037
Winsorized Mean ( 3 / 28 )260.61904761904812.55440146731420.7591774325189
Winsorized Mean ( 4 / 28 )256.57142857142911.521778197756322.2683881053527
Winsorized Mean ( 5 / 28 )256.39285714285711.146562054167523.0019674135305
Winsorized Mean ( 6 / 28 )257.39285714285710.163155783146425.3260761356913
Winsorized Mean ( 7 / 28 )255.3928571428579.6237153564784726.5378648144381
Winsorized Mean ( 8 / 28 )255.6785714285719.3991943221436627.2021795342837
Winsorized Mean ( 9 / 28 )258.258.9605797460943328.8206798352042
Winsorized Mean ( 10 / 28 )259.0833333333338.5510214575281330.2985245236687
Winsorized Mean ( 11 / 28 )256.3333333333337.9947869800500632.0625595119644
Winsorized Mean ( 12 / 28 )256.7619047619057.9299069891068832.3789301834955
Winsorized Mean ( 13 / 28 )255.2142857142867.5891351103817633.6289026354477
Winsorized Mean ( 14 / 28 )254.5476190476197.3873526375010134.457217834091
Winsorized Mean ( 15 / 28 )256.6904761904767.0223186569874736.5535215259791
Winsorized Mean ( 16 / 28 )255.9285714285716.7982310503770237.6463479296394
Winsorized Mean ( 17 / 28 )256.3333333333336.3990535851199340.0580070042544
Winsorized Mean ( 18 / 28 )255.6904761904766.2477988364976540.9248893701273
Winsorized Mean ( 19 / 28 )255.4642857142866.2159098154019641.0984543374952
Winsorized Mean ( 20 / 28 )254.273809523815.9213469531089342.9418866243442
Winsorized Mean ( 21 / 28 )254.273809523815.5863161432508845.5172609289238
Winsorized Mean ( 22 / 28 )254.5357142857145.2087090676699348.8673318050337
Winsorized Mean ( 23 / 28 )255.0833333333335.0683568401875650.3286057743112
Winsorized Mean ( 24 / 28 )255.0833333333334.9951556662474551.0661429546522
Winsorized Mean ( 25 / 28 )254.4880952380954.8424842858196852.553210339436
Winsorized Mean ( 26 / 28 )255.1071428571434.7651686677144953.5358054764302
Winsorized Mean ( 27 / 28 )254.4642857142864.6828395609477854.3397403225969
Winsorized Mean ( 28 / 28 )254.1309523809524.3896157309731257.8936672264511
Trimmed Mean ( 1 / 28 )259.64634146341512.285036566575721.1351704210505
Trimmed Mean ( 2 / 28 )258.462511.512581776534422.4504377051907
Trimmed Mean ( 3 / 28 )257.43589743589710.801366906745823.833640654788
Trimmed Mean ( 4 / 28 )256.2631578947379.9790019615058625.6802392547146
Trimmed Mean ( 5 / 28 )256.1756756756769.4078936447848927.2298651906723
Trimmed Mean ( 6 / 28 )256.1258.8512515913829628.9365856744314
Trimmed Mean ( 7 / 28 )255.8714285714298.4784203338585730.1791393320765
Trimmed Mean ( 8 / 28 )255.9558823529418.1759200662943331.3060646725416
Trimmed Mean ( 9 / 28 )2567.8687366404662632.5338121857425
Trimmed Mean ( 10 / 28 )255.6718757.5999312956213433.641340303603
Trimmed Mean ( 11 / 28 )255.2096774193557.3638223057885634.6572291972254
Trimmed Mean ( 12 / 28 )255.0666666666677.1939187542892435.4558725749561
Trimmed Mean ( 13 / 28 )254.8620689655176.9982474807261236.4179845979201
Trimmed Mean ( 14 / 28 )254.8214285714296.8252352199063537.3351863139048
Trimmed Mean ( 15 / 28 )254.8518518518526.6495801692481938.326006359085
Trimmed Mean ( 16 / 28 )254.6538461538466.4999062886494939.1780796283998
Trimmed Mean ( 17 / 28 )254.526.3534814496158140.0599265171996
Trimmed Mean ( 18 / 28 )254.3333333333336.242181871378540.7443004023154
Trimmed Mean ( 19 / 28 )254.1956521739136.1250747458885941.5008245155768
Trimmed Mean ( 20 / 28 )254.0681818181825.9756728218377142.5170837482444
Trimmed Mean ( 21 / 28 )254.0476190476195.8393069510802643.5064676640471
Trimmed Mean ( 22 / 28 )254.0255.7261755595215144.3620698247028
Trimmed Mean ( 23 / 28 )253.9736842105265.6496184795601844.9541301115077
Trimmed Mean ( 24 / 28 )253.8611111111115.5660753574993545.6086371107204
Trimmed Mean ( 25 / 28 )253.7352941176475.4567345140746446.4994757328185
Trimmed Mean ( 26 / 28 )253.656255.3320412660162347.5720718098485
Trimmed Mean ( 27 / 28 )253.55.1630317209682349.099059176894
Trimmed Mean ( 28 / 28 )253.3928571428574.9313647095621651.3839215038215
Median253.5
Midrange346.5
Midmean - Weighted Average at Xnp252.511627906977
Midmean - Weighted Average at X(n+1)p254.047619047619
Midmean - Empirical Distribution Function252.511627906977
Midmean - Empirical Distribution Function - Averaging254.047619047619
Midmean - Empirical Distribution Function - Interpolation254.047619047619
Midmean - Closest Observation252.511627906977
Midmean - True Basic - Statistics Graphics Toolkit254.047619047619
Midmean - MS Excel (old versions)254.068181818182
Number of observations84


Parameters (Session):
Parameters (R input):
R code (references can be found in the software module):
geomean <- function(x) {
return(exp(mean(log(x))))
}
harmean <- function(x) {
return(1/mean(1/x))
}
quamean <- function(x) {
return(sqrt(mean(x*x)))
}
winmean <- function(x) {
x <-sort(x[!is.na(x)])
n<-length(x)
denom <- 3
nodenom <- n/denom
if (nodenom>40) denom <- n/40
sqrtn = sqrt(n)
roundnodenom = floor(nodenom)
win <- array(NA,dim=c(roundnodenom,2))
for (j in 1:roundnodenom) {
win[j,1] <- (j*x[j+1]+sum(x[(j+1):(n-j)])+j*x[n-j])/n
win[j,2] <- sd(c(rep(x[j+1],j),x[(j+1):(n-j)],rep(x[n-j],j)))/sqrtn
}
return(win)
}
trimean <- function(x) {
x <-sort(x[!is.na(x)])
n<-length(x)
denom <- 3
nodenom <- n/denom
if (nodenom>40) denom <- n/40
sqrtn = sqrt(n)
roundnodenom = floor(nodenom)
tri <- array(NA,dim=c(roundnodenom,2))
for (j in 1:roundnodenom) {
tri[j,1] <- mean(x,trim=j/n)
tri[j,2] <- sd(x[(j+1):(n-j)]) / sqrt(n-j*2)
}
return(tri)
}
midrange <- function(x) {
return((max(x)+min(x))/2)
}
q1 <- function(data,n,p,i,f) {
np <- n*p;
i <<- floor(np)
f <<- np - i
qvalue <- (1-f)*data[i] + f*data[i+1]
}
q2 <- function(data,n,p,i,f) {
np <- (n+1)*p
i <<- floor(np)
f <<- np - i
qvalue <- (1-f)*data[i] + f*data[i+1]
}
q3 <- function(data,n,p,i,f) {
np <- n*p
i <<- floor(np)
f <<- np - i
if (f==0) {
qvalue <- data[i]
} else {
qvalue <- data[i+1]
}
}
q4 <- function(data,n,p,i,f) {
np <- n*p
i <<- floor(np)
f <<- np - i
if (f==0) {
qvalue <- (data[i]+data[i+1])/2
} else {
qvalue <- data[i+1]
}
}
q5 <- function(data,n,p,i,f) {
np <- (n-1)*p
i <<- floor(np)
f <<- np - i
if (f==0) {
qvalue <- data[i+1]
} else {
qvalue <- data[i+1] + f*(data[i+2]-data[i+1])
}
}
q6 <- function(data,n,p,i,f) {
np <- n*p+0.5
i <<- floor(np)
f <<- np - i
qvalue <- data[i]
}
q7 <- function(data,n,p,i,f) {
np <- (n+1)*p
i <<- floor(np)
f <<- np - i
if (f==0) {
qvalue <- data[i]
} else {
qvalue <- f*data[i] + (1-f)*data[i+1]
}
}
q8 <- function(data,n,p,i,f) {
np <- (n+1)*p
i <<- floor(np)
f <<- np - i
if (f==0) {
qvalue <- data[i]
} else {
if (f == 0.5) {
qvalue <- (data[i]+data[i+1])/2
} else {
if (f < 0.5) {
qvalue <- data[i]
} else {
qvalue <- data[i+1]
}
}
}
}
midmean <- function(x,def) {
x <-sort(x[!is.na(x)])
n<-length(x)
if (def==1) {
qvalue1 <- q1(x,n,0.25,i,f)
qvalue3 <- q1(x,n,0.75,i,f)
}
if (def==2) {
qvalue1 <- q2(x,n,0.25,i,f)
qvalue3 <- q2(x,n,0.75,i,f)
}
if (def==3) {
qvalue1 <- q3(x,n,0.25,i,f)
qvalue3 <- q3(x,n,0.75,i,f)
}
if (def==4) {
qvalue1 <- q4(x,n,0.25,i,f)
qvalue3 <- q4(x,n,0.75,i,f)
}
if (def==5) {
qvalue1 <- q5(x,n,0.25,i,f)
qvalue3 <- q5(x,n,0.75,i,f)
}
if (def==6) {
qvalue1 <- q6(x,n,0.25,i,f)
qvalue3 <- q6(x,n,0.75,i,f)
}
if (def==7) {
qvalue1 <- q7(x,n,0.25,i,f)
qvalue3 <- q7(x,n,0.75,i,f)
}
if (def==8) {
qvalue1 <- q8(x,n,0.25,i,f)
qvalue3 <- q8(x,n,0.75,i,f)
}
midm <- 0
myn <- 0
roundno4 <- round(n/4)
round3no4 <- round(3*n/4)
for (i in 1:n) {
if ((x[i]>=qvalue1) & (x[i]<=qvalue3)){
midm = midm + x[i]
myn = myn + 1
}
}
midm = midm / myn
return(midm)
}
(arm <- mean(x))
sqrtn <- sqrt(length(x))
(armse <- sd(x) / sqrtn)
(armose <- arm / armse)
(geo <- geomean(x))
(har <- harmean(x))
(qua <- quamean(x))
(win <- winmean(x))
(tri <- trimean(x))
(midr <- midrange(x))
midm <- array(NA,dim=8)
for (j in 1:8) midm[j] <- midmean(x,j)
midm
bitmap(file='test1.png')
lb <- win[,1] - 2*win[,2]
ub <- win[,1] + 2*win[,2]
if ((ylimmin == '') | (ylimmax == '')) plot(win[,1],type='b',main=main, xlab='j', pch=19, ylab='Winsorized Mean(j/n)', ylim=c(min(lb),max(ub))) else plot(win[,1],type='l',main=main, xlab='j', pch=19, ylab='Winsorized Mean(j/n)', ylim=c(ylimmin,ylimmax))
lines(ub,lty=3)
lines(lb,lty=3)
grid()
dev.off()
bitmap(file='test2.png')
lb <- tri[,1] - 2*tri[,2]
ub <- tri[,1] + 2*tri[,2]
if ((ylimmin == '') | (ylimmax == '')) plot(tri[,1],type='b',main=main, xlab='j', pch=19, ylab='Trimmed Mean(j/n)', ylim=c(min(lb),max(ub))) else plot(tri[,1],type='l',main=main, xlab='j', pch=19, ylab='Trimmed Mean(j/n)', ylim=c(ylimmin,ylimmax))
lines(ub,lty=3)
lines(lb,lty=3)
grid()
dev.off()
load(file='createtable')
a<-table.start()
a<-table.row.start(a)
a<-table.element(a,'Central Tendency - Ungrouped Data',4,TRUE)
a<-table.row.end(a)
a<-table.row.start(a)
a<-table.element(a,'Measure',header=TRUE)
a<-table.element(a,'Value',header=TRUE)
a<-table.element(a,'S.E.',header=TRUE)
a<-table.element(a,'Value/S.E.',header=TRUE)
a<-table.row.end(a)
a<-table.row.start(a)
a<-table.element(a,hyperlink('arithmetic_mean.htm', 'Arithmetic Mean', 'click to view the definition of the Arithmetic Mean'),header=TRUE)
a<-table.element(a,arm)
a<-table.element(a,hyperlink('arithmetic_mean_standard_error.htm', armse, 'click to view the definition of the Standard Error of the Arithmetic Mean'))
a<-table.element(a,armose)
a<-table.row.end(a)
a<-table.row.start(a)
a<-table.element(a,hyperlink('geometric_mean.htm', 'Geometric Mean', 'click to view the definition of the Geometric Mean'),header=TRUE)
a<-table.element(a,geo)
a<-table.element(a,'')
a<-table.row.end(a)
a<-table.row.start(a)
a<-table.element(a,hyperlink('harmonic_mean.htm', 'Harmonic Mean', 'click to view the definition of the Harmonic Mean'),header=TRUE)
a<-table.element(a,har)
a<-table.element(a,'')
a<-table.row.end(a)
a<-table.row.start(a)
a<-table.element(a,hyperlink('quadratic_mean.htm', 'Quadratic Mean', 'click to view the definition of the Quadratic Mean'),header=TRUE)
a<-table.element(a,qua)
a<-table.element(a,'')
a<-table.row.end(a)
for (j in 1:length(win[,1])) {
a<-table.row.start(a)
mylabel <- paste('Winsorized Mean (',j)
mylabel <- paste(mylabel,'/')
mylabel <- paste(mylabel,length(win[,1]))
mylabel <- paste(mylabel,')')
a<-table.element(a,hyperlink('winsorized_mean.htm', mylabel, 'click to view the definition of the Winsorized Mean'),header=TRUE)
a<-table.element(a,win[j,1])
a<-table.element(a,win[j,2])
a<-table.element(a,win[j,1]/win[j,2])
a<-table.row.end(a)
}
for (j in 1:length(tri[,1])) {
a<-table.row.start(a)
mylabel <- paste('Trimmed Mean (',j)
mylabel <- paste(mylabel,'/')
mylabel <- paste(mylabel,length(tri[,1]))
mylabel <- paste(mylabel,')')
a<-table.element(a,hyperlink('arithmetic_mean.htm', mylabel, 'click to view the definition of the Trimmed Mean'),header=TRUE)
a<-table.element(a,tri[j,1])
a<-table.element(a,tri[j,2])
a<-table.element(a,tri[j,1]/tri[j,2])
a<-table.row.end(a)
}
a<-table.row.start(a)
a<-table.element(a,hyperlink('median_1.htm', 'Median', 'click to view the definition of the Median'),header=TRUE)
a<-table.element(a,median(x))
a<-table.element(a,'')
a<-table.row.end(a)
a<-table.row.start(a)
a<-table.element(a,hyperlink('midrange.htm', 'Midrange', 'click to view the definition of the Midrange'),header=TRUE)
a<-table.element(a,midr)
a<-table.element(a,'')
a<-table.row.end(a)
a<-table.row.start(a)
mymid <- hyperlink('midmean.htm', 'Midmean', 'click to view the definition of the Midmean')
mylabel <- paste(mymid,hyperlink('method_1.htm','Weighted Average at Xnp',''),sep=' - ')
a<-table.element(a,mylabel,header=TRUE)
a<-table.element(a,midm[1])
a<-table.element(a,'')
a<-table.row.end(a)
a<-table.row.start(a)
mymid <- hyperlink('midmean.htm', 'Midmean', 'click to view the definition of the Midmean')
mylabel <- paste(mymid,hyperlink('method_2.htm','Weighted Average at X(n+1)p',''),sep=' - ')
a<-table.element(a,mylabel,header=TRUE)
a<-table.element(a,midm[2])
a<-table.element(a,'')
a<-table.row.end(a)
a<-table.row.start(a)
mymid <- hyperlink('midmean.htm', 'Midmean', 'click to view the definition of the Midmean')
mylabel <- paste(mymid,hyperlink('method_3.htm','Empirical Distribution Function',''),sep=' - ')
a<-table.element(a,mylabel,header=TRUE)
a<-table.element(a,midm[3])
a<-table.element(a,'')
a<-table.row.end(a)
a<-table.row.start(a)
mymid <- hyperlink('midmean.htm', 'Midmean', 'click to view the definition of the Midmean')
mylabel <- paste(mymid,hyperlink('method_4.htm','Empirical Distribution Function - Averaging',''),sep=' - ')
a<-table.element(a,mylabel,header=TRUE)
a<-table.element(a,midm[4])
a<-table.element(a,'')
a<-table.row.end(a)
a<-table.row.start(a)
mymid <- hyperlink('midmean.htm', 'Midmean', 'click to view the definition of the Midmean')
mylabel <- paste(mymid,hyperlink('method_5.htm','Empirical Distribution Function - Interpolation',''),sep=' - ')
a<-table.element(a,mylabel,header=TRUE)
a<-table.element(a,midm[5])
a<-table.element(a,'')
a<-table.row.end(a)
a<-table.row.start(a)
mymid <- hyperlink('midmean.htm', 'Midmean', 'click to view the definition of the Midmean')
mylabel <- paste(mymid,hyperlink('method_6.htm','Closest Observation',''),sep=' - ')
a<-table.element(a,mylabel,header=TRUE)
a<-table.element(a,midm[6])
a<-table.element(a,'')
a<-table.row.end(a)
a<-table.row.start(a)
mymid <- hyperlink('midmean.htm', 'Midmean', 'click to view the definition of the Midmean')
mylabel <- paste(mymid,hyperlink('method_7.htm','True Basic - Statistics Graphics Toolkit',''),sep=' - ')
a<-table.element(a,mylabel,header=TRUE)
a<-table.element(a,midm[7])
a<-table.element(a,'')
a<-table.row.end(a)
a<-table.row.start(a)
mymid <- hyperlink('midmean.htm', 'Midmean', 'click to view the definition of the Midmean')
mylabel <- paste(mymid,hyperlink('method_8.htm','MS Excel (old versions)',''),sep=' - ')
a<-table.element(a,mylabel,header=TRUE)
a<-table.element(a,midm[8])
a<-table.element(a,'')
a<-table.row.end(a)
a<-table.row.start(a)
a<-table.element(a,'Number of observations',header=TRUE)
a<-table.element(a,length(x))
a<-table.element(a,'')
a<-table.row.end(a)
a<-table.end(a)
table.save(a,file='mytable.tab')