Free Statistics

of Irreproducible Research!

Author's title

Author*Unverified author*
R Software Modulerwasp_meanversusmedian.wasp
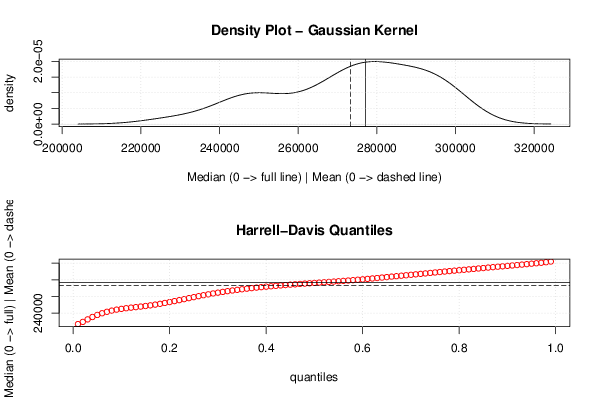
Title produced by softwareMean versus Median
Date of computationFri, 11 Oct 2013 07:44:19 -0400
Cite this page as followsStatistical Computations at FreeStatistics.org, Office for Research Development and Education, URL https://freestatistics.org/blog/index.php?v=date/2013/Oct/11/t1381491896yg1tyindu4kitq4.htm/, Retrieved Sat, 27 Apr 2024 13:35:56 +0000
Statistical Computations at FreeStatistics.org, Office for Research Development and Education, URL https://freestatistics.org/blog/index.php?pk=214744, Retrieved Sat, 27 Apr 2024 13:35:56 +0000
QR Codes:

Original text written by user:
IsPrivate?No (this computation is public)
User-defined keywords
Estimated Impact98
Family? (F = Feedback message, R = changed R code, M = changed R Module, P = changed Parameters, D = changed Data)
-       [Mean versus Median] [] [2013-10-11 11:44:19] [f3f79c2d34893fd5bed45dfee56f0880] [Current]
Feedback Forum

Post a new message
Dataseries X:
297295
295008
296917
298982
300562
294292
272817
274405
278601
283654
290770
290604
277466
274371
277686
282917
286692
285378
262433
266730
271980
277799
282329
285775
283495
279998
287224
296369
300653
302686
277891
277537
285383
292213
298522
300431
297584
286445
288576
293299
295881
292710
271993
267430
273963
273046
268347
264319
255765
246263
245098
246969
248333
247934
226839
225554
237085
237080
245039
248541
247105
243422
250643
254663
260993
258556
235372
246057
253353
255198
264176
269034
265861
269826
278506
292300
290726
289802
271311
274352
275216
276836
280408
280190


Summary of computational transaction
Raw Inputview raw input (R code)
Raw Outputview raw output of R engine
Computing time1 seconds
R Server'Gertrude Mary Cox' @ cox.wessa.net

\begin{tabular}{lllllllll}
\hline
Summary of computational transaction \tabularnewline
Raw Input & view raw input (R code)  \tabularnewline
Raw Output & view raw output of R engine  \tabularnewline
Computing time & 1 seconds \tabularnewline
R Server & 'Gertrude Mary Cox' @ cox.wessa.net \tabularnewline
\hline
\end{tabular}
%Source: https://freestatistics.org/blog/index.php?pk=214744&T=0

[TABLE]
[ROW][C]Summary of computational transaction[/C][/ROW]
[ROW][C]Raw Input[/C][C]view raw input (R code) [/C][/ROW]
[ROW][C]Raw Output[/C][C]view raw output of R engine [/C][/ROW]
[ROW][C]Computing time[/C][C]1 seconds[/C][/ROW]
[ROW][C]R Server[/C][C]'Gertrude Mary Cox' @ cox.wessa.net[/C][/ROW]
[/TABLE]
Source: https://freestatistics.org/blog/index.php?pk=214744&T=0

Globally Unique Identifier (entire table): ba.freestatistics.org/blog/index.php?pk=214744&T=0

As an alternative you can also use a QR Code:  

The GUIDs for individual cells are displayed in the table below:

Summary of computational transaction
Raw Inputview raw input (R code)
Raw Outputview raw output of R engine
Computing time1 seconds
R Server'Gertrude Mary Cox' @ cox.wessa.net


Median versus Mean
mean273284.095238095
median277151

\begin{tabular}{lllllllll}
\hline
Median versus Mean \tabularnewline
mean & 273284.095238095 \tabularnewline
median & 277151 \tabularnewline
\hline
\end{tabular}
%Source: https://freestatistics.org/blog/index.php?pk=214744&T=1

[TABLE]
[ROW][C]Median versus Mean[/C][/ROW]
[ROW][C]mean[/C][C]273284.095238095[/C][/ROW]
[ROW][C]median[/C][C]277151[/C][/ROW]
[/TABLE]
Source: https://freestatistics.org/blog/index.php?pk=214744&T=1

Globally Unique Identifier (entire table): ba.freestatistics.org/blog/index.php?pk=214744&T=1

As an alternative you can also use a QR Code:  

The GUIDs for individual cells are displayed in the table below:

Median versus Mean
mean273284.095238095
median277151


Parameters (Session):
Parameters (R input):
R code (references can be found in the software module):
library(Hmisc)
m <- mean(x)
e <- median(x)
bitmap(file='test1.png')
op <- par(mfrow=c(2,1))
mydensity1 <- density(x,kernel='gaussian',na.rm=TRUE)
plot(mydensity1,main='Density Plot - Gaussian Kernel',xlab='Median (0 -> full line) | Mean (0 -> dashed line)',ylab='density')
abline(v=e,lty=1)
abline(v=m,lty=5)
grid()
myseq <- seq(0.01, 0.99, 0.01)
hd <- hdquantile(x, probs = myseq, se = TRUE, na.rm = FALSE, names = TRUE, weights=FALSE)
plot(myseq,hd,col=2,main='Harrell-Davis Quantiles',xlab='quantiles',ylab='Median (0 -> full) | Mean (0 -> dashed)')
abline(h=m,lty=5)
abline(h=e,lty=1)
grid()
par(op)
dev.off()
load(file='createtable')
a<-table.start()
a<-table.row.start(a)
a<-table.element(a,'Median versus Mean',2,TRUE)
a<-table.row.end(a)
a<-table.row.start(a)
a<-table.element(a,'mean',header=TRUE)
a<-table.element(a,mean(x))
a<-table.row.end(a)
a<-table.row.start(a)
a<-table.element(a,'median',header=TRUE)
a<-table.element(a,median(x))
a<-table.row.end(a)
a<-table.end(a)
table.save(a,file='mytable.tab')