Free Statistics

of Irreproducible Research!

Author's title

Author*Unverified author*
R Software Modulerwasp_centraltendency.wasp
Title produced by softwareCentral Tendency
Date of computationSat, 12 Oct 2013 06:09:44 -0400
Cite this page as followsStatistical Computations at FreeStatistics.org, Office for Research Development and Education, URL https://freestatistics.org/blog/index.php?v=date/2013/Oct/12/t1381572713r0wdtyg218c3z86.htm/, Retrieved Mon, 29 Apr 2024 07:43:16 +0000
Statistical Computations at FreeStatistics.org, Office for Research Development and Education, URL https://freestatistics.org/blog/index.php?pk=214878, Retrieved Mon, 29 Apr 2024 07:43:16 +0000
QR Codes:

Original text written by user:
IsPrivate?No (this computation is public)
User-defined keywords
Estimated Impact130
Family? (F = Feedback message, R = changed R code, M = changed R Module, P = changed Parameters, D = changed Data)
-       [Central Tendency] [] [2013-10-12 10:09:44] [bc709afd059270defb36fb1011c3ea57] [Current]
Feedback Forum

Post a new message
Dataseries X:
86,5
86,6
98,8
84,4
91,4
95,7
78,5
81,7
94,3
98,5
95,4
91,7
92,8
90,6
102,2
91,8
95
102
88,9
89,6
97,9
108,6
100,8
95,1
101
100,9
102,5
105,4
98,4
105,3
96,5
88,1
107,9
107,1
92,5
95,7
85,2
85,5
94,7
86,2
88,8
93,4
83,4
82,9
96,7
96,2
92,8
92,8
90,2
95,9
107,5
98
95
108,5
91,8
91,7
108,3
105,1
104,8
103,2
98,6
102,4
121,2
102,6
108,9
105,5
90,8
99,6
111,6
104,7
103,1
101,7
98,8
101,4
114,2
96,9
98,3
104,8
94,4
94,5
102,4
105,5
101,2
99,5


Summary of computational transaction
Raw Inputview raw input (R code)
Raw Outputview raw output of R engine
Computing time2 seconds
R Server'Gertrude Mary Cox' @ cox.wessa.net

\begin{tabular}{lllllllll}
\hline
Summary of computational transaction \tabularnewline
Raw Input & view raw input (R code)  \tabularnewline
Raw Output & view raw output of R engine  \tabularnewline
Computing time & 2 seconds \tabularnewline
R Server & 'Gertrude Mary Cox' @ cox.wessa.net \tabularnewline
\hline
\end{tabular}
%Source: https://freestatistics.org/blog/index.php?pk=214878&T=0

[TABLE]
[ROW][C]Summary of computational transaction[/C][/ROW]
[ROW][C]Raw Input[/C][C]view raw input (R code) [/C][/ROW]
[ROW][C]Raw Output[/C][C]view raw output of R engine [/C][/ROW]
[ROW][C]Computing time[/C][C]2 seconds[/C][/ROW]
[ROW][C]R Server[/C][C]'Gertrude Mary Cox' @ cox.wessa.net[/C][/ROW]
[/TABLE]
Source: https://freestatistics.org/blog/index.php?pk=214878&T=0

Globally Unique Identifier (entire table): ba.freestatistics.org/blog/index.php?pk=214878&T=0

As an alternative you can also use a QR Code:  

The GUIDs for individual cells are displayed in the table below:

Summary of computational transaction
Raw Inputview raw input (R code)
Raw Outputview raw output of R engine
Computing time2 seconds
R Server'Gertrude Mary Cox' @ cox.wessa.net


Central Tendency - Ungrouped Data
MeasureValueS.E.Value/S.E.
Arithmetic Mean97.39642857142860.867946856292908112.214737417702
Geometric Mean97.0744487373466
Harmonic Mean96.7510303805367
Quadratic Mean97.7168912385844
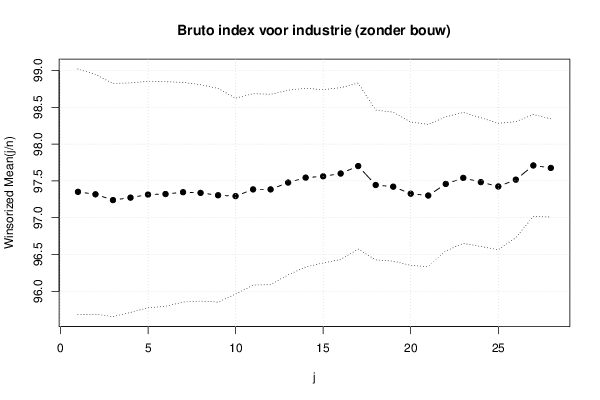
Winsorized Mean ( 1 / 28 )97.35119047619050.834661295405656116.63556344598
Winsorized Mean ( 2 / 28 )97.31785714285710.814303359865578119.510568099488
Winsorized Mean ( 3 / 28 )97.23928571428570.791751469668452122.815415492699
Winsorized Mean ( 4 / 28 )97.2726190476190.779479634281449124.791738962222
Winsorized Mean ( 5 / 28 )97.31428571428570.769180336654466126.51686617153
Winsorized Mean ( 6 / 28 )97.32142857142860.762655834980165127.608580578105
Winsorized Mean ( 7 / 28 )97.34642857142860.746226780158432130.451534519789
Winsorized Mean ( 8 / 28 )97.33690476190480.734696185295015132.48592644158
Winsorized Mean ( 9 / 28 )97.30476190476190.725735634388277134.077420611681
Winsorized Mean ( 10 / 28 )97.29285714285710.665259097210091146.248067182961
Winsorized Mean ( 11 / 28 )97.38452380952380.650335307943923149.745097059871
Winsorized Mean ( 12 / 28 )97.38452380952380.645927029194654150.767067188601
Winsorized Mean ( 13 / 28 )97.47738095238090.626827451550608155.50911293251
Winsorized Mean ( 14 / 28 )97.54404761904760.606957535866884160.709838588182
Winsorized Mean ( 15 / 28 )97.56190476190480.588674193153842165.731581062206
Winsorized Mean ( 16 / 28 )97.60.583284564800181167.328274893465
Winsorized Mean ( 17 / 28 )97.70119047619050.563552818003196173.366519259667
Winsorized Mean ( 18 / 28 )97.44404761904760.508790628438789191.520916802364
Winsorized Mean ( 19 / 28 )97.42142857142860.505719074823925192.639418644328
Winsorized Mean ( 20 / 28 )97.32619047619050.48663762315475199.997258422497
Winsorized Mean ( 21 / 28 )97.30119047619050.483385739282934201.290982685028
Winsorized Mean ( 22 / 28 )97.45833333333330.455366447019267214.021770754686
Winsorized Mean ( 23 / 28 )97.54047619047620.444702092833063219.338918710895
Winsorized Mean ( 24 / 28 )97.48333333333330.437226542136885222.958407000858
Winsorized Mean ( 25 / 28 )97.42380952380950.429537700785302226.810846511713
Winsorized Mean ( 26 / 28 )97.51666666666670.393885543503136247.57615067406
Winsorized Mean ( 27 / 28 )97.70952380952380.346073040253004282.337866417133
Winsorized Mean ( 28 / 28 )97.67619047619050.333596936995793292.797024324664
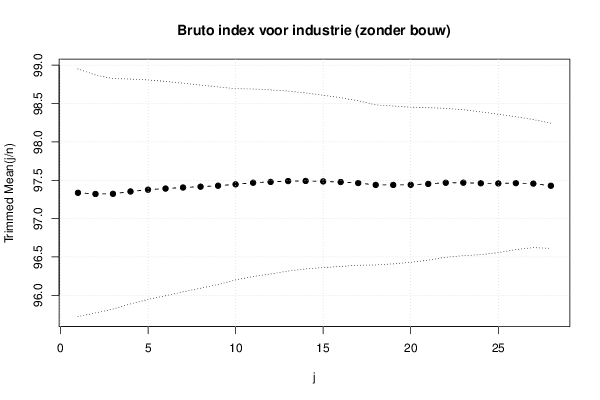
Trimmed Mean ( 1 / 28 )97.33658536585370.807247568308859120.578356859927
Trimmed Mean ( 2 / 28 )97.321250.77534739814902125.51954160462
Trimmed Mean ( 3 / 28 )97.32307692307690.751012022450514129.589239604336
Trimmed Mean ( 4 / 28 )97.3539473684210.732641078658919132.880820096281
Trimmed Mean ( 5 / 28 )97.3770270270270.715465034670442136.103124972251
Trimmed Mean ( 6 / 28 )97.39166666666670.698368179573641139.456048421515
Trimmed Mean ( 7 / 28 )97.40571428571430.679909523009822143.262759219078
Trimmed Mean ( 8 / 28 )97.41617647058820.662075017480171147.13767156077
Trimmed Mean ( 9 / 28 )97.42878787878790.643460071159996151.413882920736
Trimmed Mean ( 10 / 28 )97.4468750.623096182725097156.391384992632
Trimmed Mean ( 11 / 28 )97.46774193548390.611275915883082159.449668149737
Trimmed Mean ( 12 / 28 )97.47833333333330.599793239641921162.519893341126
Trimmed Mean ( 13 / 28 )97.48965517241380.586491870521128166.225075013895
Trimmed Mean ( 14 / 28 )97.49107142857140.573756570772517169.91713279607
Trimmed Mean ( 15 / 28 )97.48518518518520.561664986450948173.564647141662
Trimmed Mean ( 16 / 28 )97.47692307692310.549904800376154177.261451455316
Trimmed Mean ( 17 / 28 )97.4640.535946692445114181.853907065545
Trimmed Mean ( 18 / 28 )97.43958333333330.521936685918479186.688512155193
Trimmed Mean ( 19 / 28 )97.43913043478260.514734378860931189.299830041289
Trimmed Mean ( 20 / 28 )97.44090909090910.505501636664396192.760818211951
Trimmed Mean ( 21 / 28 )97.45238095238090.496810244685635196.156142098168
Trimmed Mean ( 22 / 28 )97.46750.48542061459823200.789783270064
Trimmed Mean ( 23 / 28 )97.46842105263160.476012139641598204.760368351148
Trimmed Mean ( 24 / 28 )97.46111111111110.46501882156443209.5853040598
Trimmed Mean ( 25 / 28 )97.45882352941180.45106563559249216.063507922514
Trimmed Mean ( 26 / 28 )97.46250.432960318154879225.107234804682
Trimmed Mean ( 27 / 28 )97.45666666666670.417289649213824233.546810591338
Trimmed Mean ( 28 / 28 )97.42857142857140.408178854577577238.690883508407
Median97.4
Midrange99.85
Midmean - Weighted Average at Xnp97.3209302325582
Midmean - Weighted Average at X(n+1)p97.3209302325582
Midmean - Empirical Distribution Function97.3209302325582
Midmean - Empirical Distribution Function - Averaging97.3209302325582
Midmean - Empirical Distribution Function - Interpolation97.3209302325582
Midmean - Closest Observation97.3209302325582
Midmean - True Basic - Statistics Graphics Toolkit97.3209302325582
Midmean - MS Excel (old versions)97.4409090909091
Number of observations84

\begin{tabular}{lllllllll}
\hline
Central Tendency - Ungrouped Data \tabularnewline
Measure & Value & S.E. & Value/S.E. \tabularnewline
Arithmetic Mean & 97.3964285714286 & 0.867946856292908 & 112.214737417702 \tabularnewline
Geometric Mean & 97.0744487373466 &  &  \tabularnewline
Harmonic Mean & 96.7510303805367 &  &  \tabularnewline
Quadratic Mean & 97.7168912385844 &  &  \tabularnewline
Winsorized Mean ( 1 / 28 ) & 97.3511904761905 & 0.834661295405656 & 116.63556344598 \tabularnewline
Winsorized Mean ( 2 / 28 ) & 97.3178571428571 & 0.814303359865578 & 119.510568099488 \tabularnewline
Winsorized Mean ( 3 / 28 ) & 97.2392857142857 & 0.791751469668452 & 122.815415492699 \tabularnewline
Winsorized Mean ( 4 / 28 ) & 97.272619047619 & 0.779479634281449 & 124.791738962222 \tabularnewline
Winsorized Mean ( 5 / 28 ) & 97.3142857142857 & 0.769180336654466 & 126.51686617153 \tabularnewline
Winsorized Mean ( 6 / 28 ) & 97.3214285714286 & 0.762655834980165 & 127.608580578105 \tabularnewline
Winsorized Mean ( 7 / 28 ) & 97.3464285714286 & 0.746226780158432 & 130.451534519789 \tabularnewline
Winsorized Mean ( 8 / 28 ) & 97.3369047619048 & 0.734696185295015 & 132.48592644158 \tabularnewline
Winsorized Mean ( 9 / 28 ) & 97.3047619047619 & 0.725735634388277 & 134.077420611681 \tabularnewline
Winsorized Mean ( 10 / 28 ) & 97.2928571428571 & 0.665259097210091 & 146.248067182961 \tabularnewline
Winsorized Mean ( 11 / 28 ) & 97.3845238095238 & 0.650335307943923 & 149.745097059871 \tabularnewline
Winsorized Mean ( 12 / 28 ) & 97.3845238095238 & 0.645927029194654 & 150.767067188601 \tabularnewline
Winsorized Mean ( 13 / 28 ) & 97.4773809523809 & 0.626827451550608 & 155.50911293251 \tabularnewline
Winsorized Mean ( 14 / 28 ) & 97.5440476190476 & 0.606957535866884 & 160.709838588182 \tabularnewline
Winsorized Mean ( 15 / 28 ) & 97.5619047619048 & 0.588674193153842 & 165.731581062206 \tabularnewline
Winsorized Mean ( 16 / 28 ) & 97.6 & 0.583284564800181 & 167.328274893465 \tabularnewline
Winsorized Mean ( 17 / 28 ) & 97.7011904761905 & 0.563552818003196 & 173.366519259667 \tabularnewline
Winsorized Mean ( 18 / 28 ) & 97.4440476190476 & 0.508790628438789 & 191.520916802364 \tabularnewline
Winsorized Mean ( 19 / 28 ) & 97.4214285714286 & 0.505719074823925 & 192.639418644328 \tabularnewline
Winsorized Mean ( 20 / 28 ) & 97.3261904761905 & 0.48663762315475 & 199.997258422497 \tabularnewline
Winsorized Mean ( 21 / 28 ) & 97.3011904761905 & 0.483385739282934 & 201.290982685028 \tabularnewline
Winsorized Mean ( 22 / 28 ) & 97.4583333333333 & 0.455366447019267 & 214.021770754686 \tabularnewline
Winsorized Mean ( 23 / 28 ) & 97.5404761904762 & 0.444702092833063 & 219.338918710895 \tabularnewline
Winsorized Mean ( 24 / 28 ) & 97.4833333333333 & 0.437226542136885 & 222.958407000858 \tabularnewline
Winsorized Mean ( 25 / 28 ) & 97.4238095238095 & 0.429537700785302 & 226.810846511713 \tabularnewline
Winsorized Mean ( 26 / 28 ) & 97.5166666666667 & 0.393885543503136 & 247.57615067406 \tabularnewline
Winsorized Mean ( 27 / 28 ) & 97.7095238095238 & 0.346073040253004 & 282.337866417133 \tabularnewline
Winsorized Mean ( 28 / 28 ) & 97.6761904761905 & 0.333596936995793 & 292.797024324664 \tabularnewline
Trimmed Mean ( 1 / 28 ) & 97.3365853658537 & 0.807247568308859 & 120.578356859927 \tabularnewline
Trimmed Mean ( 2 / 28 ) & 97.32125 & 0.77534739814902 & 125.51954160462 \tabularnewline
Trimmed Mean ( 3 / 28 ) & 97.3230769230769 & 0.751012022450514 & 129.589239604336 \tabularnewline
Trimmed Mean ( 4 / 28 ) & 97.353947368421 & 0.732641078658919 & 132.880820096281 \tabularnewline
Trimmed Mean ( 5 / 28 ) & 97.377027027027 & 0.715465034670442 & 136.103124972251 \tabularnewline
Trimmed Mean ( 6 / 28 ) & 97.3916666666667 & 0.698368179573641 & 139.456048421515 \tabularnewline
Trimmed Mean ( 7 / 28 ) & 97.4057142857143 & 0.679909523009822 & 143.262759219078 \tabularnewline
Trimmed Mean ( 8 / 28 ) & 97.4161764705882 & 0.662075017480171 & 147.13767156077 \tabularnewline
Trimmed Mean ( 9 / 28 ) & 97.4287878787879 & 0.643460071159996 & 151.413882920736 \tabularnewline
Trimmed Mean ( 10 / 28 ) & 97.446875 & 0.623096182725097 & 156.391384992632 \tabularnewline
Trimmed Mean ( 11 / 28 ) & 97.4677419354839 & 0.611275915883082 & 159.449668149737 \tabularnewline
Trimmed Mean ( 12 / 28 ) & 97.4783333333333 & 0.599793239641921 & 162.519893341126 \tabularnewline
Trimmed Mean ( 13 / 28 ) & 97.4896551724138 & 0.586491870521128 & 166.225075013895 \tabularnewline
Trimmed Mean ( 14 / 28 ) & 97.4910714285714 & 0.573756570772517 & 169.91713279607 \tabularnewline
Trimmed Mean ( 15 / 28 ) & 97.4851851851852 & 0.561664986450948 & 173.564647141662 \tabularnewline
Trimmed Mean ( 16 / 28 ) & 97.4769230769231 & 0.549904800376154 & 177.261451455316 \tabularnewline
Trimmed Mean ( 17 / 28 ) & 97.464 & 0.535946692445114 & 181.853907065545 \tabularnewline
Trimmed Mean ( 18 / 28 ) & 97.4395833333333 & 0.521936685918479 & 186.688512155193 \tabularnewline
Trimmed Mean ( 19 / 28 ) & 97.4391304347826 & 0.514734378860931 & 189.299830041289 \tabularnewline
Trimmed Mean ( 20 / 28 ) & 97.4409090909091 & 0.505501636664396 & 192.760818211951 \tabularnewline
Trimmed Mean ( 21 / 28 ) & 97.4523809523809 & 0.496810244685635 & 196.156142098168 \tabularnewline
Trimmed Mean ( 22 / 28 ) & 97.4675 & 0.48542061459823 & 200.789783270064 \tabularnewline
Trimmed Mean ( 23 / 28 ) & 97.4684210526316 & 0.476012139641598 & 204.760368351148 \tabularnewline
Trimmed Mean ( 24 / 28 ) & 97.4611111111111 & 0.46501882156443 & 209.5853040598 \tabularnewline
Trimmed Mean ( 25 / 28 ) & 97.4588235294118 & 0.45106563559249 & 216.063507922514 \tabularnewline
Trimmed Mean ( 26 / 28 ) & 97.4625 & 0.432960318154879 & 225.107234804682 \tabularnewline
Trimmed Mean ( 27 / 28 ) & 97.4566666666667 & 0.417289649213824 & 233.546810591338 \tabularnewline
Trimmed Mean ( 28 / 28 ) & 97.4285714285714 & 0.408178854577577 & 238.690883508407 \tabularnewline
Median & 97.4 &  &  \tabularnewline
Midrange & 99.85 &  &  \tabularnewline
Midmean - Weighted Average at Xnp & 97.3209302325582 &  &  \tabularnewline
Midmean - Weighted Average at X(n+1)p & 97.3209302325582 &  &  \tabularnewline
Midmean - Empirical Distribution Function & 97.3209302325582 &  &  \tabularnewline
Midmean - Empirical Distribution Function - Averaging & 97.3209302325582 &  &  \tabularnewline
Midmean - Empirical Distribution Function - Interpolation & 97.3209302325582 &  &  \tabularnewline
Midmean - Closest Observation & 97.3209302325582 &  &  \tabularnewline
Midmean - True Basic - Statistics Graphics Toolkit & 97.3209302325582 &  &  \tabularnewline
Midmean - MS Excel (old versions) & 97.4409090909091 &  &  \tabularnewline
Number of observations & 84 &  &  \tabularnewline
\hline
\end{tabular}
%Source: https://freestatistics.org/blog/index.php?pk=214878&T=1

[TABLE]
[ROW][C]Central Tendency - Ungrouped Data[/C][/ROW]
[ROW][C]Measure[/C][C]Value[/C][C]S.E.[/C][C]Value/S.E.[/C][/ROW]
[ROW][C]Arithmetic Mean[/C][C]97.3964285714286[/C][C]0.867946856292908[/C][C]112.214737417702[/C][/ROW]
[ROW][C]Geometric Mean[/C][C]97.0744487373466[/C][C][/C][C][/C][/ROW]
[ROW][C]Harmonic Mean[/C][C]96.7510303805367[/C][C][/C][C][/C][/ROW]
[ROW][C]Quadratic Mean[/C][C]97.7168912385844[/C][C][/C][C][/C][/ROW]
[ROW][C]Winsorized Mean ( 1 / 28 )[/C][C]97.3511904761905[/C][C]0.834661295405656[/C][C]116.63556344598[/C][/ROW]
[ROW][C]Winsorized Mean ( 2 / 28 )[/C][C]97.3178571428571[/C][C]0.814303359865578[/C][C]119.510568099488[/C][/ROW]
[ROW][C]Winsorized Mean ( 3 / 28 )[/C][C]97.2392857142857[/C][C]0.791751469668452[/C][C]122.815415492699[/C][/ROW]
[ROW][C]Winsorized Mean ( 4 / 28 )[/C][C]97.272619047619[/C][C]0.779479634281449[/C][C]124.791738962222[/C][/ROW]
[ROW][C]Winsorized Mean ( 5 / 28 )[/C][C]97.3142857142857[/C][C]0.769180336654466[/C][C]126.51686617153[/C][/ROW]
[ROW][C]Winsorized Mean ( 6 / 28 )[/C][C]97.3214285714286[/C][C]0.762655834980165[/C][C]127.608580578105[/C][/ROW]
[ROW][C]Winsorized Mean ( 7 / 28 )[/C][C]97.3464285714286[/C][C]0.746226780158432[/C][C]130.451534519789[/C][/ROW]
[ROW][C]Winsorized Mean ( 8 / 28 )[/C][C]97.3369047619048[/C][C]0.734696185295015[/C][C]132.48592644158[/C][/ROW]
[ROW][C]Winsorized Mean ( 9 / 28 )[/C][C]97.3047619047619[/C][C]0.725735634388277[/C][C]134.077420611681[/C][/ROW]
[ROW][C]Winsorized Mean ( 10 / 28 )[/C][C]97.2928571428571[/C][C]0.665259097210091[/C][C]146.248067182961[/C][/ROW]
[ROW][C]Winsorized Mean ( 11 / 28 )[/C][C]97.3845238095238[/C][C]0.650335307943923[/C][C]149.745097059871[/C][/ROW]
[ROW][C]Winsorized Mean ( 12 / 28 )[/C][C]97.3845238095238[/C][C]0.645927029194654[/C][C]150.767067188601[/C][/ROW]
[ROW][C]Winsorized Mean ( 13 / 28 )[/C][C]97.4773809523809[/C][C]0.626827451550608[/C][C]155.50911293251[/C][/ROW]
[ROW][C]Winsorized Mean ( 14 / 28 )[/C][C]97.5440476190476[/C][C]0.606957535866884[/C][C]160.709838588182[/C][/ROW]
[ROW][C]Winsorized Mean ( 15 / 28 )[/C][C]97.5619047619048[/C][C]0.588674193153842[/C][C]165.731581062206[/C][/ROW]
[ROW][C]Winsorized Mean ( 16 / 28 )[/C][C]97.6[/C][C]0.583284564800181[/C][C]167.328274893465[/C][/ROW]
[ROW][C]Winsorized Mean ( 17 / 28 )[/C][C]97.7011904761905[/C][C]0.563552818003196[/C][C]173.366519259667[/C][/ROW]
[ROW][C]Winsorized Mean ( 18 / 28 )[/C][C]97.4440476190476[/C][C]0.508790628438789[/C][C]191.520916802364[/C][/ROW]
[ROW][C]Winsorized Mean ( 19 / 28 )[/C][C]97.4214285714286[/C][C]0.505719074823925[/C][C]192.639418644328[/C][/ROW]
[ROW][C]Winsorized Mean ( 20 / 28 )[/C][C]97.3261904761905[/C][C]0.48663762315475[/C][C]199.997258422497[/C][/ROW]
[ROW][C]Winsorized Mean ( 21 / 28 )[/C][C]97.3011904761905[/C][C]0.483385739282934[/C][C]201.290982685028[/C][/ROW]
[ROW][C]Winsorized Mean ( 22 / 28 )[/C][C]97.4583333333333[/C][C]0.455366447019267[/C][C]214.021770754686[/C][/ROW]
[ROW][C]Winsorized Mean ( 23 / 28 )[/C][C]97.5404761904762[/C][C]0.444702092833063[/C][C]219.338918710895[/C][/ROW]
[ROW][C]Winsorized Mean ( 24 / 28 )[/C][C]97.4833333333333[/C][C]0.437226542136885[/C][C]222.958407000858[/C][/ROW]
[ROW][C]Winsorized Mean ( 25 / 28 )[/C][C]97.4238095238095[/C][C]0.429537700785302[/C][C]226.810846511713[/C][/ROW]
[ROW][C]Winsorized Mean ( 26 / 28 )[/C][C]97.5166666666667[/C][C]0.393885543503136[/C][C]247.57615067406[/C][/ROW]
[ROW][C]Winsorized Mean ( 27 / 28 )[/C][C]97.7095238095238[/C][C]0.346073040253004[/C][C]282.337866417133[/C][/ROW]
[ROW][C]Winsorized Mean ( 28 / 28 )[/C][C]97.6761904761905[/C][C]0.333596936995793[/C][C]292.797024324664[/C][/ROW]
[ROW][C]Trimmed Mean ( 1 / 28 )[/C][C]97.3365853658537[/C][C]0.807247568308859[/C][C]120.578356859927[/C][/ROW]
[ROW][C]Trimmed Mean ( 2 / 28 )[/C][C]97.32125[/C][C]0.77534739814902[/C][C]125.51954160462[/C][/ROW]
[ROW][C]Trimmed Mean ( 3 / 28 )[/C][C]97.3230769230769[/C][C]0.751012022450514[/C][C]129.589239604336[/C][/ROW]
[ROW][C]Trimmed Mean ( 4 / 28 )[/C][C]97.353947368421[/C][C]0.732641078658919[/C][C]132.880820096281[/C][/ROW]
[ROW][C]Trimmed Mean ( 5 / 28 )[/C][C]97.377027027027[/C][C]0.715465034670442[/C][C]136.103124972251[/C][/ROW]
[ROW][C]Trimmed Mean ( 6 / 28 )[/C][C]97.3916666666667[/C][C]0.698368179573641[/C][C]139.456048421515[/C][/ROW]
[ROW][C]Trimmed Mean ( 7 / 28 )[/C][C]97.4057142857143[/C][C]0.679909523009822[/C][C]143.262759219078[/C][/ROW]
[ROW][C]Trimmed Mean ( 8 / 28 )[/C][C]97.4161764705882[/C][C]0.662075017480171[/C][C]147.13767156077[/C][/ROW]
[ROW][C]Trimmed Mean ( 9 / 28 )[/C][C]97.4287878787879[/C][C]0.643460071159996[/C][C]151.413882920736[/C][/ROW]
[ROW][C]Trimmed Mean ( 10 / 28 )[/C][C]97.446875[/C][C]0.623096182725097[/C][C]156.391384992632[/C][/ROW]
[ROW][C]Trimmed Mean ( 11 / 28 )[/C][C]97.4677419354839[/C][C]0.611275915883082[/C][C]159.449668149737[/C][/ROW]
[ROW][C]Trimmed Mean ( 12 / 28 )[/C][C]97.4783333333333[/C][C]0.599793239641921[/C][C]162.519893341126[/C][/ROW]
[ROW][C]Trimmed Mean ( 13 / 28 )[/C][C]97.4896551724138[/C][C]0.586491870521128[/C][C]166.225075013895[/C][/ROW]
[ROW][C]Trimmed Mean ( 14 / 28 )[/C][C]97.4910714285714[/C][C]0.573756570772517[/C][C]169.91713279607[/C][/ROW]
[ROW][C]Trimmed Mean ( 15 / 28 )[/C][C]97.4851851851852[/C][C]0.561664986450948[/C][C]173.564647141662[/C][/ROW]
[ROW][C]Trimmed Mean ( 16 / 28 )[/C][C]97.4769230769231[/C][C]0.549904800376154[/C][C]177.261451455316[/C][/ROW]
[ROW][C]Trimmed Mean ( 17 / 28 )[/C][C]97.464[/C][C]0.535946692445114[/C][C]181.853907065545[/C][/ROW]
[ROW][C]Trimmed Mean ( 18 / 28 )[/C][C]97.4395833333333[/C][C]0.521936685918479[/C][C]186.688512155193[/C][/ROW]
[ROW][C]Trimmed Mean ( 19 / 28 )[/C][C]97.4391304347826[/C][C]0.514734378860931[/C][C]189.299830041289[/C][/ROW]
[ROW][C]Trimmed Mean ( 20 / 28 )[/C][C]97.4409090909091[/C][C]0.505501636664396[/C][C]192.760818211951[/C][/ROW]
[ROW][C]Trimmed Mean ( 21 / 28 )[/C][C]97.4523809523809[/C][C]0.496810244685635[/C][C]196.156142098168[/C][/ROW]
[ROW][C]Trimmed Mean ( 22 / 28 )[/C][C]97.4675[/C][C]0.48542061459823[/C][C]200.789783270064[/C][/ROW]
[ROW][C]Trimmed Mean ( 23 / 28 )[/C][C]97.4684210526316[/C][C]0.476012139641598[/C][C]204.760368351148[/C][/ROW]
[ROW][C]Trimmed Mean ( 24 / 28 )[/C][C]97.4611111111111[/C][C]0.46501882156443[/C][C]209.5853040598[/C][/ROW]
[ROW][C]Trimmed Mean ( 25 / 28 )[/C][C]97.4588235294118[/C][C]0.45106563559249[/C][C]216.063507922514[/C][/ROW]
[ROW][C]Trimmed Mean ( 26 / 28 )[/C][C]97.4625[/C][C]0.432960318154879[/C][C]225.107234804682[/C][/ROW]
[ROW][C]Trimmed Mean ( 27 / 28 )[/C][C]97.4566666666667[/C][C]0.417289649213824[/C][C]233.546810591338[/C][/ROW]
[ROW][C]Trimmed Mean ( 28 / 28 )[/C][C]97.4285714285714[/C][C]0.408178854577577[/C][C]238.690883508407[/C][/ROW]
[ROW][C]Median[/C][C]97.4[/C][C][/C][C][/C][/ROW]
[ROW][C]Midrange[/C][C]99.85[/C][C][/C][C][/C][/ROW]
[ROW][C]Midmean - Weighted Average at Xnp[/C][C]97.3209302325582[/C][C][/C][C][/C][/ROW]
[ROW][C]Midmean - Weighted Average at X(n+1)p[/C][C]97.3209302325582[/C][C][/C][C][/C][/ROW]
[ROW][C]Midmean - Empirical Distribution Function[/C][C]97.3209302325582[/C][C][/C][C][/C][/ROW]
[ROW][C]Midmean - Empirical Distribution Function - Averaging[/C][C]97.3209302325582[/C][C][/C][C][/C][/ROW]
[ROW][C]Midmean - Empirical Distribution Function - Interpolation[/C][C]97.3209302325582[/C][C][/C][C][/C][/ROW]
[ROW][C]Midmean - Closest Observation[/C][C]97.3209302325582[/C][C][/C][C][/C][/ROW]
[ROW][C]Midmean - True Basic - Statistics Graphics Toolkit[/C][C]97.3209302325582[/C][C][/C][C][/C][/ROW]
[ROW][C]Midmean - MS Excel (old versions)[/C][C]97.4409090909091[/C][C][/C][C][/C][/ROW]
[ROW][C]Number of observations[/C][C]84[/C][C][/C][C][/C][/ROW]
[/TABLE]
Source: https://freestatistics.org/blog/index.php?pk=214878&T=1

Globally Unique Identifier (entire table): ba.freestatistics.org/blog/index.php?pk=214878&T=1

As an alternative you can also use a QR Code:  

The GUIDs for individual cells are displayed in the table below:

Central Tendency - Ungrouped Data
MeasureValueS.E.Value/S.E.
Arithmetic Mean97.39642857142860.867946856292908112.214737417702
Geometric Mean97.0744487373466
Harmonic Mean96.7510303805367
Quadratic Mean97.7168912385844
Winsorized Mean ( 1 / 28 )97.35119047619050.834661295405656116.63556344598
Winsorized Mean ( 2 / 28 )97.31785714285710.814303359865578119.510568099488
Winsorized Mean ( 3 / 28 )97.23928571428570.791751469668452122.815415492699
Winsorized Mean ( 4 / 28 )97.2726190476190.779479634281449124.791738962222
Winsorized Mean ( 5 / 28 )97.31428571428570.769180336654466126.51686617153
Winsorized Mean ( 6 / 28 )97.32142857142860.762655834980165127.608580578105
Winsorized Mean ( 7 / 28 )97.34642857142860.746226780158432130.451534519789
Winsorized Mean ( 8 / 28 )97.33690476190480.734696185295015132.48592644158
Winsorized Mean ( 9 / 28 )97.30476190476190.725735634388277134.077420611681
Winsorized Mean ( 10 / 28 )97.29285714285710.665259097210091146.248067182961
Winsorized Mean ( 11 / 28 )97.38452380952380.650335307943923149.745097059871
Winsorized Mean ( 12 / 28 )97.38452380952380.645927029194654150.767067188601
Winsorized Mean ( 13 / 28 )97.47738095238090.626827451550608155.50911293251
Winsorized Mean ( 14 / 28 )97.54404761904760.606957535866884160.709838588182
Winsorized Mean ( 15 / 28 )97.56190476190480.588674193153842165.731581062206
Winsorized Mean ( 16 / 28 )97.60.583284564800181167.328274893465
Winsorized Mean ( 17 / 28 )97.70119047619050.563552818003196173.366519259667
Winsorized Mean ( 18 / 28 )97.44404761904760.508790628438789191.520916802364
Winsorized Mean ( 19 / 28 )97.42142857142860.505719074823925192.639418644328
Winsorized Mean ( 20 / 28 )97.32619047619050.48663762315475199.997258422497
Winsorized Mean ( 21 / 28 )97.30119047619050.483385739282934201.290982685028
Winsorized Mean ( 22 / 28 )97.45833333333330.455366447019267214.021770754686
Winsorized Mean ( 23 / 28 )97.54047619047620.444702092833063219.338918710895
Winsorized Mean ( 24 / 28 )97.48333333333330.437226542136885222.958407000858
Winsorized Mean ( 25 / 28 )97.42380952380950.429537700785302226.810846511713
Winsorized Mean ( 26 / 28 )97.51666666666670.393885543503136247.57615067406
Winsorized Mean ( 27 / 28 )97.70952380952380.346073040253004282.337866417133
Winsorized Mean ( 28 / 28 )97.67619047619050.333596936995793292.797024324664
Trimmed Mean ( 1 / 28 )97.33658536585370.807247568308859120.578356859927
Trimmed Mean ( 2 / 28 )97.321250.77534739814902125.51954160462
Trimmed Mean ( 3 / 28 )97.32307692307690.751012022450514129.589239604336
Trimmed Mean ( 4 / 28 )97.3539473684210.732641078658919132.880820096281
Trimmed Mean ( 5 / 28 )97.3770270270270.715465034670442136.103124972251
Trimmed Mean ( 6 / 28 )97.39166666666670.698368179573641139.456048421515
Trimmed Mean ( 7 / 28 )97.40571428571430.679909523009822143.262759219078
Trimmed Mean ( 8 / 28 )97.41617647058820.662075017480171147.13767156077
Trimmed Mean ( 9 / 28 )97.42878787878790.643460071159996151.413882920736
Trimmed Mean ( 10 / 28 )97.4468750.623096182725097156.391384992632
Trimmed Mean ( 11 / 28 )97.46774193548390.611275915883082159.449668149737
Trimmed Mean ( 12 / 28 )97.47833333333330.599793239641921162.519893341126
Trimmed Mean ( 13 / 28 )97.48965517241380.586491870521128166.225075013895
Trimmed Mean ( 14 / 28 )97.49107142857140.573756570772517169.91713279607
Trimmed Mean ( 15 / 28 )97.48518518518520.561664986450948173.564647141662
Trimmed Mean ( 16 / 28 )97.47692307692310.549904800376154177.261451455316
Trimmed Mean ( 17 / 28 )97.4640.535946692445114181.853907065545
Trimmed Mean ( 18 / 28 )97.43958333333330.521936685918479186.688512155193
Trimmed Mean ( 19 / 28 )97.43913043478260.514734378860931189.299830041289
Trimmed Mean ( 20 / 28 )97.44090909090910.505501636664396192.760818211951
Trimmed Mean ( 21 / 28 )97.45238095238090.496810244685635196.156142098168
Trimmed Mean ( 22 / 28 )97.46750.48542061459823200.789783270064
Trimmed Mean ( 23 / 28 )97.46842105263160.476012139641598204.760368351148
Trimmed Mean ( 24 / 28 )97.46111111111110.46501882156443209.5853040598
Trimmed Mean ( 25 / 28 )97.45882352941180.45106563559249216.063507922514
Trimmed Mean ( 26 / 28 )97.46250.432960318154879225.107234804682
Trimmed Mean ( 27 / 28 )97.45666666666670.417289649213824233.546810591338
Trimmed Mean ( 28 / 28 )97.42857142857140.408178854577577238.690883508407
Median97.4
Midrange99.85
Midmean - Weighted Average at Xnp97.3209302325582
Midmean - Weighted Average at X(n+1)p97.3209302325582
Midmean - Empirical Distribution Function97.3209302325582
Midmean - Empirical Distribution Function - Averaging97.3209302325582
Midmean - Empirical Distribution Function - Interpolation97.3209302325582
Midmean - Closest Observation97.3209302325582
Midmean - True Basic - Statistics Graphics Toolkit97.3209302325582
Midmean - MS Excel (old versions)97.4409090909091
Number of observations84


Parameters (Session):
Parameters (R input):
R code (references can be found in the software module):
geomean <- function(x) {
return(exp(mean(log(x))))
}
harmean <- function(x) {
return(1/mean(1/x))
}
quamean <- function(x) {
return(sqrt(mean(x*x)))
}
winmean <- function(x) {
x <-sort(x[!is.na(x)])
n<-length(x)
denom <- 3
nodenom <- n/denom
if (nodenom>40) denom <- n/40
sqrtn = sqrt(n)
roundnodenom = floor(nodenom)
win <- array(NA,dim=c(roundnodenom,2))
for (j in 1:roundnodenom) {
win[j,1] <- (j*x[j+1]+sum(x[(j+1):(n-j)])+j*x[n-j])/n
win[j,2] <- sd(c(rep(x[j+1],j),x[(j+1):(n-j)],rep(x[n-j],j)))/sqrtn
}
return(win)
}
trimean <- function(x) {
x <-sort(x[!is.na(x)])
n<-length(x)
denom <- 3
nodenom <- n/denom
if (nodenom>40) denom <- n/40
sqrtn = sqrt(n)
roundnodenom = floor(nodenom)
tri <- array(NA,dim=c(roundnodenom,2))
for (j in 1:roundnodenom) {
tri[j,1] <- mean(x,trim=j/n)
tri[j,2] <- sd(x[(j+1):(n-j)]) / sqrt(n-j*2)
}
return(tri)
}
midrange <- function(x) {
return((max(x)+min(x))/2)
}
q1 <- function(data,n,p,i,f) {
np <- n*p;
i <<- floor(np)
f <<- np - i
qvalue <- (1-f)*data[i] + f*data[i+1]
}
q2 <- function(data,n,p,i,f) {
np <- (n+1)*p
i <<- floor(np)
f <<- np - i
qvalue <- (1-f)*data[i] + f*data[i+1]
}
q3 <- function(data,n,p,i,f) {
np <- n*p
i <<- floor(np)
f <<- np - i
if (f==0) {
qvalue <- data[i]
} else {
qvalue <- data[i+1]
}
}
q4 <- function(data,n,p,i,f) {
np <- n*p
i <<- floor(np)
f <<- np - i
if (f==0) {
qvalue <- (data[i]+data[i+1])/2
} else {
qvalue <- data[i+1]
}
}
q5 <- function(data,n,p,i,f) {
np <- (n-1)*p
i <<- floor(np)
f <<- np - i
if (f==0) {
qvalue <- data[i+1]
} else {
qvalue <- data[i+1] + f*(data[i+2]-data[i+1])
}
}
q6 <- function(data,n,p,i,f) {
np <- n*p+0.5
i <<- floor(np)
f <<- np - i
qvalue <- data[i]
}
q7 <- function(data,n,p,i,f) {
np <- (n+1)*p
i <<- floor(np)
f <<- np - i
if (f==0) {
qvalue <- data[i]
} else {
qvalue <- f*data[i] + (1-f)*data[i+1]
}
}
q8 <- function(data,n,p,i,f) {
np <- (n+1)*p
i <<- floor(np)
f <<- np - i
if (f==0) {
qvalue <- data[i]
} else {
if (f == 0.5) {
qvalue <- (data[i]+data[i+1])/2
} else {
if (f < 0.5) {
qvalue <- data[i]
} else {
qvalue <- data[i+1]
}
}
}
}
midmean <- function(x,def) {
x <-sort(x[!is.na(x)])
n<-length(x)
if (def==1) {
qvalue1 <- q1(x,n,0.25,i,f)
qvalue3 <- q1(x,n,0.75,i,f)
}
if (def==2) {
qvalue1 <- q2(x,n,0.25,i,f)
qvalue3 <- q2(x,n,0.75,i,f)
}
if (def==3) {
qvalue1 <- q3(x,n,0.25,i,f)
qvalue3 <- q3(x,n,0.75,i,f)
}
if (def==4) {
qvalue1 <- q4(x,n,0.25,i,f)
qvalue3 <- q4(x,n,0.75,i,f)
}
if (def==5) {
qvalue1 <- q5(x,n,0.25,i,f)
qvalue3 <- q5(x,n,0.75,i,f)
}
if (def==6) {
qvalue1 <- q6(x,n,0.25,i,f)
qvalue3 <- q6(x,n,0.75,i,f)
}
if (def==7) {
qvalue1 <- q7(x,n,0.25,i,f)
qvalue3 <- q7(x,n,0.75,i,f)
}
if (def==8) {
qvalue1 <- q8(x,n,0.25,i,f)
qvalue3 <- q8(x,n,0.75,i,f)
}
midm <- 0
myn <- 0
roundno4 <- round(n/4)
round3no4 <- round(3*n/4)
for (i in 1:n) {
if ((x[i]>=qvalue1) & (x[i]<=qvalue3)){
midm = midm + x[i]
myn = myn + 1
}
}
midm = midm / myn
return(midm)
}
(arm <- mean(x))
sqrtn <- sqrt(length(x))
(armse <- sd(x) / sqrtn)
(armose <- arm / armse)
(geo <- geomean(x))
(har <- harmean(x))
(qua <- quamean(x))
(win <- winmean(x))
(tri <- trimean(x))
(midr <- midrange(x))
midm <- array(NA,dim=8)
for (j in 1:8) midm[j] <- midmean(x,j)
midm
bitmap(file='test1.png')
lb <- win[,1] - 2*win[,2]
ub <- win[,1] + 2*win[,2]
if ((ylimmin == '') | (ylimmax == '')) plot(win[,1],type='b',main=main, xlab='j', pch=19, ylab='Winsorized Mean(j/n)', ylim=c(min(lb),max(ub))) else plot(win[,1],type='l',main=main, xlab='j', pch=19, ylab='Winsorized Mean(j/n)', ylim=c(ylimmin,ylimmax))
lines(ub,lty=3)
lines(lb,lty=3)
grid()
dev.off()
bitmap(file='test2.png')
lb <- tri[,1] - 2*tri[,2]
ub <- tri[,1] + 2*tri[,2]
if ((ylimmin == '') | (ylimmax == '')) plot(tri[,1],type='b',main=main, xlab='j', pch=19, ylab='Trimmed Mean(j/n)', ylim=c(min(lb),max(ub))) else plot(tri[,1],type='l',main=main, xlab='j', pch=19, ylab='Trimmed Mean(j/n)', ylim=c(ylimmin,ylimmax))
lines(ub,lty=3)
lines(lb,lty=3)
grid()
dev.off()
load(file='createtable')
a<-table.start()
a<-table.row.start(a)
a<-table.element(a,'Central Tendency - Ungrouped Data',4,TRUE)
a<-table.row.end(a)
a<-table.row.start(a)
a<-table.element(a,'Measure',header=TRUE)
a<-table.element(a,'Value',header=TRUE)
a<-table.element(a,'S.E.',header=TRUE)
a<-table.element(a,'Value/S.E.',header=TRUE)
a<-table.row.end(a)
a<-table.row.start(a)
a<-table.element(a,hyperlink('arithmetic_mean.htm', 'Arithmetic Mean', 'click to view the definition of the Arithmetic Mean'),header=TRUE)
a<-table.element(a,arm)
a<-table.element(a,hyperlink('arithmetic_mean_standard_error.htm', armse, 'click to view the definition of the Standard Error of the Arithmetic Mean'))
a<-table.element(a,armose)
a<-table.row.end(a)
a<-table.row.start(a)
a<-table.element(a,hyperlink('geometric_mean.htm', 'Geometric Mean', 'click to view the definition of the Geometric Mean'),header=TRUE)
a<-table.element(a,geo)
a<-table.element(a,'')
a<-table.row.end(a)
a<-table.row.start(a)
a<-table.element(a,hyperlink('harmonic_mean.htm', 'Harmonic Mean', 'click to view the definition of the Harmonic Mean'),header=TRUE)
a<-table.element(a,har)
a<-table.element(a,'')
a<-table.row.end(a)
a<-table.row.start(a)
a<-table.element(a,hyperlink('quadratic_mean.htm', 'Quadratic Mean', 'click to view the definition of the Quadratic Mean'),header=TRUE)
a<-table.element(a,qua)
a<-table.element(a,'')
a<-table.row.end(a)
for (j in 1:length(win[,1])) {
a<-table.row.start(a)
mylabel <- paste('Winsorized Mean (',j)
mylabel <- paste(mylabel,'/')
mylabel <- paste(mylabel,length(win[,1]))
mylabel <- paste(mylabel,')')
a<-table.element(a,hyperlink('winsorized_mean.htm', mylabel, 'click to view the definition of the Winsorized Mean'),header=TRUE)
a<-table.element(a,win[j,1])
a<-table.element(a,win[j,2])
a<-table.element(a,win[j,1]/win[j,2])
a<-table.row.end(a)
}
for (j in 1:length(tri[,1])) {
a<-table.row.start(a)
mylabel <- paste('Trimmed Mean (',j)
mylabel <- paste(mylabel,'/')
mylabel <- paste(mylabel,length(tri[,1]))
mylabel <- paste(mylabel,')')
a<-table.element(a,hyperlink('arithmetic_mean.htm', mylabel, 'click to view the definition of the Trimmed Mean'),header=TRUE)
a<-table.element(a,tri[j,1])
a<-table.element(a,tri[j,2])
a<-table.element(a,tri[j,1]/tri[j,2])
a<-table.row.end(a)
}
a<-table.row.start(a)
a<-table.element(a,hyperlink('median_1.htm', 'Median', 'click to view the definition of the Median'),header=TRUE)
a<-table.element(a,median(x))
a<-table.element(a,'')
a<-table.row.end(a)
a<-table.row.start(a)
a<-table.element(a,hyperlink('midrange.htm', 'Midrange', 'click to view the definition of the Midrange'),header=TRUE)
a<-table.element(a,midr)
a<-table.element(a,'')
a<-table.row.end(a)
a<-table.row.start(a)
mymid <- hyperlink('midmean.htm', 'Midmean', 'click to view the definition of the Midmean')
mylabel <- paste(mymid,hyperlink('method_1.htm','Weighted Average at Xnp',''),sep=' - ')
a<-table.element(a,mylabel,header=TRUE)
a<-table.element(a,midm[1])
a<-table.element(a,'')
a<-table.row.end(a)
a<-table.row.start(a)
mymid <- hyperlink('midmean.htm', 'Midmean', 'click to view the definition of the Midmean')
mylabel <- paste(mymid,hyperlink('method_2.htm','Weighted Average at X(n+1)p',''),sep=' - ')
a<-table.element(a,mylabel,header=TRUE)
a<-table.element(a,midm[2])
a<-table.element(a,'')
a<-table.row.end(a)
a<-table.row.start(a)
mymid <- hyperlink('midmean.htm', 'Midmean', 'click to view the definition of the Midmean')
mylabel <- paste(mymid,hyperlink('method_3.htm','Empirical Distribution Function',''),sep=' - ')
a<-table.element(a,mylabel,header=TRUE)
a<-table.element(a,midm[3])
a<-table.element(a,'')
a<-table.row.end(a)
a<-table.row.start(a)
mymid <- hyperlink('midmean.htm', 'Midmean', 'click to view the definition of the Midmean')
mylabel <- paste(mymid,hyperlink('method_4.htm','Empirical Distribution Function - Averaging',''),sep=' - ')
a<-table.element(a,mylabel,header=TRUE)
a<-table.element(a,midm[4])
a<-table.element(a,'')
a<-table.row.end(a)
a<-table.row.start(a)
mymid <- hyperlink('midmean.htm', 'Midmean', 'click to view the definition of the Midmean')
mylabel <- paste(mymid,hyperlink('method_5.htm','Empirical Distribution Function - Interpolation',''),sep=' - ')
a<-table.element(a,mylabel,header=TRUE)
a<-table.element(a,midm[5])
a<-table.element(a,'')
a<-table.row.end(a)
a<-table.row.start(a)
mymid <- hyperlink('midmean.htm', 'Midmean', 'click to view the definition of the Midmean')
mylabel <- paste(mymid,hyperlink('method_6.htm','Closest Observation',''),sep=' - ')
a<-table.element(a,mylabel,header=TRUE)
a<-table.element(a,midm[6])
a<-table.element(a,'')
a<-table.row.end(a)
a<-table.row.start(a)
mymid <- hyperlink('midmean.htm', 'Midmean', 'click to view the definition of the Midmean')
mylabel <- paste(mymid,hyperlink('method_7.htm','True Basic - Statistics Graphics Toolkit',''),sep=' - ')
a<-table.element(a,mylabel,header=TRUE)
a<-table.element(a,midm[7])
a<-table.element(a,'')
a<-table.row.end(a)
a<-table.row.start(a)
mymid <- hyperlink('midmean.htm', 'Midmean', 'click to view the definition of the Midmean')
mylabel <- paste(mymid,hyperlink('method_8.htm','MS Excel (old versions)',''),sep=' - ')
a<-table.element(a,mylabel,header=TRUE)
a<-table.element(a,midm[8])
a<-table.element(a,'')
a<-table.row.end(a)
a<-table.row.start(a)
a<-table.element(a,'Number of observations',header=TRUE)
a<-table.element(a,length(x))
a<-table.element(a,'')
a<-table.row.end(a)
a<-table.end(a)
table.save(a,file='mytable.tab')