Free Statistics
of Irreproducible Research!
Description of Statistical Computation | |||||||||||||||||||||||||||||||||
|---|---|---|---|---|---|---|---|---|---|---|---|---|---|---|---|---|---|---|---|---|---|---|---|---|---|---|---|---|---|---|---|---|---|
| Author's title | |||||||||||||||||||||||||||||||||
| Author | *Unverified author* | ||||||||||||||||||||||||||||||||
| R Software Module | rwasp_meanversusmedian.wasp | ||||||||||||||||||||||||||||||||
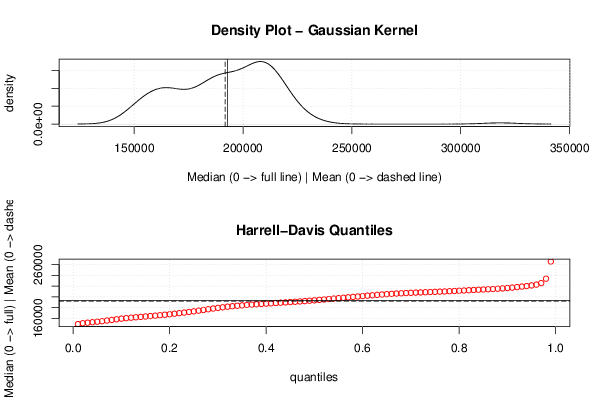
| Title produced by software | Mean versus Median | ||||||||||||||||||||||||||||||||
| Date of computation | Sat, 12 Oct 2013 08:04:23 -0400 | ||||||||||||||||||||||||||||||||
| Cite this page as follows | Statistical Computations at FreeStatistics.org, Office for Research Development and Education, URL https://freestatistics.org/blog/index.php?v=date/2013/Oct/12/t1381579486057dlxn65h6r4xd.htm/, Retrieved Sun, 28 Apr 2024 21:59:10 +0000 | ||||||||||||||||||||||||||||||||
| Statistical Computations at FreeStatistics.org, Office for Research Development and Education, URL https://freestatistics.org/blog/index.php?pk=214903, Retrieved Sun, 28 Apr 2024 21:59:10 +0000 | |||||||||||||||||||||||||||||||||
| QR Codes: | |||||||||||||||||||||||||||||||||
|
| |||||||||||||||||||||||||||||||||
| Original text written by user: | |||||||||||||||||||||||||||||||||
| IsPrivate? | No (this computation is public) | ||||||||||||||||||||||||||||||||
| User-defined keywords | |||||||||||||||||||||||||||||||||
| Estimated Impact | 89 | ||||||||||||||||||||||||||||||||
Tree of Dependent Computations | |||||||||||||||||||||||||||||||||
| Family? (F = Feedback message, R = changed R code, M = changed R Module, P = changed Parameters, D = changed Data) | |||||||||||||||||||||||||||||||||
| - [Mean versus Median] [Wekelijkse verkoo...] [2013-10-12 12:04:23] [74a92a9d3a2c9c03f2186ea574174bd1] [Current] | |||||||||||||||||||||||||||||||||
| Feedback Forum | |||||||||||||||||||||||||||||||||
Post a new message | |||||||||||||||||||||||||||||||||
Dataset | |||||||||||||||||||||||||||||||||
| Dataseries X: | |||||||||||||||||||||||||||||||||
221102 220892 225537 219334 216126 224573 213991 221865 215382 213962 217009 318110 219662 212650 209307 210541 210609 208910 207541 207699 205005 205747 203644 229937 214446 210194 206535 216524 198243 208274 207493 215525 207562 213355 209048 220497 214563 211571 216385 211496 209683 206304 213925 204829 205729 200296 207960 207729 208327 207794 213700 213136 210354 202205 220425 210038 205201 197441 200021 203165 201699 201003 232308 211412 209661 213587 193611 192543 196040 191407 189726 191272 187924 198213 199352 199289 195475 198045 197615 189015 189668 189120 194168 192304 185913 197599 186085 190566 187054 193222 189856 190608 190588 186773 183510 180106 180150 178412 182353 203805 186054 184290 187483 187111 189561 184439 182985 183828 184036 183214 183464 173718 180210 171252 172705 174006 172043 169445 169449 177073 170799 171648 172220 165795 167466 165528 162851 165864 162094 162385 164293 165983 159680 161739 159302 167795 164242 159743 160887 163844 161172 159330 155570 156749 155012 163419 153630 154535 151543 152955 150166 151416 150332 152196 153422 147435 | |||||||||||||||||||||||||||||||||
Tables (Output of Computation) | |||||||||||||||||||||||||||||||||
| |||||||||||||||||||||||||||||||||
Figures (Output of Computation) | |||||||||||||||||||||||||||||||||
Input Parameters & R Code | |||||||||||||||||||||||||||||||||
| Parameters (Session): | |||||||||||||||||||||||||||||||||
| Parameters (R input): | |||||||||||||||||||||||||||||||||
| R code (references can be found in the software module): | |||||||||||||||||||||||||||||||||
library(Hmisc) | |||||||||||||||||||||||||||||||||