Free Statistics

of Irreproducible Research!

Author's title

Author*Unverified author*
R Software Modulerwasp_centraltendency.wasp
Title produced by softwareCentral Tendency
Date of computationSat, 12 Oct 2013 11:49:51 -0400
Cite this page as followsStatistical Computations at FreeStatistics.org, Office for Research Development and Education, URL https://freestatistics.org/blog/index.php?v=date/2013/Oct/12/t1381592999opkicv24051xxg9.htm/, Retrieved Mon, 29 Apr 2024 02:25:28 +0000
Statistical Computations at FreeStatistics.org, Office for Research Development and Education, URL https://freestatistics.org/blog/index.php?pk=214958, Retrieved Mon, 29 Apr 2024 02:25:28 +0000
QR Codes:

Original text written by user:
IsPrivate?No (this computation is public)
User-defined keywords
Estimated Impact73
Family? (F = Feedback message, R = changed R code, M = changed R Module, P = changed Parameters, D = changed Data)
-       [Central Tendency] [] [2013-10-12 15:49:51] [655b7e86b856b1a975cbf3a4c6f4d54e] [Current]
Feedback Forum

Post a new message
Dataseries X:
5731
5040
6102
4904
5369
5578
4619
4731
5011
5227
4146
4625
4736
4219
5116
4205
4121
5103
4300
4578
3809
5657
4249
3830
4736
4840
4413
4571
4106
4801
3956
3829
4453
4027
4121
4798
3233
3554
3952
3951
3685
4312
3867
4140
4114
3818
3377
3453
3502
4017
5410
5184
5529
6434
4962
2980
2937
2969
2731
3163
3145
3173
3723
3224
4114
3446
2955
3879
4278
4177
3698
4449
4162
3961
5246
5170
3682
3495
3770
3291
3580
3898
3477
3054


Summary of computational transaction
Raw Inputview raw input (R code)
Raw Outputview raw output of R engine
Computing time2 seconds
R Server'Sir Maurice George Kendall' @ kendall.wessa.net

\begin{tabular}{lllllllll}
\hline
Summary of computational transaction \tabularnewline
Raw Input & view raw input (R code)  \tabularnewline
Raw Output & view raw output of R engine  \tabularnewline
Computing time & 2 seconds \tabularnewline
R Server & 'Sir Maurice George Kendall' @ kendall.wessa.net \tabularnewline
\hline
\end{tabular}
%Source: https://freestatistics.org/blog/index.php?pk=214958&T=0

[TABLE]
[ROW][C]Summary of computational transaction[/C][/ROW]
[ROW][C]Raw Input[/C][C]view raw input (R code) [/C][/ROW]
[ROW][C]Raw Output[/C][C]view raw output of R engine [/C][/ROW]
[ROW][C]Computing time[/C][C]2 seconds[/C][/ROW]
[ROW][C]R Server[/C][C]'Sir Maurice George Kendall' @ kendall.wessa.net[/C][/ROW]
[/TABLE]
Source: https://freestatistics.org/blog/index.php?pk=214958&T=0

Globally Unique Identifier (entire table): ba.freestatistics.org/blog/index.php?pk=214958&T=0

As an alternative you can also use a QR Code:  

The GUIDs for individual cells are displayed in the table below:

Summary of computational transaction
Raw Inputview raw input (R code)
Raw Outputview raw output of R engine
Computing time2 seconds
R Server'Sir Maurice George Kendall' @ kendall.wessa.net


Central Tendency - Ungrouped Data
MeasureValueS.E.Value/S.E.
Arithmetic Mean4214.0238095238186.896361361997348.4948246793535
Geometric Mean4140.97456074276
Harmonic Mean4069.26832333067
Quadratic Mean4287.74157447995
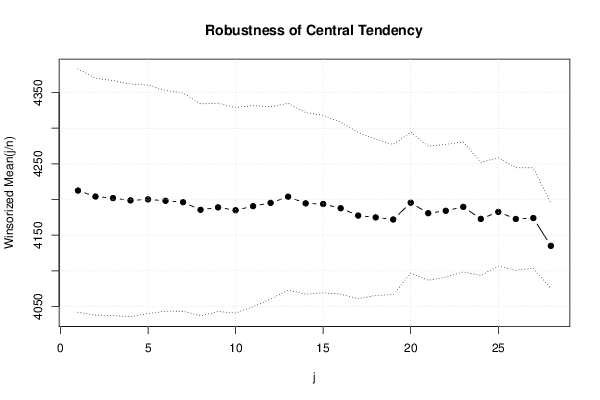
Winsorized Mean ( 1 / 28 )4212.5238095238185.286477645233749.3926343991676
Winsorized Mean ( 2 / 28 )4204.1190476190583.049136283952950.6220682806955
Winsorized Mean ( 3 / 28 )4201.9761904761982.384815845321951.0042554245121
Winsorized Mean ( 4 / 28 )4198.738095238181.506586323956951.5140957879128
Winsorized Mean ( 5 / 28 )4200.2261904761980.141465124835852.410149776193
Winsorized Mean ( 6 / 28 )4198.2261904761977.396586476157754.2430407026991
Winsorized Mean ( 7 / 28 )4196.3095238095276.513838376136154.8437983620792
Winsorized Mean ( 8 / 28 )4185.5476190476274.267863502809356.35745289602
Winsorized Mean ( 9 / 28 )4188.9761904761973.034629311407957.3560272705031
Winsorized Mean ( 10 / 28 )4184.9285714285771.997734525050258.1258368618877
Winsorized Mean ( 11 / 28 )4190.6904761904870.502021178838159.4407139840744
Winsorized Mean ( 12 / 28 )4195.261904761967.376895496691862.2655863532313
Winsorized Mean ( 13 / 28 )4203.9285714285765.519046789256464.1634574591814
Winsorized Mean ( 14 / 28 )4194.5952380952463.647318099632965.9037232571066
Winsorized Mean ( 15 / 28 )4193.7023809523862.22492831567167.3958571663991
Winsorized Mean ( 16 / 28 )4187.7976190476260.288921837409369.4621414916246
Winsorized Mean ( 17 / 28 )4177.4761904761958.30234192607571.6519448871035
Winsorized Mean ( 18 / 28 )4174.9047619047654.728253773145776.2842677058577
Winsorized Mean ( 19 / 28 )4171.9642857142952.646946077394979.2441840706428
Winsorized Mean ( 20 / 28 )4195.5357142857149.372407944274784.9773363094038
Winsorized Mean ( 21 / 28 )4180.7857142857147.035319767496988.886091025893
Winsorized Mean ( 22 / 28 )4184.1904761904846.605143886251489.7795849832108
Winsorized Mean ( 23 / 28 )4189.6666666666745.556819362195391.9657413604121
Winsorized Mean ( 24 / 28 )4172.8095238095239.6513074645231105.237627474025
Winsorized Mean ( 25 / 28 )4182.6309523809538.0069436078486110.049126694766
Winsorized Mean ( 26 / 28 )4172.7261904761935.9360142111098116.115442462903
Winsorized Mean ( 27 / 28 )4174.011904761935.2113750578096118.541576348809
Winsorized Mean ( 28 / 28 )4135.011904761929.9734271970487137.955926013327
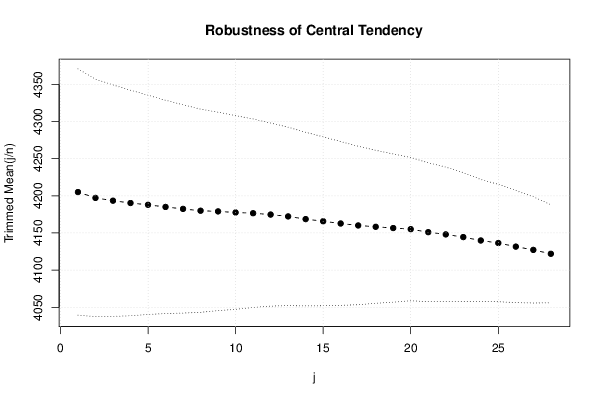
Trimmed Mean ( 1 / 28 )4205.0365853658582.77694920580250.7996081724538
Trimmed Mean ( 2 / 28 )4197.17579.853314442993852.5610618579434
Trimmed Mean ( 3 / 28 )4193.435897435977.853208504895253.8633664298142
Trimmed Mean ( 4 / 28 )4190.2894736842175.812654167071355.2716366379933
Trimmed Mean ( 5 / 28 )4187.8918918918973.735316606470856.7962827669526
Trimmed Mean ( 6 / 28 )4185.0138888888971.706833085913758.3628325054423
Trimmed Mean ( 7 / 28 )4182.3714285714370.052524427356459.7033649074059
Trimmed Mean ( 8 / 28 )4179.9117647058868.302690766735961.1968828428871
Trimmed Mean ( 9 / 28 )4179.0151515151566.732679994278462.6232177678681
Trimmed Mean ( 10 / 28 )4177.562565.112051903433364.1595891678499
Trimmed Mean ( 11 / 28 )4176.5645161290363.372533995634865.9049631251406
Trimmed Mean ( 12 / 28 )4174.7666666666761.564982740285767.8107339732082
Trimmed Mean ( 13 / 28 )4172.2931034482859.982776357389869.5581858130222
Trimmed Mean ( 14 / 28 )4168.6428571428658.38826841654771.3952129459191
Trimmed Mean ( 15 / 28 )4165.7592592592656.784462195920673.3609001153581
Trimmed Mean ( 16 / 28 )4162.7555.057750258244775.6069759566073
Trimmed Mean ( 17 / 28 )4160.1253.27678699633778.0850391801223
Trimmed Mean ( 18 / 28 )4158.3333333333351.431143576152680.8524377292176
Trimmed Mean ( 19 / 28 )4156.6521739130449.818358153131983.4361534183103
Trimmed Mean ( 20 / 28 )4155.1136363636448.167543833723486.2637640546356
Trimmed Mean ( 21 / 28 )4151.0714285714346.677202139821988.9314534349524
Trimmed Mean ( 22 / 28 )4148.145.235208660556791.7006933941034
Trimmed Mean ( 23 / 28 )4144.4736842105343.359897448512695.583106236168
Trimmed Mean ( 24 / 28 )4139.8888888888941.0282863666879100.903285403852
Trimmed Mean ( 25 / 28 )4136.539.4756462751575104.786124872214
Trimmed Mean ( 26 / 28 )4131.6562537.6693651033344109.682131319869
Trimmed Mean ( 27 / 28 )4127.2333333333335.7101899019768115.575787881903
Trimmed Mean ( 28 / 28 )4122.0357142857132.9905182042238124.946073558735
Median4121
Midrange4582.5
Midmean - Weighted Average at Xnp4140.16279069767
Midmean - Weighted Average at X(n+1)p4151.07142857143
Midmean - Empirical Distribution Function4140.16279069767
Midmean - Empirical Distribution Function - Averaging4151.07142857143
Midmean - Empirical Distribution Function - Interpolation4151.07142857143
Midmean - Closest Observation4140.16279069767
Midmean - True Basic - Statistics Graphics Toolkit4151.07142857143
Midmean - MS Excel (old versions)4155.11363636364
Number of observations84

\begin{tabular}{lllllllll}
\hline
Central Tendency - Ungrouped Data \tabularnewline
Measure & Value & S.E. & Value/S.E. \tabularnewline
Arithmetic Mean & 4214.02380952381 & 86.8963613619973 & 48.4948246793535 \tabularnewline
Geometric Mean & 4140.97456074276 &  &  \tabularnewline
Harmonic Mean & 4069.26832333067 &  &  \tabularnewline
Quadratic Mean & 4287.74157447995 &  &  \tabularnewline
Winsorized Mean ( 1 / 28 ) & 4212.52380952381 & 85.2864776452337 & 49.3926343991676 \tabularnewline
Winsorized Mean ( 2 / 28 ) & 4204.11904761905 & 83.0491362839529 & 50.6220682806955 \tabularnewline
Winsorized Mean ( 3 / 28 ) & 4201.97619047619 & 82.3848158453219 & 51.0042554245121 \tabularnewline
Winsorized Mean ( 4 / 28 ) & 4198.7380952381 & 81.5065863239569 & 51.5140957879128 \tabularnewline
Winsorized Mean ( 5 / 28 ) & 4200.22619047619 & 80.1414651248358 & 52.410149776193 \tabularnewline
Winsorized Mean ( 6 / 28 ) & 4198.22619047619 & 77.3965864761577 & 54.2430407026991 \tabularnewline
Winsorized Mean ( 7 / 28 ) & 4196.30952380952 & 76.5138383761361 & 54.8437983620792 \tabularnewline
Winsorized Mean ( 8 / 28 ) & 4185.54761904762 & 74.2678635028093 & 56.35745289602 \tabularnewline
Winsorized Mean ( 9 / 28 ) & 4188.97619047619 & 73.0346293114079 & 57.3560272705031 \tabularnewline
Winsorized Mean ( 10 / 28 ) & 4184.92857142857 & 71.9977345250502 & 58.1258368618877 \tabularnewline
Winsorized Mean ( 11 / 28 ) & 4190.69047619048 & 70.5020211788381 & 59.4407139840744 \tabularnewline
Winsorized Mean ( 12 / 28 ) & 4195.2619047619 & 67.3768954966918 & 62.2655863532313 \tabularnewline
Winsorized Mean ( 13 / 28 ) & 4203.92857142857 & 65.5190467892564 & 64.1634574591814 \tabularnewline
Winsorized Mean ( 14 / 28 ) & 4194.59523809524 & 63.6473180996329 & 65.9037232571066 \tabularnewline
Winsorized Mean ( 15 / 28 ) & 4193.70238095238 & 62.224928315671 & 67.3958571663991 \tabularnewline
Winsorized Mean ( 16 / 28 ) & 4187.79761904762 & 60.2889218374093 & 69.4621414916246 \tabularnewline
Winsorized Mean ( 17 / 28 ) & 4177.47619047619 & 58.302341926075 & 71.6519448871035 \tabularnewline
Winsorized Mean ( 18 / 28 ) & 4174.90476190476 & 54.7282537731457 & 76.2842677058577 \tabularnewline
Winsorized Mean ( 19 / 28 ) & 4171.96428571429 & 52.6469460773949 & 79.2441840706428 \tabularnewline
Winsorized Mean ( 20 / 28 ) & 4195.53571428571 & 49.3724079442747 & 84.9773363094038 \tabularnewline
Winsorized Mean ( 21 / 28 ) & 4180.78571428571 & 47.0353197674969 & 88.886091025893 \tabularnewline
Winsorized Mean ( 22 / 28 ) & 4184.19047619048 & 46.6051438862514 & 89.7795849832108 \tabularnewline
Winsorized Mean ( 23 / 28 ) & 4189.66666666667 & 45.5568193621953 & 91.9657413604121 \tabularnewline
Winsorized Mean ( 24 / 28 ) & 4172.80952380952 & 39.6513074645231 & 105.237627474025 \tabularnewline
Winsorized Mean ( 25 / 28 ) & 4182.63095238095 & 38.0069436078486 & 110.049126694766 \tabularnewline
Winsorized Mean ( 26 / 28 ) & 4172.72619047619 & 35.9360142111098 & 116.115442462903 \tabularnewline
Winsorized Mean ( 27 / 28 ) & 4174.0119047619 & 35.2113750578096 & 118.541576348809 \tabularnewline
Winsorized Mean ( 28 / 28 ) & 4135.0119047619 & 29.9734271970487 & 137.955926013327 \tabularnewline
Trimmed Mean ( 1 / 28 ) & 4205.03658536585 & 82.776949205802 & 50.7996081724538 \tabularnewline
Trimmed Mean ( 2 / 28 ) & 4197.175 & 79.8533144429938 & 52.5610618579434 \tabularnewline
Trimmed Mean ( 3 / 28 ) & 4193.4358974359 & 77.8532085048952 & 53.8633664298142 \tabularnewline
Trimmed Mean ( 4 / 28 ) & 4190.28947368421 & 75.8126541670713 & 55.2716366379933 \tabularnewline
Trimmed Mean ( 5 / 28 ) & 4187.89189189189 & 73.7353166064708 & 56.7962827669526 \tabularnewline
Trimmed Mean ( 6 / 28 ) & 4185.01388888889 & 71.7068330859137 & 58.3628325054423 \tabularnewline
Trimmed Mean ( 7 / 28 ) & 4182.37142857143 & 70.0525244273564 & 59.7033649074059 \tabularnewline
Trimmed Mean ( 8 / 28 ) & 4179.91176470588 & 68.3026907667359 & 61.1968828428871 \tabularnewline
Trimmed Mean ( 9 / 28 ) & 4179.01515151515 & 66.7326799942784 & 62.6232177678681 \tabularnewline
Trimmed Mean ( 10 / 28 ) & 4177.5625 & 65.1120519034333 & 64.1595891678499 \tabularnewline
Trimmed Mean ( 11 / 28 ) & 4176.56451612903 & 63.3725339956348 & 65.9049631251406 \tabularnewline
Trimmed Mean ( 12 / 28 ) & 4174.76666666667 & 61.5649827402857 & 67.8107339732082 \tabularnewline
Trimmed Mean ( 13 / 28 ) & 4172.29310344828 & 59.9827763573898 & 69.5581858130222 \tabularnewline
Trimmed Mean ( 14 / 28 ) & 4168.64285714286 & 58.388268416547 & 71.3952129459191 \tabularnewline
Trimmed Mean ( 15 / 28 ) & 4165.75925925926 & 56.7844621959206 & 73.3609001153581 \tabularnewline
Trimmed Mean ( 16 / 28 ) & 4162.75 & 55.0577502582447 & 75.6069759566073 \tabularnewline
Trimmed Mean ( 17 / 28 ) & 4160.12 & 53.276786996337 & 78.0850391801223 \tabularnewline
Trimmed Mean ( 18 / 28 ) & 4158.33333333333 & 51.4311435761526 & 80.8524377292176 \tabularnewline
Trimmed Mean ( 19 / 28 ) & 4156.65217391304 & 49.8183581531319 & 83.4361534183103 \tabularnewline
Trimmed Mean ( 20 / 28 ) & 4155.11363636364 & 48.1675438337234 & 86.2637640546356 \tabularnewline
Trimmed Mean ( 21 / 28 ) & 4151.07142857143 & 46.6772021398219 & 88.9314534349524 \tabularnewline
Trimmed Mean ( 22 / 28 ) & 4148.1 & 45.2352086605567 & 91.7006933941034 \tabularnewline
Trimmed Mean ( 23 / 28 ) & 4144.47368421053 & 43.3598974485126 & 95.583106236168 \tabularnewline
Trimmed Mean ( 24 / 28 ) & 4139.88888888889 & 41.0282863666879 & 100.903285403852 \tabularnewline
Trimmed Mean ( 25 / 28 ) & 4136.5 & 39.4756462751575 & 104.786124872214 \tabularnewline
Trimmed Mean ( 26 / 28 ) & 4131.65625 & 37.6693651033344 & 109.682131319869 \tabularnewline
Trimmed Mean ( 27 / 28 ) & 4127.23333333333 & 35.7101899019768 & 115.575787881903 \tabularnewline
Trimmed Mean ( 28 / 28 ) & 4122.03571428571 & 32.9905182042238 & 124.946073558735 \tabularnewline
Median & 4121 &  &  \tabularnewline
Midrange & 4582.5 &  &  \tabularnewline
Midmean - Weighted Average at Xnp & 4140.16279069767 &  &  \tabularnewline
Midmean - Weighted Average at X(n+1)p & 4151.07142857143 &  &  \tabularnewline
Midmean - Empirical Distribution Function & 4140.16279069767 &  &  \tabularnewline
Midmean - Empirical Distribution Function - Averaging & 4151.07142857143 &  &  \tabularnewline
Midmean - Empirical Distribution Function - Interpolation & 4151.07142857143 &  &  \tabularnewline
Midmean - Closest Observation & 4140.16279069767 &  &  \tabularnewline
Midmean - True Basic - Statistics Graphics Toolkit & 4151.07142857143 &  &  \tabularnewline
Midmean - MS Excel (old versions) & 4155.11363636364 &  &  \tabularnewline
Number of observations & 84 &  &  \tabularnewline
\hline
\end{tabular}
%Source: https://freestatistics.org/blog/index.php?pk=214958&T=1

[TABLE]
[ROW][C]Central Tendency - Ungrouped Data[/C][/ROW]
[ROW][C]Measure[/C][C]Value[/C][C]S.E.[/C][C]Value/S.E.[/C][/ROW]
[ROW][C]Arithmetic Mean[/C][C]4214.02380952381[/C][C]86.8963613619973[/C][C]48.4948246793535[/C][/ROW]
[ROW][C]Geometric Mean[/C][C]4140.97456074276[/C][C][/C][C][/C][/ROW]
[ROW][C]Harmonic Mean[/C][C]4069.26832333067[/C][C][/C][C][/C][/ROW]
[ROW][C]Quadratic Mean[/C][C]4287.74157447995[/C][C][/C][C][/C][/ROW]
[ROW][C]Winsorized Mean ( 1 / 28 )[/C][C]4212.52380952381[/C][C]85.2864776452337[/C][C]49.3926343991676[/C][/ROW]
[ROW][C]Winsorized Mean ( 2 / 28 )[/C][C]4204.11904761905[/C][C]83.0491362839529[/C][C]50.6220682806955[/C][/ROW]
[ROW][C]Winsorized Mean ( 3 / 28 )[/C][C]4201.97619047619[/C][C]82.3848158453219[/C][C]51.0042554245121[/C][/ROW]
[ROW][C]Winsorized Mean ( 4 / 28 )[/C][C]4198.7380952381[/C][C]81.5065863239569[/C][C]51.5140957879128[/C][/ROW]
[ROW][C]Winsorized Mean ( 5 / 28 )[/C][C]4200.22619047619[/C][C]80.1414651248358[/C][C]52.410149776193[/C][/ROW]
[ROW][C]Winsorized Mean ( 6 / 28 )[/C][C]4198.22619047619[/C][C]77.3965864761577[/C][C]54.2430407026991[/C][/ROW]
[ROW][C]Winsorized Mean ( 7 / 28 )[/C][C]4196.30952380952[/C][C]76.5138383761361[/C][C]54.8437983620792[/C][/ROW]
[ROW][C]Winsorized Mean ( 8 / 28 )[/C][C]4185.54761904762[/C][C]74.2678635028093[/C][C]56.35745289602[/C][/ROW]
[ROW][C]Winsorized Mean ( 9 / 28 )[/C][C]4188.97619047619[/C][C]73.0346293114079[/C][C]57.3560272705031[/C][/ROW]
[ROW][C]Winsorized Mean ( 10 / 28 )[/C][C]4184.92857142857[/C][C]71.9977345250502[/C][C]58.1258368618877[/C][/ROW]
[ROW][C]Winsorized Mean ( 11 / 28 )[/C][C]4190.69047619048[/C][C]70.5020211788381[/C][C]59.4407139840744[/C][/ROW]
[ROW][C]Winsorized Mean ( 12 / 28 )[/C][C]4195.2619047619[/C][C]67.3768954966918[/C][C]62.2655863532313[/C][/ROW]
[ROW][C]Winsorized Mean ( 13 / 28 )[/C][C]4203.92857142857[/C][C]65.5190467892564[/C][C]64.1634574591814[/C][/ROW]
[ROW][C]Winsorized Mean ( 14 / 28 )[/C][C]4194.59523809524[/C][C]63.6473180996329[/C][C]65.9037232571066[/C][/ROW]
[ROW][C]Winsorized Mean ( 15 / 28 )[/C][C]4193.70238095238[/C][C]62.224928315671[/C][C]67.3958571663991[/C][/ROW]
[ROW][C]Winsorized Mean ( 16 / 28 )[/C][C]4187.79761904762[/C][C]60.2889218374093[/C][C]69.4621414916246[/C][/ROW]
[ROW][C]Winsorized Mean ( 17 / 28 )[/C][C]4177.47619047619[/C][C]58.302341926075[/C][C]71.6519448871035[/C][/ROW]
[ROW][C]Winsorized Mean ( 18 / 28 )[/C][C]4174.90476190476[/C][C]54.7282537731457[/C][C]76.2842677058577[/C][/ROW]
[ROW][C]Winsorized Mean ( 19 / 28 )[/C][C]4171.96428571429[/C][C]52.6469460773949[/C][C]79.2441840706428[/C][/ROW]
[ROW][C]Winsorized Mean ( 20 / 28 )[/C][C]4195.53571428571[/C][C]49.3724079442747[/C][C]84.9773363094038[/C][/ROW]
[ROW][C]Winsorized Mean ( 21 / 28 )[/C][C]4180.78571428571[/C][C]47.0353197674969[/C][C]88.886091025893[/C][/ROW]
[ROW][C]Winsorized Mean ( 22 / 28 )[/C][C]4184.19047619048[/C][C]46.6051438862514[/C][C]89.7795849832108[/C][/ROW]
[ROW][C]Winsorized Mean ( 23 / 28 )[/C][C]4189.66666666667[/C][C]45.5568193621953[/C][C]91.9657413604121[/C][/ROW]
[ROW][C]Winsorized Mean ( 24 / 28 )[/C][C]4172.80952380952[/C][C]39.6513074645231[/C][C]105.237627474025[/C][/ROW]
[ROW][C]Winsorized Mean ( 25 / 28 )[/C][C]4182.63095238095[/C][C]38.0069436078486[/C][C]110.049126694766[/C][/ROW]
[ROW][C]Winsorized Mean ( 26 / 28 )[/C][C]4172.72619047619[/C][C]35.9360142111098[/C][C]116.115442462903[/C][/ROW]
[ROW][C]Winsorized Mean ( 27 / 28 )[/C][C]4174.0119047619[/C][C]35.2113750578096[/C][C]118.541576348809[/C][/ROW]
[ROW][C]Winsorized Mean ( 28 / 28 )[/C][C]4135.0119047619[/C][C]29.9734271970487[/C][C]137.955926013327[/C][/ROW]
[ROW][C]Trimmed Mean ( 1 / 28 )[/C][C]4205.03658536585[/C][C]82.776949205802[/C][C]50.7996081724538[/C][/ROW]
[ROW][C]Trimmed Mean ( 2 / 28 )[/C][C]4197.175[/C][C]79.8533144429938[/C][C]52.5610618579434[/C][/ROW]
[ROW][C]Trimmed Mean ( 3 / 28 )[/C][C]4193.4358974359[/C][C]77.8532085048952[/C][C]53.8633664298142[/C][/ROW]
[ROW][C]Trimmed Mean ( 4 / 28 )[/C][C]4190.28947368421[/C][C]75.8126541670713[/C][C]55.2716366379933[/C][/ROW]
[ROW][C]Trimmed Mean ( 5 / 28 )[/C][C]4187.89189189189[/C][C]73.7353166064708[/C][C]56.7962827669526[/C][/ROW]
[ROW][C]Trimmed Mean ( 6 / 28 )[/C][C]4185.01388888889[/C][C]71.7068330859137[/C][C]58.3628325054423[/C][/ROW]
[ROW][C]Trimmed Mean ( 7 / 28 )[/C][C]4182.37142857143[/C][C]70.0525244273564[/C][C]59.7033649074059[/C][/ROW]
[ROW][C]Trimmed Mean ( 8 / 28 )[/C][C]4179.91176470588[/C][C]68.3026907667359[/C][C]61.1968828428871[/C][/ROW]
[ROW][C]Trimmed Mean ( 9 / 28 )[/C][C]4179.01515151515[/C][C]66.7326799942784[/C][C]62.6232177678681[/C][/ROW]
[ROW][C]Trimmed Mean ( 10 / 28 )[/C][C]4177.5625[/C][C]65.1120519034333[/C][C]64.1595891678499[/C][/ROW]
[ROW][C]Trimmed Mean ( 11 / 28 )[/C][C]4176.56451612903[/C][C]63.3725339956348[/C][C]65.9049631251406[/C][/ROW]
[ROW][C]Trimmed Mean ( 12 / 28 )[/C][C]4174.76666666667[/C][C]61.5649827402857[/C][C]67.8107339732082[/C][/ROW]
[ROW][C]Trimmed Mean ( 13 / 28 )[/C][C]4172.29310344828[/C][C]59.9827763573898[/C][C]69.5581858130222[/C][/ROW]
[ROW][C]Trimmed Mean ( 14 / 28 )[/C][C]4168.64285714286[/C][C]58.388268416547[/C][C]71.3952129459191[/C][/ROW]
[ROW][C]Trimmed Mean ( 15 / 28 )[/C][C]4165.75925925926[/C][C]56.7844621959206[/C][C]73.3609001153581[/C][/ROW]
[ROW][C]Trimmed Mean ( 16 / 28 )[/C][C]4162.75[/C][C]55.0577502582447[/C][C]75.6069759566073[/C][/ROW]
[ROW][C]Trimmed Mean ( 17 / 28 )[/C][C]4160.12[/C][C]53.276786996337[/C][C]78.0850391801223[/C][/ROW]
[ROW][C]Trimmed Mean ( 18 / 28 )[/C][C]4158.33333333333[/C][C]51.4311435761526[/C][C]80.8524377292176[/C][/ROW]
[ROW][C]Trimmed Mean ( 19 / 28 )[/C][C]4156.65217391304[/C][C]49.8183581531319[/C][C]83.4361534183103[/C][/ROW]
[ROW][C]Trimmed Mean ( 20 / 28 )[/C][C]4155.11363636364[/C][C]48.1675438337234[/C][C]86.2637640546356[/C][/ROW]
[ROW][C]Trimmed Mean ( 21 / 28 )[/C][C]4151.07142857143[/C][C]46.6772021398219[/C][C]88.9314534349524[/C][/ROW]
[ROW][C]Trimmed Mean ( 22 / 28 )[/C][C]4148.1[/C][C]45.2352086605567[/C][C]91.7006933941034[/C][/ROW]
[ROW][C]Trimmed Mean ( 23 / 28 )[/C][C]4144.47368421053[/C][C]43.3598974485126[/C][C]95.583106236168[/C][/ROW]
[ROW][C]Trimmed Mean ( 24 / 28 )[/C][C]4139.88888888889[/C][C]41.0282863666879[/C][C]100.903285403852[/C][/ROW]
[ROW][C]Trimmed Mean ( 25 / 28 )[/C][C]4136.5[/C][C]39.4756462751575[/C][C]104.786124872214[/C][/ROW]
[ROW][C]Trimmed Mean ( 26 / 28 )[/C][C]4131.65625[/C][C]37.6693651033344[/C][C]109.682131319869[/C][/ROW]
[ROW][C]Trimmed Mean ( 27 / 28 )[/C][C]4127.23333333333[/C][C]35.7101899019768[/C][C]115.575787881903[/C][/ROW]
[ROW][C]Trimmed Mean ( 28 / 28 )[/C][C]4122.03571428571[/C][C]32.9905182042238[/C][C]124.946073558735[/C][/ROW]
[ROW][C]Median[/C][C]4121[/C][C][/C][C][/C][/ROW]
[ROW][C]Midrange[/C][C]4582.5[/C][C][/C][C][/C][/ROW]
[ROW][C]Midmean - Weighted Average at Xnp[/C][C]4140.16279069767[/C][C][/C][C][/C][/ROW]
[ROW][C]Midmean - Weighted Average at X(n+1)p[/C][C]4151.07142857143[/C][C][/C][C][/C][/ROW]
[ROW][C]Midmean - Empirical Distribution Function[/C][C]4140.16279069767[/C][C][/C][C][/C][/ROW]
[ROW][C]Midmean - Empirical Distribution Function - Averaging[/C][C]4151.07142857143[/C][C][/C][C][/C][/ROW]
[ROW][C]Midmean - Empirical Distribution Function - Interpolation[/C][C]4151.07142857143[/C][C][/C][C][/C][/ROW]
[ROW][C]Midmean - Closest Observation[/C][C]4140.16279069767[/C][C][/C][C][/C][/ROW]
[ROW][C]Midmean - True Basic - Statistics Graphics Toolkit[/C][C]4151.07142857143[/C][C][/C][C][/C][/ROW]
[ROW][C]Midmean - MS Excel (old versions)[/C][C]4155.11363636364[/C][C][/C][C][/C][/ROW]
[ROW][C]Number of observations[/C][C]84[/C][C][/C][C][/C][/ROW]
[/TABLE]
Source: https://freestatistics.org/blog/index.php?pk=214958&T=1

Globally Unique Identifier (entire table): ba.freestatistics.org/blog/index.php?pk=214958&T=1

As an alternative you can also use a QR Code:  

The GUIDs for individual cells are displayed in the table below:

Central Tendency - Ungrouped Data
MeasureValueS.E.Value/S.E.
Arithmetic Mean4214.0238095238186.896361361997348.4948246793535
Geometric Mean4140.97456074276
Harmonic Mean4069.26832333067
Quadratic Mean4287.74157447995
Winsorized Mean ( 1 / 28 )4212.5238095238185.286477645233749.3926343991676
Winsorized Mean ( 2 / 28 )4204.1190476190583.049136283952950.6220682806955
Winsorized Mean ( 3 / 28 )4201.9761904761982.384815845321951.0042554245121
Winsorized Mean ( 4 / 28 )4198.738095238181.506586323956951.5140957879128
Winsorized Mean ( 5 / 28 )4200.2261904761980.141465124835852.410149776193
Winsorized Mean ( 6 / 28 )4198.2261904761977.396586476157754.2430407026991
Winsorized Mean ( 7 / 28 )4196.3095238095276.513838376136154.8437983620792
Winsorized Mean ( 8 / 28 )4185.5476190476274.267863502809356.35745289602
Winsorized Mean ( 9 / 28 )4188.9761904761973.034629311407957.3560272705031
Winsorized Mean ( 10 / 28 )4184.9285714285771.997734525050258.1258368618877
Winsorized Mean ( 11 / 28 )4190.6904761904870.502021178838159.4407139840744
Winsorized Mean ( 12 / 28 )4195.261904761967.376895496691862.2655863532313
Winsorized Mean ( 13 / 28 )4203.9285714285765.519046789256464.1634574591814
Winsorized Mean ( 14 / 28 )4194.5952380952463.647318099632965.9037232571066
Winsorized Mean ( 15 / 28 )4193.7023809523862.22492831567167.3958571663991
Winsorized Mean ( 16 / 28 )4187.7976190476260.288921837409369.4621414916246
Winsorized Mean ( 17 / 28 )4177.4761904761958.30234192607571.6519448871035
Winsorized Mean ( 18 / 28 )4174.9047619047654.728253773145776.2842677058577
Winsorized Mean ( 19 / 28 )4171.9642857142952.646946077394979.2441840706428
Winsorized Mean ( 20 / 28 )4195.5357142857149.372407944274784.9773363094038
Winsorized Mean ( 21 / 28 )4180.7857142857147.035319767496988.886091025893
Winsorized Mean ( 22 / 28 )4184.1904761904846.605143886251489.7795849832108
Winsorized Mean ( 23 / 28 )4189.6666666666745.556819362195391.9657413604121
Winsorized Mean ( 24 / 28 )4172.8095238095239.6513074645231105.237627474025
Winsorized Mean ( 25 / 28 )4182.6309523809538.0069436078486110.049126694766
Winsorized Mean ( 26 / 28 )4172.7261904761935.9360142111098116.115442462903
Winsorized Mean ( 27 / 28 )4174.011904761935.2113750578096118.541576348809
Winsorized Mean ( 28 / 28 )4135.011904761929.9734271970487137.955926013327
Trimmed Mean ( 1 / 28 )4205.0365853658582.77694920580250.7996081724538
Trimmed Mean ( 2 / 28 )4197.17579.853314442993852.5610618579434
Trimmed Mean ( 3 / 28 )4193.435897435977.853208504895253.8633664298142
Trimmed Mean ( 4 / 28 )4190.2894736842175.812654167071355.2716366379933
Trimmed Mean ( 5 / 28 )4187.8918918918973.735316606470856.7962827669526
Trimmed Mean ( 6 / 28 )4185.0138888888971.706833085913758.3628325054423
Trimmed Mean ( 7 / 28 )4182.3714285714370.052524427356459.7033649074059
Trimmed Mean ( 8 / 28 )4179.9117647058868.302690766735961.1968828428871
Trimmed Mean ( 9 / 28 )4179.0151515151566.732679994278462.6232177678681
Trimmed Mean ( 10 / 28 )4177.562565.112051903433364.1595891678499
Trimmed Mean ( 11 / 28 )4176.5645161290363.372533995634865.9049631251406
Trimmed Mean ( 12 / 28 )4174.7666666666761.564982740285767.8107339732082
Trimmed Mean ( 13 / 28 )4172.2931034482859.982776357389869.5581858130222
Trimmed Mean ( 14 / 28 )4168.6428571428658.38826841654771.3952129459191
Trimmed Mean ( 15 / 28 )4165.7592592592656.784462195920673.3609001153581
Trimmed Mean ( 16 / 28 )4162.7555.057750258244775.6069759566073
Trimmed Mean ( 17 / 28 )4160.1253.27678699633778.0850391801223
Trimmed Mean ( 18 / 28 )4158.3333333333351.431143576152680.8524377292176
Trimmed Mean ( 19 / 28 )4156.6521739130449.818358153131983.4361534183103
Trimmed Mean ( 20 / 28 )4155.1136363636448.167543833723486.2637640546356
Trimmed Mean ( 21 / 28 )4151.0714285714346.677202139821988.9314534349524
Trimmed Mean ( 22 / 28 )4148.145.235208660556791.7006933941034
Trimmed Mean ( 23 / 28 )4144.4736842105343.359897448512695.583106236168
Trimmed Mean ( 24 / 28 )4139.8888888888941.0282863666879100.903285403852
Trimmed Mean ( 25 / 28 )4136.539.4756462751575104.786124872214
Trimmed Mean ( 26 / 28 )4131.6562537.6693651033344109.682131319869
Trimmed Mean ( 27 / 28 )4127.2333333333335.7101899019768115.575787881903
Trimmed Mean ( 28 / 28 )4122.0357142857132.9905182042238124.946073558735
Median4121
Midrange4582.5
Midmean - Weighted Average at Xnp4140.16279069767
Midmean - Weighted Average at X(n+1)p4151.07142857143
Midmean - Empirical Distribution Function4140.16279069767
Midmean - Empirical Distribution Function - Averaging4151.07142857143
Midmean - Empirical Distribution Function - Interpolation4151.07142857143
Midmean - Closest Observation4140.16279069767
Midmean - True Basic - Statistics Graphics Toolkit4151.07142857143
Midmean - MS Excel (old versions)4155.11363636364
Number of observations84


Parameters (Session):
Parameters (R input):
R code (references can be found in the software module):
geomean <- function(x) {
return(exp(mean(log(x))))
}
harmean <- function(x) {
return(1/mean(1/x))
}
quamean <- function(x) {
return(sqrt(mean(x*x)))
}
winmean <- function(x) {
x <-sort(x[!is.na(x)])
n<-length(x)
denom <- 3
nodenom <- n/denom
if (nodenom>40) denom <- n/40
sqrtn = sqrt(n)
roundnodenom = floor(nodenom)
win <- array(NA,dim=c(roundnodenom,2))
for (j in 1:roundnodenom) {
win[j,1] <- (j*x[j+1]+sum(x[(j+1):(n-j)])+j*x[n-j])/n
win[j,2] <- sd(c(rep(x[j+1],j),x[(j+1):(n-j)],rep(x[n-j],j)))/sqrtn
}
return(win)
}
trimean <- function(x) {
x <-sort(x[!is.na(x)])
n<-length(x)
denom <- 3
nodenom <- n/denom
if (nodenom>40) denom <- n/40
sqrtn = sqrt(n)
roundnodenom = floor(nodenom)
tri <- array(NA,dim=c(roundnodenom,2))
for (j in 1:roundnodenom) {
tri[j,1] <- mean(x,trim=j/n)
tri[j,2] <- sd(x[(j+1):(n-j)]) / sqrt(n-j*2)
}
return(tri)
}
midrange <- function(x) {
return((max(x)+min(x))/2)
}
q1 <- function(data,n,p,i,f) {
np <- n*p;
i <<- floor(np)
f <<- np - i
qvalue <- (1-f)*data[i] + f*data[i+1]
}
q2 <- function(data,n,p,i,f) {
np <- (n+1)*p
i <<- floor(np)
f <<- np - i
qvalue <- (1-f)*data[i] + f*data[i+1]
}
q3 <- function(data,n,p,i,f) {
np <- n*p
i <<- floor(np)
f <<- np - i
if (f==0) {
qvalue <- data[i]
} else {
qvalue <- data[i+1]
}
}
q4 <- function(data,n,p,i,f) {
np <- n*p
i <<- floor(np)
f <<- np - i
if (f==0) {
qvalue <- (data[i]+data[i+1])/2
} else {
qvalue <- data[i+1]
}
}
q5 <- function(data,n,p,i,f) {
np <- (n-1)*p
i <<- floor(np)
f <<- np - i
if (f==0) {
qvalue <- data[i+1]
} else {
qvalue <- data[i+1] + f*(data[i+2]-data[i+1])
}
}
q6 <- function(data,n,p,i,f) {
np <- n*p+0.5
i <<- floor(np)
f <<- np - i
qvalue <- data[i]
}
q7 <- function(data,n,p,i,f) {
np <- (n+1)*p
i <<- floor(np)
f <<- np - i
if (f==0) {
qvalue <- data[i]
} else {
qvalue <- f*data[i] + (1-f)*data[i+1]
}
}
q8 <- function(data,n,p,i,f) {
np <- (n+1)*p
i <<- floor(np)
f <<- np - i
if (f==0) {
qvalue <- data[i]
} else {
if (f == 0.5) {
qvalue <- (data[i]+data[i+1])/2
} else {
if (f < 0.5) {
qvalue <- data[i]
} else {
qvalue <- data[i+1]
}
}
}
}
midmean <- function(x,def) {
x <-sort(x[!is.na(x)])
n<-length(x)
if (def==1) {
qvalue1 <- q1(x,n,0.25,i,f)
qvalue3 <- q1(x,n,0.75,i,f)
}
if (def==2) {
qvalue1 <- q2(x,n,0.25,i,f)
qvalue3 <- q2(x,n,0.75,i,f)
}
if (def==3) {
qvalue1 <- q3(x,n,0.25,i,f)
qvalue3 <- q3(x,n,0.75,i,f)
}
if (def==4) {
qvalue1 <- q4(x,n,0.25,i,f)
qvalue3 <- q4(x,n,0.75,i,f)
}
if (def==5) {
qvalue1 <- q5(x,n,0.25,i,f)
qvalue3 <- q5(x,n,0.75,i,f)
}
if (def==6) {
qvalue1 <- q6(x,n,0.25,i,f)
qvalue3 <- q6(x,n,0.75,i,f)
}
if (def==7) {
qvalue1 <- q7(x,n,0.25,i,f)
qvalue3 <- q7(x,n,0.75,i,f)
}
if (def==8) {
qvalue1 <- q8(x,n,0.25,i,f)
qvalue3 <- q8(x,n,0.75,i,f)
}
midm <- 0
myn <- 0
roundno4 <- round(n/4)
round3no4 <- round(3*n/4)
for (i in 1:n) {
if ((x[i]>=qvalue1) & (x[i]<=qvalue3)){
midm = midm + x[i]
myn = myn + 1
}
}
midm = midm / myn
return(midm)
}
(arm <- mean(x))
sqrtn <- sqrt(length(x))
(armse <- sd(x) / sqrtn)
(armose <- arm / armse)
(geo <- geomean(x))
(har <- harmean(x))
(qua <- quamean(x))
(win <- winmean(x))
(tri <- trimean(x))
(midr <- midrange(x))
midm <- array(NA,dim=8)
for (j in 1:8) midm[j] <- midmean(x,j)
midm
bitmap(file='test1.png')
lb <- win[,1] - 2*win[,2]
ub <- win[,1] + 2*win[,2]
if ((ylimmin == '') | (ylimmax == '')) plot(win[,1],type='b',main=main, xlab='j', pch=19, ylab='Winsorized Mean(j/n)', ylim=c(min(lb),max(ub))) else plot(win[,1],type='l',main=main, xlab='j', pch=19, ylab='Winsorized Mean(j/n)', ylim=c(ylimmin,ylimmax))
lines(ub,lty=3)
lines(lb,lty=3)
grid()
dev.off()
bitmap(file='test2.png')
lb <- tri[,1] - 2*tri[,2]
ub <- tri[,1] + 2*tri[,2]
if ((ylimmin == '') | (ylimmax == '')) plot(tri[,1],type='b',main=main, xlab='j', pch=19, ylab='Trimmed Mean(j/n)', ylim=c(min(lb),max(ub))) else plot(tri[,1],type='l',main=main, xlab='j', pch=19, ylab='Trimmed Mean(j/n)', ylim=c(ylimmin,ylimmax))
lines(ub,lty=3)
lines(lb,lty=3)
grid()
dev.off()
load(file='createtable')
a<-table.start()
a<-table.row.start(a)
a<-table.element(a,'Central Tendency - Ungrouped Data',4,TRUE)
a<-table.row.end(a)
a<-table.row.start(a)
a<-table.element(a,'Measure',header=TRUE)
a<-table.element(a,'Value',header=TRUE)
a<-table.element(a,'S.E.',header=TRUE)
a<-table.element(a,'Value/S.E.',header=TRUE)
a<-table.row.end(a)
a<-table.row.start(a)
a<-table.element(a,hyperlink('arithmetic_mean.htm', 'Arithmetic Mean', 'click to view the definition of the Arithmetic Mean'),header=TRUE)
a<-table.element(a,arm)
a<-table.element(a,hyperlink('arithmetic_mean_standard_error.htm', armse, 'click to view the definition of the Standard Error of the Arithmetic Mean'))
a<-table.element(a,armose)
a<-table.row.end(a)
a<-table.row.start(a)
a<-table.element(a,hyperlink('geometric_mean.htm', 'Geometric Mean', 'click to view the definition of the Geometric Mean'),header=TRUE)
a<-table.element(a,geo)
a<-table.element(a,'')
a<-table.row.end(a)
a<-table.row.start(a)
a<-table.element(a,hyperlink('harmonic_mean.htm', 'Harmonic Mean', 'click to view the definition of the Harmonic Mean'),header=TRUE)
a<-table.element(a,har)
a<-table.element(a,'')
a<-table.row.end(a)
a<-table.row.start(a)
a<-table.element(a,hyperlink('quadratic_mean.htm', 'Quadratic Mean', 'click to view the definition of the Quadratic Mean'),header=TRUE)
a<-table.element(a,qua)
a<-table.element(a,'')
a<-table.row.end(a)
for (j in 1:length(win[,1])) {
a<-table.row.start(a)
mylabel <- paste('Winsorized Mean (',j)
mylabel <- paste(mylabel,'/')
mylabel <- paste(mylabel,length(win[,1]))
mylabel <- paste(mylabel,')')
a<-table.element(a,hyperlink('winsorized_mean.htm', mylabel, 'click to view the definition of the Winsorized Mean'),header=TRUE)
a<-table.element(a,win[j,1])
a<-table.element(a,win[j,2])
a<-table.element(a,win[j,1]/win[j,2])
a<-table.row.end(a)
}
for (j in 1:length(tri[,1])) {
a<-table.row.start(a)
mylabel <- paste('Trimmed Mean (',j)
mylabel <- paste(mylabel,'/')
mylabel <- paste(mylabel,length(tri[,1]))
mylabel <- paste(mylabel,')')
a<-table.element(a,hyperlink('arithmetic_mean.htm', mylabel, 'click to view the definition of the Trimmed Mean'),header=TRUE)
a<-table.element(a,tri[j,1])
a<-table.element(a,tri[j,2])
a<-table.element(a,tri[j,1]/tri[j,2])
a<-table.row.end(a)
}
a<-table.row.start(a)
a<-table.element(a,hyperlink('median_1.htm', 'Median', 'click to view the definition of the Median'),header=TRUE)
a<-table.element(a,median(x))
a<-table.element(a,'')
a<-table.row.end(a)
a<-table.row.start(a)
a<-table.element(a,hyperlink('midrange.htm', 'Midrange', 'click to view the definition of the Midrange'),header=TRUE)
a<-table.element(a,midr)
a<-table.element(a,'')
a<-table.row.end(a)
a<-table.row.start(a)
mymid <- hyperlink('midmean.htm', 'Midmean', 'click to view the definition of the Midmean')
mylabel <- paste(mymid,hyperlink('method_1.htm','Weighted Average at Xnp',''),sep=' - ')
a<-table.element(a,mylabel,header=TRUE)
a<-table.element(a,midm[1])
a<-table.element(a,'')
a<-table.row.end(a)
a<-table.row.start(a)
mymid <- hyperlink('midmean.htm', 'Midmean', 'click to view the definition of the Midmean')
mylabel <- paste(mymid,hyperlink('method_2.htm','Weighted Average at X(n+1)p',''),sep=' - ')
a<-table.element(a,mylabel,header=TRUE)
a<-table.element(a,midm[2])
a<-table.element(a,'')
a<-table.row.end(a)
a<-table.row.start(a)
mymid <- hyperlink('midmean.htm', 'Midmean', 'click to view the definition of the Midmean')
mylabel <- paste(mymid,hyperlink('method_3.htm','Empirical Distribution Function',''),sep=' - ')
a<-table.element(a,mylabel,header=TRUE)
a<-table.element(a,midm[3])
a<-table.element(a,'')
a<-table.row.end(a)
a<-table.row.start(a)
mymid <- hyperlink('midmean.htm', 'Midmean', 'click to view the definition of the Midmean')
mylabel <- paste(mymid,hyperlink('method_4.htm','Empirical Distribution Function - Averaging',''),sep=' - ')
a<-table.element(a,mylabel,header=TRUE)
a<-table.element(a,midm[4])
a<-table.element(a,'')
a<-table.row.end(a)
a<-table.row.start(a)
mymid <- hyperlink('midmean.htm', 'Midmean', 'click to view the definition of the Midmean')
mylabel <- paste(mymid,hyperlink('method_5.htm','Empirical Distribution Function - Interpolation',''),sep=' - ')
a<-table.element(a,mylabel,header=TRUE)
a<-table.element(a,midm[5])
a<-table.element(a,'')
a<-table.row.end(a)
a<-table.row.start(a)
mymid <- hyperlink('midmean.htm', 'Midmean', 'click to view the definition of the Midmean')
mylabel <- paste(mymid,hyperlink('method_6.htm','Closest Observation',''),sep=' - ')
a<-table.element(a,mylabel,header=TRUE)
a<-table.element(a,midm[6])
a<-table.element(a,'')
a<-table.row.end(a)
a<-table.row.start(a)
mymid <- hyperlink('midmean.htm', 'Midmean', 'click to view the definition of the Midmean')
mylabel <- paste(mymid,hyperlink('method_7.htm','True Basic - Statistics Graphics Toolkit',''),sep=' - ')
a<-table.element(a,mylabel,header=TRUE)
a<-table.element(a,midm[7])
a<-table.element(a,'')
a<-table.row.end(a)
a<-table.row.start(a)
mymid <- hyperlink('midmean.htm', 'Midmean', 'click to view the definition of the Midmean')
mylabel <- paste(mymid,hyperlink('method_8.htm','MS Excel (old versions)',''),sep=' - ')
a<-table.element(a,mylabel,header=TRUE)
a<-table.element(a,midm[8])
a<-table.element(a,'')
a<-table.row.end(a)
a<-table.row.start(a)
a<-table.element(a,'Number of observations',header=TRUE)
a<-table.element(a,length(x))
a<-table.element(a,'')
a<-table.row.end(a)
a<-table.end(a)
table.save(a,file='mytable.tab')