Free Statistics
of Irreproducible Research!
Description of Statistical Computation | ||||||||||||||||||||||||||||||
|---|---|---|---|---|---|---|---|---|---|---|---|---|---|---|---|---|---|---|---|---|---|---|---|---|---|---|---|---|---|---|
| Author's title | ||||||||||||||||||||||||||||||
| Author | *The author of this computation has been verified* | |||||||||||||||||||||||||||||
| R Software Module | rwasp_Distributional Plots.wasp | |||||||||||||||||||||||||||||
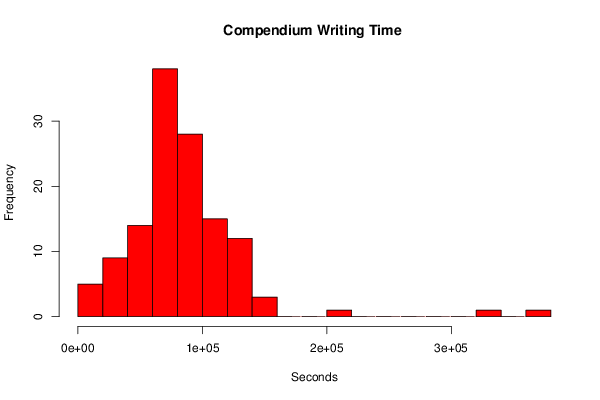
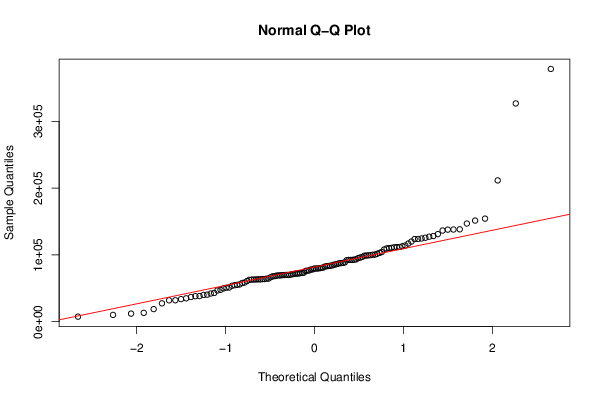
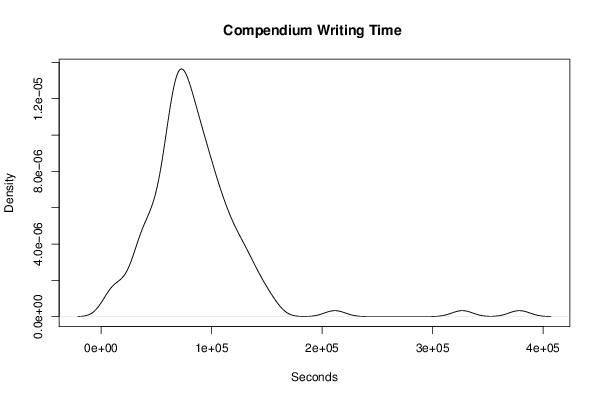
| Title produced by software | Histogram, QQplot and Density | |||||||||||||||||||||||||||||
| Date of computation | Fri, 25 Oct 2013 15:02:52 -0400 | |||||||||||||||||||||||||||||
| Cite this page as follows | Statistical Computations at FreeStatistics.org, Office for Research Development and Education, URL https://freestatistics.org/blog/index.php?v=date/2013/Oct/25/t1382727863bgwf5ny9e88fydm.htm/, Retrieved Sun, 28 Apr 2024 08:24:11 +0000 | |||||||||||||||||||||||||||||
| Statistical Computations at FreeStatistics.org, Office for Research Development and Education, URL https://freestatistics.org/blog/index.php?pk=219566, Retrieved Sun, 28 Apr 2024 08:24:11 +0000 | ||||||||||||||||||||||||||||||
| QR Codes: | ||||||||||||||||||||||||||||||
|
| ||||||||||||||||||||||||||||||
| Original text written by user: | ||||||||||||||||||||||||||||||
| IsPrivate? | No (this computation is public) | |||||||||||||||||||||||||||||
| User-defined keywords | ||||||||||||||||||||||||||||||
| Estimated Impact | 98 | |||||||||||||||||||||||||||||
Tree of Dependent Computations | ||||||||||||||||||||||||||||||
| Family? (F = Feedback message, R = changed R code, M = changed R Module, P = changed Parameters, D = changed Data) | ||||||||||||||||||||||||||||||
| - [Histogram, QQplot and Density] [Statistics Compen...] [2013-10-25 19:02:52] [a9208f4f8d3b118336aae915785f2bd9] [Current] | ||||||||||||||||||||||||||||||
| Feedback Forum | ||||||||||||||||||||||||||||||
Post a new message | ||||||||||||||||||||||||||||||
Dataset | ||||||||||||||||||||||||||||||
| Dataseries X: | ||||||||||||||||||||||||||||||
154330 99550 109641 92542 62927 101639 87677 83405 326810 112992 110288 64503 95392 68938 85322 27470 92453 120010 93408 131114 70754 138356 378515 104316 151439 84216 66554 96982 68089 128261 50858 79638 81116 64427 111870 76075 38178 39991 70001 76660 108110 36922 83042 78248 42168 72975 51195 33783 80058 40490 86463 114168 146978 54612 117017 100265 103004 124629 78139 211604 110610 82639 99452 13246 127262 92016 63230 92960 63426 69353 123861 55839 69221 125682 137861 58568 79598 99035 53755 12048 55177 69599 60879 63680 111742 87918 79605 83783 73379 71889 67910 38350 72220 69803 70013 72693 138018 76421 71277 32067 80500 63812 42973 96033 63445 136528 85800 123703 35012 98791 32002 111407 92520 71931 62766 57996 46759 63162 49850 87573 47756 70165 100471 18820 10136 88906 7525 | ||||||||||||||||||||||||||||||
Tables (Output of Computation) | ||||||||||||||||||||||||||||||
| ||||||||||||||||||||||||||||||
Figures (Output of Computation) | ||||||||||||||||||||||||||||||
Input Parameters & R Code | ||||||||||||||||||||||||||||||
| Parameters (Session): | ||||||||||||||||||||||||||||||
| par1 = 20 ; | ||||||||||||||||||||||||||||||
| Parameters (R input): | ||||||||||||||||||||||||||||||
| par1 = 20 ; | ||||||||||||||||||||||||||||||
| R code (references can be found in the software module): | ||||||||||||||||||||||||||||||
par1 <- '20' | ||||||||||||||||||||||||||||||