Free Statistics
of Irreproducible Research!
Description of Statistical Computation | ||||||||||||||||||||||||||||||
|---|---|---|---|---|---|---|---|---|---|---|---|---|---|---|---|---|---|---|---|---|---|---|---|---|---|---|---|---|---|---|
| Author's title | ||||||||||||||||||||||||||||||
| Author | *The author of this computation has been verified* | |||||||||||||||||||||||||||||
| R Software Module | rwasp_Distributional Plots.wasp | |||||||||||||||||||||||||||||
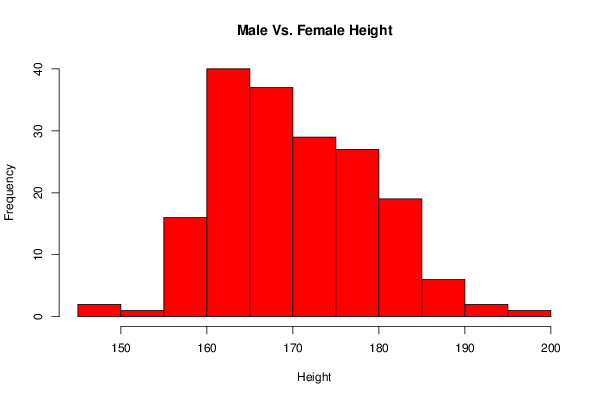
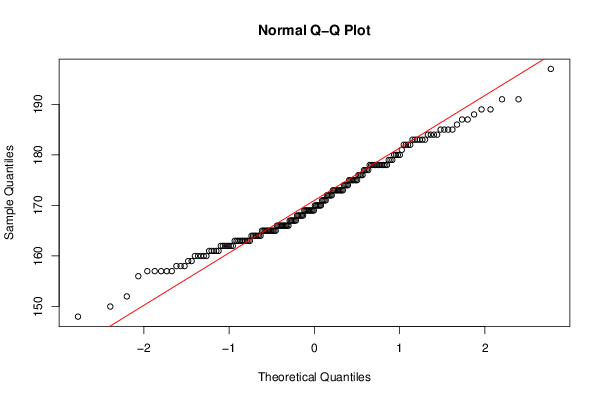
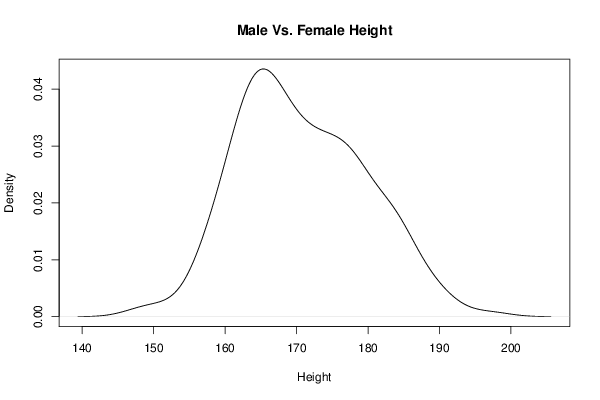
| Title produced by software | Histogram, QQplot and Density | |||||||||||||||||||||||||||||
| Date of computation | Mon, 02 Sep 2013 02:57:23 -0400 | |||||||||||||||||||||||||||||
| Cite this page as follows | Statistical Computations at FreeStatistics.org, Office for Research Development and Education, URL https://freestatistics.org/blog/index.php?v=date/2013/Sep/02/t1378105059tudoh4a59x8uq4p.htm/, Retrieved Mon, 29 Apr 2024 23:14:35 +0000 | |||||||||||||||||||||||||||||
| Statistical Computations at FreeStatistics.org, Office for Research Development and Education, URL https://freestatistics.org/blog/index.php?pk=211372, Retrieved Mon, 29 Apr 2024 23:14:35 +0000 | ||||||||||||||||||||||||||||||
| QR Codes: | ||||||||||||||||||||||||||||||
|
| ||||||||||||||||||||||||||||||
| Original text written by user: | ||||||||||||||||||||||||||||||
| IsPrivate? | No (this computation is public) | |||||||||||||||||||||||||||||
| User-defined keywords | ||||||||||||||||||||||||||||||
| Estimated Impact | 186 | |||||||||||||||||||||||||||||
Tree of Dependent Computations | ||||||||||||||||||||||||||||||
| Family? (F = Feedback message, R = changed R code, M = changed R Module, P = changed Parameters, D = changed Data) | ||||||||||||||||||||||||||||||
| - [Wilcoxon-Mann-Whitney Test] [BPVT vs RAD Wilcoxon] [2013-05-22 09:47:10] [5ef9db01be34499e40e11b3d584c4008] - R PD [Wilcoxon-Mann-Whitney Test] [male female weights] [2013-09-02 06:14:05] [b9554fd146071c6664c3b90882021607] - R D [Wilcoxon-Mann-Whitney Test] [MaleVsFemale Height] [2013-09-02 06:20:22] [b9554fd146071c6664c3b90882021607] - D [Wilcoxon-Mann-Whitney Test] [male female repwt] [2013-09-02 06:25:50] [b9554fd146071c6664c3b90882021607] - D [Wilcoxon-Mann-Whitney Test] [FemaleMaleRepHT] [2013-09-02 06:27:58] [b9554fd146071c6664c3b90882021607] - R D [Wilcoxon-Mann-Whitney Test] [Male Vs. Female w...] [2013-09-02 06:38:37] [b9554fd146071c6664c3b90882021607] - R D [Wilcoxon-Mann-Whitney Test] [Female Vs. Male R...] [2013-09-02 06:44:33] [b9554fd146071c6664c3b90882021607] - D [Wilcoxon-Mann-Whitney Test] [Female Vs. Male R...] [2013-09-02 06:49:56] [b9554fd146071c6664c3b90882021607] - RM D [Histogram, QQplot and Density] [Male Vs. Female W...] [2013-09-02 06:56:17] [b9554fd146071c6664c3b90882021607] - R D [Histogram, QQplot and Density] [Male Vs. Female H...] [2013-09-02 06:57:23] [596e6a605e7d57b5b185940866c8678f] [Current] - D [Histogram, QQplot and Density] [Male Vs. Female R...] [2013-09-02 06:58:33] [b9554fd146071c6664c3b90882021607] - D [Histogram, QQplot and Density] [Male Vs. Female R...] [2013-09-02 06:59:51] [b9554fd146071c6664c3b90882021607] | ||||||||||||||||||||||||||||||
| Feedback Forum | ||||||||||||||||||||||||||||||
Post a new message | ||||||||||||||||||||||||||||||
Dataset | ||||||||||||||||||||||||||||||
| Dataseries X: | ||||||||||||||||||||||||||||||
161 161 157 161 168 163 166 168 175 170 171 166 169 166 157 166 164 169 166 164 163 160 174 162 165 173 162 165 164 158 175 165 163 166 160 160 165 169 167 170 165 163 162 161 165 169 159 164 163 163 175 164 152 167 166 166 174 167 168 178 165 157 171 157 166 160 148 162 172 163 165 176 171 160 165 157 173 168 162 150 163 167 163 161 162 172 159 170 166 158 165 162 172 169 158 164 156 164 182 177 170 167 186 178 171 175 187 197 180 175 173 183 178 173 176 174 178 187 178 183 179 182 169 185 176 183 172 173 165 177 180 189 178 173 182 183 168 182 178 173 184 180 189 185 178 183 179 179 184 184 169 178 178 167 185 177 188 191 175 184 169 172 163 191 169 170 168 178 170 178 174 176 173 183 185 173 175 180 181 177 | ||||||||||||||||||||||||||||||
Tables (Output of Computation) | ||||||||||||||||||||||||||||||
| ||||||||||||||||||||||||||||||
Figures (Output of Computation) | ||||||||||||||||||||||||||||||
Input Parameters & R Code | ||||||||||||||||||||||||||||||
| Parameters (Session): | ||||||||||||||||||||||||||||||
| par1 = 10 ; | ||||||||||||||||||||||||||||||
| Parameters (R input): | ||||||||||||||||||||||||||||||
| par1 = 10 ; | ||||||||||||||||||||||||||||||
| R code (references can be found in the software module): | ||||||||||||||||||||||||||||||
x <- x[!is.na(x)] | ||||||||||||||||||||||||||||||