Free Statistics

of Irreproducible Research!

Author's title

Author*Unverified author*
R Software Modulerwasp_univariatedataseries.wasp
Title produced by softwareUnivariate Data Series
Date of computationThu, 19 Sep 2013 09:02:17 -0400
Cite this page as followsStatistical Computations at FreeStatistics.org, Office for Research Development and Education, URL https://freestatistics.org/blog/index.php?v=date/2013/Sep/19/t1379595779ijh0quuq3ja1wtk.htm/, Retrieved Mon, 29 Apr 2024 17:22:43 +0000
Statistical Computations at FreeStatistics.org, Office for Research Development and Education, URL https://freestatistics.org/blog/index.php?pk=211520, Retrieved Mon, 29 Apr 2024 17:22:43 +0000
QR Codes:

Original text written by user:
IsPrivate?No (this computation is public)
User-defined keywords
Estimated Impact118
Family? (F = Feedback message, R = changed R code, M = changed R Module, P = changed Parameters, D = changed Data)
-       [Univariate Data Series] [] [2013-09-19 13:02:17] [17b6b1d507219cce54aa3edb43843a55] [Current]
Feedback Forum

Post a new message
Dataseries X:
45603
46470
50069
56009
58677
49626
36537
35431
37149
39340
42023
42343
38952
38796
42223
48443
52800
51287
34079
32846
35177
37254
39738
41484
40867
41057
45527
51705
58664
57075
39206
37315
40167
41921
45118
45570
48612
44964
47364
53802
59961
57284
40096
35602
37742
39280
39833
39591
36773
34666
37295
41584
47932
46549
29528
24591
27864
28983
30369
32279
33117
33016
37077
43367
52455
51345
30575
27604
29533
31736
34418
37866
37909
40555
46175
58389
63611
62348
41381
40113
42483
42408
46018
46626


Summary of computational transaction
Raw Inputview raw input (R code)
Raw Outputview raw output of R engine
Computing time2 seconds
R Server'Herman Ole Andreas Wold' @ wold.wessa.net

\begin{tabular}{lllllllll}
\hline
Summary of computational transaction \tabularnewline
Raw Input & view raw input (R code)  \tabularnewline
Raw Output & view raw output of R engine  \tabularnewline
Computing time & 2 seconds \tabularnewline
R Server & 'Herman Ole Andreas Wold' @ wold.wessa.net \tabularnewline
\hline
\end{tabular}
%Source: https://freestatistics.org/blog/index.php?pk=211520&T=0

[TABLE]
[ROW][C]Summary of computational transaction[/C][/ROW]
[ROW][C]Raw Input[/C][C]view raw input (R code) [/C][/ROW]
[ROW][C]Raw Output[/C][C]view raw output of R engine [/C][/ROW]
[ROW][C]Computing time[/C][C]2 seconds[/C][/ROW]
[ROW][C]R Server[/C][C]'Herman Ole Andreas Wold' @ wold.wessa.net[/C][/ROW]
[/TABLE]
Source: https://freestatistics.org/blog/index.php?pk=211520&T=0

Globally Unique Identifier (entire table): ba.freestatistics.org/blog/index.php?pk=211520&T=0

As an alternative you can also use a QR Code:  

The GUIDs for individual cells are displayed in the table below:

Summary of computational transaction
Raw Inputview raw input (R code)
Raw Outputview raw output of R engine
Computing time2 seconds
R Server'Herman Ole Andreas Wold' @ wold.wessa.net


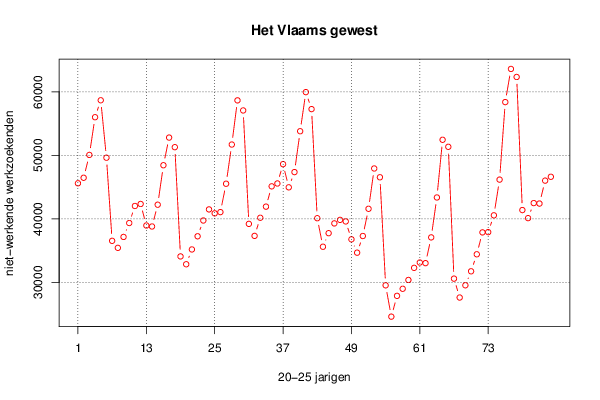
Univariate Dataseries
Name of dataseriesNiet-werkende werkzoekenden
SourceBelgostat
DescriptionCijferreeks van de niet-werkende werkzoekende voor de leeftijdscategorie 20-25 jarigen in het Vlaams gewest.
Number of observations84

\begin{tabular}{lllllllll}
\hline
Univariate Dataseries \tabularnewline
Name of dataseries & Niet-werkende werkzoekenden \tabularnewline
Source & Belgostat \tabularnewline
Description & Cijferreeks van de niet-werkende werkzoekende voor de leeftijdscategorie 20-25 jarigen in het Vlaams gewest. \tabularnewline
Number of observations & 84 \tabularnewline
\hline
\end{tabular}
%Source: https://freestatistics.org/blog/index.php?pk=211520&T=1

[TABLE]
[ROW][C]Univariate Dataseries[/C][/ROW]
[ROW][C]Name of dataseries[/C][C]Niet-werkende werkzoekenden[/C][/ROW]
[ROW][C]Source[/C][C]Belgostat[/C][/ROW]
[ROW][C]Description[/C][C]Cijferreeks van de niet-werkende werkzoekende voor de leeftijdscategorie 20-25 jarigen in het Vlaams gewest.[/C][/ROW]
[ROW][C]Number of observations[/C][C]84[/C][/ROW]
[/TABLE]
Source: https://freestatistics.org/blog/index.php?pk=211520&T=1

Globally Unique Identifier (entire table): ba.freestatistics.org/blog/index.php?pk=211520&T=1

As an alternative you can also use a QR Code:  

The GUIDs for individual cells are displayed in the table below:

Univariate Dataseries
Name of dataseriesNiet-werkende werkzoekenden
SourceBelgostat
DescriptionCijferreeks van de niet-werkende werkzoekende voor de leeftijdscategorie 20-25 jarigen in het Vlaams gewest.
Number of observations84


Parameters (Session):
par1 = Niet-werkende werkzoekenden ; par2 = Belgostat ; par3 = Cijferreeks van de niet-werkende werkzoekende voor de leeftijdscategorie 20-25 jarigen in het Vlaams gewest. ; par4 = 12 ;
Parameters (R input):
par1 = Niet-werkende werkzoekenden ; par2 = Belgostat ; par3 = Cijferreeks van de niet-werkende werkzoekende voor de leeftijdscategorie 20-25 jarigen in het Vlaams gewest. ; par4 = 12 ;
R code (references can be found in the software module):
par4 <- '12'
par3 <- 'Cijferreeks van de niet-werkende werkzoekende voor de leeftijdscategorie 20-25 jarigen in het Vlaams gewest.'
par2 <- 'Belgostat'
par1 <- 'Niet-werkende werkzoekenden'
if (par4 != 'No season') {
par4 <- as.numeric(par4)
if (par4 < 4) par4 <- 12
}
summary(x)
n <- length(x)
bitmap(file='test1.png')
if (par4=='No season') {
plot(x,col=2,type='b',main=main,xlab=xlab,ylab=ylab,xaxt='n')
axis(1,at=seq(1,n,10))
}
if (par4!='No season') {
plot(x,col=2,type='b',main=main,xlab=xlab,ylab=ylab,xaxt='n')
axis(1,at=seq(1,n,par4))
grid(nx=0,ny=NULL,col='black')
abline(v=seq(1,n,par4),col='black',lty='dotted')
}
dev.off()
load(file='createtable')
a<-table.start()
a<-table.row.start(a)
a<-table.element(a,'Univariate Dataseries',2,TRUE)
a<-table.row.end(a)
a<-table.row.start(a)
a<-table.element(a,'Name of dataseries',header=TRUE)
a<-table.element(a,par1)
a<-table.row.end(a)
a<-table.row.start(a)
a<-table.element(a,'Source',header=TRUE)
a<-table.element(a,par2)
a<-table.row.end(a)
a<-table.row.start(a)
a<-table.element(a,'Description',header=TRUE)
a<-table.element(a,par3)
a<-table.row.end(a)
a<-table.row.start(a)
a<-table.element(a,'Number of observations',header=TRUE)
a<-table.element(a,length(x))
a<-table.row.end(a)
a<-table.end(a)
table.save(a,file='mytable.tab')