Free Statistics
of Irreproducible Research!
Description of Statistical Computation | |||||||||||||||||||||||||||||||||||||||||
|---|---|---|---|---|---|---|---|---|---|---|---|---|---|---|---|---|---|---|---|---|---|---|---|---|---|---|---|---|---|---|---|---|---|---|---|---|---|---|---|---|---|
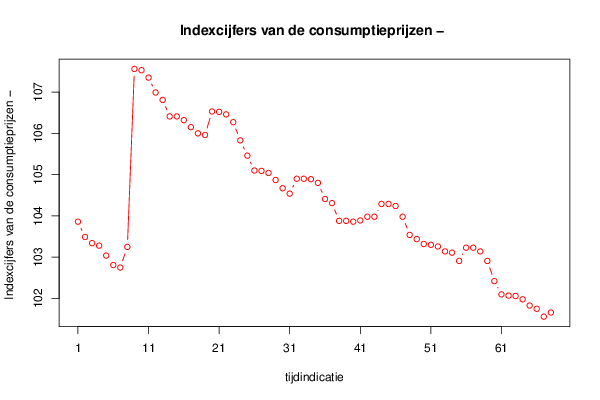
| Author's title | Indexcijfers van de consumptieprijzen - synthese tabel (2004=100) , Classif... | ||||||||||||||||||||||||||||||||||||||||
| Author | *Unverified author* | ||||||||||||||||||||||||||||||||||||||||
| R Software Module | rwasp_univariatedataseries.wasp | ||||||||||||||||||||||||||||||||||||||||
| Title produced by software | Univariate Data Series | ||||||||||||||||||||||||||||||||||||||||
| Date of computation | Thu, 19 Sep 2013 09:45:43 -0400 | ||||||||||||||||||||||||||||||||||||||||
| Cite this page as follows | Statistical Computations at FreeStatistics.org, Office for Research Development and Education, URL https://freestatistics.org/blog/index.php?v=date/2013/Sep/19/t1379599069s81v2081ary6two.htm/, Retrieved Mon, 29 Apr 2024 17:32:33 +0000 | ||||||||||||||||||||||||||||||||||||||||
| Statistical Computations at FreeStatistics.org, Office for Research Development and Education, URL https://freestatistics.org/blog/index.php?pk=211523, Retrieved Mon, 29 Apr 2024 17:32:33 +0000 | |||||||||||||||||||||||||||||||||||||||||
| QR Codes: | |||||||||||||||||||||||||||||||||||||||||
|
| |||||||||||||||||||||||||||||||||||||||||
| Original text written by user: | |||||||||||||||||||||||||||||||||||||||||
| IsPrivate? | No (this computation is public) | ||||||||||||||||||||||||||||||||||||||||
| User-defined keywords | kleding, schoeisel, tijd | ||||||||||||||||||||||||||||||||||||||||
| Estimated Impact | 122 | ||||||||||||||||||||||||||||||||||||||||
Tree of Dependent Computations | |||||||||||||||||||||||||||||||||||||||||
| Family? (F = Feedback message, R = changed R code, M = changed R Module, P = changed Parameters, D = changed Data) | |||||||||||||||||||||||||||||||||||||||||
| - [Univariate Data Series] [Indexcijfers van ...] [2013-09-19 13:45:43] [a3c700dc1d9df9ef9f271ed7f250ff74] [Current] | |||||||||||||||||||||||||||||||||||||||||
| Feedback Forum | |||||||||||||||||||||||||||||||||||||||||
Post a new message | |||||||||||||||||||||||||||||||||||||||||
Dataset | |||||||||||||||||||||||||||||||||||||||||
| Dataseries X: | |||||||||||||||||||||||||||||||||||||||||
103,86 103,49 103,34 103,28 103,04 102,81 102,75 103,25 107,56 107,53 107,35 106,99 106,81 106,41 106,41 106,32 106,15 106 105,96 106,53 106,52 106,46 106,27 105,83 105,46 105,1 105,09 105,04 104,87 104,67 104,54 104,9 104,9 104,89 104,8 104,41 104,31 103,88 103,88 103,86 103,89 103,98 103,98 104,29 104,29 104,24 103,98 103,54 103,44 103,32 103,3 103,26 103,14 103,11 102,91 103,23 103,23 103,14 102,91 102,42 102,1 102,07 102,06 101,98 101,83 101,75 101,56 101,66 | |||||||||||||||||||||||||||||||||||||||||
Tables (Output of Computation) | |||||||||||||||||||||||||||||||||||||||||
| |||||||||||||||||||||||||||||||||||||||||
Figures (Output of Computation) | |||||||||||||||||||||||||||||||||||||||||
Input Parameters & R Code | |||||||||||||||||||||||||||||||||||||||||
| Parameters (Session): | |||||||||||||||||||||||||||||||||||||||||
| par1 = Indexcijfers van de consumptieprijzen - synthese tabel (2004=100) , Classificatie per groep , Kleding en schoeisel ; par2 = www.belgostat.be ; par3 = Indexcijfers van de consumptieprijzen - synthese tabel (2004=100) , Classificatie per groep , Kleding en schoeisel ; par4 = No season ; | |||||||||||||||||||||||||||||||||||||||||
| Parameters (R input): | |||||||||||||||||||||||||||||||||||||||||
| par1 = Indexcijfers van de consumptieprijzen - synthese tabel (2004=100) , Classificatie per groep , Kleding en schoeisel ; par2 = www.belgostat.be ; par3 = Indexcijfers van de consumptieprijzen - synthese tabel (2004=100) , Classificatie per groep , Kleding en schoeisel ; par4 = No season ; | |||||||||||||||||||||||||||||||||||||||||
| R code (references can be found in the software module): | |||||||||||||||||||||||||||||||||||||||||
if (par4 != 'No season') { | |||||||||||||||||||||||||||||||||||||||||