Free Statistics

of Irreproducible Research!

Author's title

Author*Unverified author*
R Software Modulerwasp_histogram.wasp
Title produced by softwareHistogram
Date of computationSat, 21 Sep 2013 13:47:30 -0400
Cite this page as followsStatistical Computations at FreeStatistics.org, Office for Research Development and Education, URL https://freestatistics.org/blog/index.php?v=date/2013/Sep/21/t13797857242d1at0xb020c8n1.htm/, Retrieved Wed, 01 May 2024 23:38:23 +0000
Statistical Computations at FreeStatistics.org, Office for Research Development and Education, URL https://freestatistics.org/blog/index.php?pk=211603, Retrieved Wed, 01 May 2024 23:38:23 +0000
QR Codes:

Original text written by user:
IsPrivate?No (this computation is public)
User-defined keywords
Estimated Impact136
Family? (F = Feedback message, R = changed R code, M = changed R Module, P = changed Parameters, D = changed Data)
-       [Histogram] [] [2013-09-21 17:47:30] [27a1831061bd99e933e6c6e7cff94cc2] [Current]
Feedback Forum

Post a new message
Dataseries X:
279773
292449
334066
383477
264610
330841
360279
332567
341491
306569
271150
238664
209446
252653
271616
295886
385725
302623
308659
353597
308374
360733
349065
339107
246447
320308
302390
296501
264921
258854
313033
449565
340463
316968
332333
337437
247642
322064
425839
483352
381833
231813
302875
388575
335874
327202
313759
312874
311114
335851
516061
618796
407237
536994
616736
554622
553416
640694
637804
780845
512707
789842
859063
701257
725173
586345
650724
780711
553643
650780
568272
480615
451493
471401
455714
517030
534403
292833
544623
695731
457532
413968
407210
375873


Summary of computational transaction
Raw Inputview raw input (R code)
Raw Outputview raw output of R engine
Computing time2 seconds
R Server'Gwilym Jenkins' @ jenkins.wessa.net

\begin{tabular}{lllllllll}
\hline
Summary of computational transaction \tabularnewline
Raw Input & view raw input (R code)  \tabularnewline
Raw Output & view raw output of R engine  \tabularnewline
Computing time & 2 seconds \tabularnewline
R Server & 'Gwilym Jenkins' @ jenkins.wessa.net \tabularnewline
\hline
\end{tabular}
%Source: https://freestatistics.org/blog/index.php?pk=211603&T=0

[TABLE]
[ROW][C]Summary of computational transaction[/C][/ROW]
[ROW][C]Raw Input[/C][C]view raw input (R code) [/C][/ROW]
[ROW][C]Raw Output[/C][C]view raw output of R engine [/C][/ROW]
[ROW][C]Computing time[/C][C]2 seconds[/C][/ROW]
[ROW][C]R Server[/C][C]'Gwilym Jenkins' @ jenkins.wessa.net[/C][/ROW]
[/TABLE]
Source: https://freestatistics.org/blog/index.php?pk=211603&T=0

Globally Unique Identifier (entire table): ba.freestatistics.org/blog/index.php?pk=211603&T=0

As an alternative you can also use a QR Code:  

The GUIDs for individual cells are displayed in the table below:

Summary of computational transaction
Raw Inputview raw input (R code)
Raw Outputview raw output of R engine
Computing time2 seconds
R Server'Gwilym Jenkins' @ jenkins.wessa.net


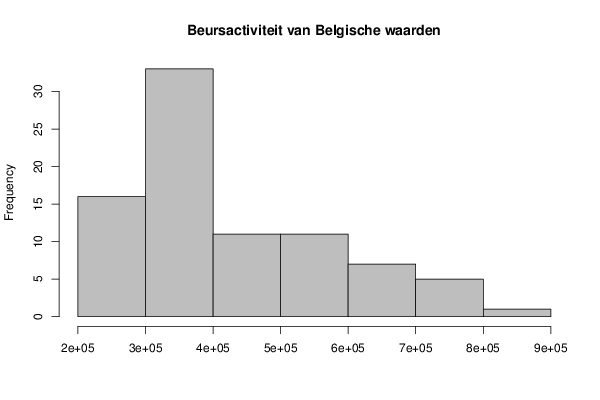
Frequency Table (Histogram)
BinsMidpointAbs. FrequencyRel. FrequencyCumul. Rel. Freq.Density
[2e+05,3e+05[250000160.1904760.1904762e-06
[3e+05,4e+05[350000330.3928570.5833334e-06
[4e+05,5e+05[450000110.1309520.7142861e-06
[5e+05,6e+05[550000110.1309520.8452381e-06
[6e+05,7e+05[65000070.0833330.9285711e-06
[7e+05,8e+05[75000050.0595240.9880951e-06
[8e+05,9e+05]85000010.01190510

\begin{tabular}{lllllllll}
\hline
Frequency Table (Histogram) \tabularnewline
Bins & Midpoint & Abs. Frequency & Rel. Frequency & Cumul. Rel. Freq. & Density \tabularnewline
[2e+05,3e+05[ & 250000 & 16 & 0.190476 & 0.190476 & 2e-06 \tabularnewline
[3e+05,4e+05[ & 350000 & 33 & 0.392857 & 0.583333 & 4e-06 \tabularnewline
[4e+05,5e+05[ & 450000 & 11 & 0.130952 & 0.714286 & 1e-06 \tabularnewline
[5e+05,6e+05[ & 550000 & 11 & 0.130952 & 0.845238 & 1e-06 \tabularnewline
[6e+05,7e+05[ & 650000 & 7 & 0.083333 & 0.928571 & 1e-06 \tabularnewline
[7e+05,8e+05[ & 750000 & 5 & 0.059524 & 0.988095 & 1e-06 \tabularnewline
[8e+05,9e+05] & 850000 & 1 & 0.011905 & 1 & 0 \tabularnewline
\hline
\end{tabular}
%Source: https://freestatistics.org/blog/index.php?pk=211603&T=1

[TABLE]
[ROW][C]Frequency Table (Histogram)[/C][/ROW]
[ROW][C]Bins[/C][C]Midpoint[/C][C]Abs. Frequency[/C][C]Rel. Frequency[/C][C]Cumul. Rel. Freq.[/C][C]Density[/C][/ROW]
[ROW][C][2e+05,3e+05[[/C][C]250000[/C][C]16[/C][C]0.190476[/C][C]0.190476[/C][C]2e-06[/C][/ROW]
[ROW][C][3e+05,4e+05[[/C][C]350000[/C][C]33[/C][C]0.392857[/C][C]0.583333[/C][C]4e-06[/C][/ROW]
[ROW][C][4e+05,5e+05[[/C][C]450000[/C][C]11[/C][C]0.130952[/C][C]0.714286[/C][C]1e-06[/C][/ROW]
[ROW][C][5e+05,6e+05[[/C][C]550000[/C][C]11[/C][C]0.130952[/C][C]0.845238[/C][C]1e-06[/C][/ROW]
[ROW][C][6e+05,7e+05[[/C][C]650000[/C][C]7[/C][C]0.083333[/C][C]0.928571[/C][C]1e-06[/C][/ROW]
[ROW][C][7e+05,8e+05[[/C][C]750000[/C][C]5[/C][C]0.059524[/C][C]0.988095[/C][C]1e-06[/C][/ROW]
[ROW][C][8e+05,9e+05][/C][C]850000[/C][C]1[/C][C]0.011905[/C][C]1[/C][C]0[/C][/ROW]
[/TABLE]
Source: https://freestatistics.org/blog/index.php?pk=211603&T=1

Globally Unique Identifier (entire table): ba.freestatistics.org/blog/index.php?pk=211603&T=1

As an alternative you can also use a QR Code:  

The GUIDs for individual cells are displayed in the table below:

Frequency Table (Histogram)
BinsMidpointAbs. FrequencyRel. FrequencyCumul. Rel. Freq.Density
[2e+05,3e+05[250000160.1904760.1904762e-06
[3e+05,4e+05[350000330.3928570.5833334e-06
[4e+05,5e+05[450000110.1309520.7142861e-06
[5e+05,6e+05[550000110.1309520.8452381e-06
[6e+05,7e+05[65000070.0833330.9285711e-06
[7e+05,8e+05[75000050.0595240.9880951e-06
[8e+05,9e+05]85000010.01190510


Parameters (Session):
par2 = grey ; par3 = FALSE ; par4 = Unknown ;
Parameters (R input):
par1 = ; par2 = grey ; par3 = FALSE ; par4 = Unknown ;
R code (references can be found in the software module):
par1 <- as.numeric(par1)
if (par3 == 'TRUE') par3 <- TRUE
if (par3 == 'FALSE') par3 <- FALSE
if (par4 == 'Unknown') par1 <- as.numeric(par1)
if (par4 == 'Interval/Ratio') par1 <- as.numeric(par1)
if (par4 == '3-point Likert') par1 <- c(1:3 - 0.5, 3.5)
if (par4 == '4-point Likert') par1 <- c(1:4 - 0.5, 4.5)
if (par4 == '5-point Likert') par1 <- c(1:5 - 0.5, 5.5)
if (par4 == '6-point Likert') par1 <- c(1:6 - 0.5, 6.5)
if (par4 == '7-point Likert') par1 <- c(1:7 - 0.5, 7.5)
if (par4 == '8-point Likert') par1 <- c(1:8 - 0.5, 8.5)
if (par4 == '9-point Likert') par1 <- c(1:9 - 0.5, 9.5)
if (par4 == '10-point Likert') par1 <- c(1:10 - 0.5, 10.5)
bitmap(file='test1.png')
if(is.numeric(x[1])) {
if (is.na(par1)) {
myhist<-hist(x,col=par2,main=main,xlab=xlab,right=par3)
} else {
if (par1 < 0) par1 <- 3
if (par1 > 50) par1 <- 50
myhist<-hist(x,breaks=par1,col=par2,main=main,xlab=xlab,right=par3)
}
} else {
plot(mytab <- table(x),col=par2,main='Frequency Plot',xlab=xlab,ylab='Absolute Frequency')
}
dev.off()
if(is.numeric(x[1])) {
myhist
n <- length(x)
load(file='createtable')
a<-table.start()
a<-table.row.start(a)
a<-table.element(a,hyperlink('histogram.htm','Frequency Table (Histogram)',''),6,TRUE)
a<-table.row.end(a)
a<-table.row.start(a)
a<-table.element(a,'Bins',header=TRUE)
a<-table.element(a,'Midpoint',header=TRUE)
a<-table.element(a,'Abs. Frequency',header=TRUE)
a<-table.element(a,'Rel. Frequency',header=TRUE)
a<-table.element(a,'Cumul. Rel. Freq.',header=TRUE)
a<-table.element(a,'Density',header=TRUE)
a<-table.row.end(a)
crf <- 0
if (par3 == FALSE) mybracket <- '[' else mybracket <- ']'
mynumrows <- (length(myhist$breaks)-1)
for (i in 1:mynumrows) {
a<-table.row.start(a)
if (i == 1)
dum <- paste('[',myhist$breaks[i],sep='')
else
dum <- paste(mybracket,myhist$breaks[i],sep='')
dum <- paste(dum,myhist$breaks[i+1],sep=',')
if (i==mynumrows)
dum <- paste(dum,']',sep='')
else
dum <- paste(dum,mybracket,sep='')
a<-table.element(a,dum,header=TRUE)
a<-table.element(a,myhist$mids[i])
a<-table.element(a,myhist$counts[i])
rf <- myhist$counts[i]/n
crf <- crf + rf
a<-table.element(a,round(rf,6))
a<-table.element(a,round(crf,6))
a<-table.element(a,round(myhist$density[i],6))
a<-table.row.end(a)
}
a<-table.end(a)
table.save(a,file='mytable.tab')
} else {
mytab
reltab <- mytab / sum(mytab)
n <- length(mytab)
load(file='createtable')
a<-table.start()
a<-table.row.start(a)
a<-table.element(a,'Frequency Table (Categorical Data)',3,TRUE)
a<-table.row.end(a)
a<-table.row.start(a)
a<-table.element(a,'Category',header=TRUE)
a<-table.element(a,'Abs. Frequency',header=TRUE)
a<-table.element(a,'Rel. Frequency',header=TRUE)
a<-table.row.end(a)
for (i in 1:n) {
a<-table.row.start(a)
a<-table.element(a,labels(mytab)$x[i],header=TRUE)
a<-table.element(a,mytab[i])
a<-table.element(a,round(reltab[i],4))
a<-table.row.end(a)
}
a<-table.end(a)
table.save(a,file='mytable1.tab')
}