Free Statistics
of Irreproducible Research!
Description of Statistical Computation | |||||||||||||||||||||||||||||||||||||||||
|---|---|---|---|---|---|---|---|---|---|---|---|---|---|---|---|---|---|---|---|---|---|---|---|---|---|---|---|---|---|---|---|---|---|---|---|---|---|---|---|---|---|
| Author's title | |||||||||||||||||||||||||||||||||||||||||
| Author | *Unverified author* | ||||||||||||||||||||||||||||||||||||||||
| R Software Module | rwasp_univariatedataseries.wasp | ||||||||||||||||||||||||||||||||||||||||
| Title produced by software | Univariate Data Series | ||||||||||||||||||||||||||||||||||||||||
| Date of computation | Sun, 22 Sep 2013 12:11:11 -0400 | ||||||||||||||||||||||||||||||||||||||||
| Cite this page as follows | Statistical Computations at FreeStatistics.org, Office for Research Development and Education, URL https://freestatistics.org/blog/index.php?v=date/2013/Sep/22/t1379866305bzlj1m5xntigvg9.htm/, Retrieved Sun, 28 Apr 2024 04:27:49 +0000 | ||||||||||||||||||||||||||||||||||||||||
| Statistical Computations at FreeStatistics.org, Office for Research Development and Education, URL https://freestatistics.org/blog/index.php?pk=211626, Retrieved Sun, 28 Apr 2024 04:27:49 +0000 | |||||||||||||||||||||||||||||||||||||||||
| QR Codes: | |||||||||||||||||||||||||||||||||||||||||
|
| |||||||||||||||||||||||||||||||||||||||||
| Original text written by user: | |||||||||||||||||||||||||||||||||||||||||
| IsPrivate? | No (this computation is public) | ||||||||||||||||||||||||||||||||||||||||
| User-defined keywords | |||||||||||||||||||||||||||||||||||||||||
| Estimated Impact | 183 | ||||||||||||||||||||||||||||||||||||||||
Tree of Dependent Computations | |||||||||||||||||||||||||||||||||||||||||
| Family? (F = Feedback message, R = changed R code, M = changed R Module, P = changed Parameters, D = changed Data) | |||||||||||||||||||||||||||||||||||||||||
| - [Univariate Data Series] [] [2013-09-22 16:11:11] [154a417cb3d2e1b589b01477b4193420] [Current] | |||||||||||||||||||||||||||||||||||||||||
| Feedback Forum | |||||||||||||||||||||||||||||||||||||||||
Post a new message | |||||||||||||||||||||||||||||||||||||||||
Dataset | |||||||||||||||||||||||||||||||||||||||||
| Dataseries X: | |||||||||||||||||||||||||||||||||||||||||
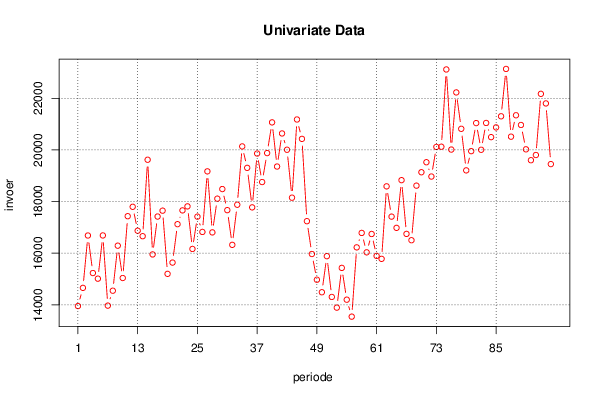
13953,3 14657,7 16686,2 15232,4 15014,1 16688,6 13969,6 14546,8 16292 15039 17433,8 17798,4 16870,9 16659,3 19620,4 15953,5 17420,9 17647,5 15200,8 15637,3 17124,5 17659,4 17815 16165,6 17416,6 16823,9 19171,2 16806,8 18112,8 18485,5 17668 16324,3 17877,5 20136,7 19307 17776,3 19861,3 18757 19879,3 21068,4 19358 20639,2 20008,1 18150,1 21180,4 20428,9 17241,2 15969,3 14972,4 14488,3 15885,1 14305,3 13891,5 15431,6 14199,3 13542,6 16226,3 16786,1 16034,3 16744,5 15896,5 15781,8 18590,3 17416,8 16983 18829,4 16748,6 16502,8 18616,6 19136,4 19523,9 18970,2 20118,2 20125,4 23117,8 20014,6 22228,5 20819,1 19208,9 19953,3 21041,3 20006,8 21045,1 20496,3 20873,5 21304,2 23137,8 20514,2 21343,5 20967,2 20024,4 19602,7 19804,1 22173,9 21802,6 19452,2 | |||||||||||||||||||||||||||||||||||||||||
Tables (Output of Computation) | |||||||||||||||||||||||||||||||||||||||||
| |||||||||||||||||||||||||||||||||||||||||
Figures (Output of Computation) | |||||||||||||||||||||||||||||||||||||||||
Input Parameters & R Code | |||||||||||||||||||||||||||||||||||||||||
| Parameters (Session): | |||||||||||||||||||||||||||||||||||||||||
| par1 = Evolutie van buitelandse handel Belgi� ; par2 = Belgostat ; par3 = totale invoer Belgi� ; par4 = 12 ; | |||||||||||||||||||||||||||||||||||||||||
| Parameters (R input): | |||||||||||||||||||||||||||||||||||||||||
| par1 = Evolutie van buitelandse handel Belgi� ; par2 = Belgostat ; par3 = totale invoer Belgi� ; par4 = 12 ; | |||||||||||||||||||||||||||||||||||||||||
| R code (references can be found in the software module): | |||||||||||||||||||||||||||||||||||||||||
if (par4 != 'No season') { | |||||||||||||||||||||||||||||||||||||||||