Free Statistics
of Irreproducible Research!
Description of Statistical Computation | |||||||||||||||||||||||||||||||||||||||||
|---|---|---|---|---|---|---|---|---|---|---|---|---|---|---|---|---|---|---|---|---|---|---|---|---|---|---|---|---|---|---|---|---|---|---|---|---|---|---|---|---|---|
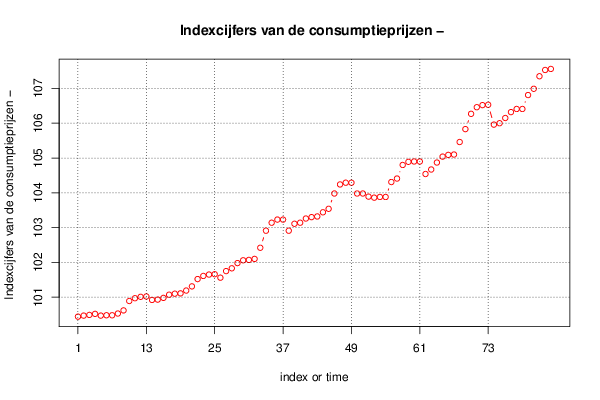
| Author's title | Indexcijfers van de consumptieprijzen - synthese tabel (2004=100) , Classif... | ||||||||||||||||||||||||||||||||||||||||
| Author | *Unverified author* | ||||||||||||||||||||||||||||||||||||||||
| R Software Module | rwasp_univariatedataseries.wasp | ||||||||||||||||||||||||||||||||||||||||
| Title produced by software | Univariate Data Series | ||||||||||||||||||||||||||||||||||||||||
| Date of computation | Mon, 23 Sep 2013 02:33:39 -0400 | ||||||||||||||||||||||||||||||||||||||||
| Cite this page as follows | Statistical Computations at FreeStatistics.org, Office for Research Development and Education, URL https://freestatistics.org/blog/index.php?v=date/2013/Sep/23/t1379918068qd2zhxbrvu79hby.htm/, Retrieved Sun, 28 Apr 2024 18:58:05 +0000 | ||||||||||||||||||||||||||||||||||||||||
| Statistical Computations at FreeStatistics.org, Office for Research Development and Education, URL https://freestatistics.org/blog/index.php?pk=211636, Retrieved Sun, 28 Apr 2024 18:58:05 +0000 | |||||||||||||||||||||||||||||||||||||||||
| QR Codes: | |||||||||||||||||||||||||||||||||||||||||
|
| |||||||||||||||||||||||||||||||||||||||||
| Original text written by user: | |||||||||||||||||||||||||||||||||||||||||
| IsPrivate? | No (this computation is public) | ||||||||||||||||||||||||||||||||||||||||
| User-defined keywords | |||||||||||||||||||||||||||||||||||||||||
| Estimated Impact | 130 | ||||||||||||||||||||||||||||||||||||||||
Tree of Dependent Computations | |||||||||||||||||||||||||||||||||||||||||
| Family? (F = Feedback message, R = changed R code, M = changed R Module, P = changed Parameters, D = changed Data) | |||||||||||||||||||||||||||||||||||||||||
| - [Univariate Data Series] [Indexcijfers van ...] [2013-09-23 06:33:39] [79b59004c90874912279e9b1431bd052] [Current] - RMPD [Histogram] [] [2013-09-23 08:13:16] [9fb2675916b8773bb0a74f31adc60d44] - R P [Histogram] [] [2013-09-23 09:42:23] [9fb2675916b8773bb0a74f31adc60d44] - [Histogram] [] [2013-09-23 09:51:46] [9fb2675916b8773bb0a74f31adc60d44] - R P [Histogram] [] [2013-09-23 09:50:15] [9fb2675916b8773bb0a74f31adc60d44] - RMPD [Kernel Density Estimation] [] [2013-09-23 08:14:29] [9fb2675916b8773bb0a74f31adc60d44] - R [Kernel Density Estimation] [] [2013-09-23 09:47:24] [9fb2675916b8773bb0a74f31adc60d44] - [Kernel Density Estimation] [] [2013-09-23 09:53:11] [9fb2675916b8773bb0a74f31adc60d44] - RMPD [Histogram] [] [2013-09-23 09:06:20] [9fb2675916b8773bb0a74f31adc60d44] | |||||||||||||||||||||||||||||||||||||||||
| Feedback Forum | |||||||||||||||||||||||||||||||||||||||||
Post a new message | |||||||||||||||||||||||||||||||||||||||||
Dataset | |||||||||||||||||||||||||||||||||||||||||
| Dataseries X: | |||||||||||||||||||||||||||||||||||||||||
100,44 100,47 100,49 100,52 100,47 100,48 100,48 100,53 100,62 100,89 100,97 101,01 101,02 100,92 100,93 100,98 101,07 101,1 101,11 101,19 101,31 101,52 101,61 101,65 101,66 101,56 101,75 101,83 101,98 102,06 102,07 102,1 102,42 102,91 103,14 103,23 103,23 102,91 103,11 103,14 103,26 103,3 103,32 103,44 103,54 103,98 104,24 104,29 104,29 103,98 103,98 103,89 103,86 103,88 103,88 104,31 104,41 104,8 104,89 104,9 104,9 104,54 104,67 104,87 105,04 105,09 105,1 105,46 105,83 106,27 106,46 106,52 106,53 105,96 106 106,15 106,32 106,41 106,41 106,81 106,99 107,35 107,53 107,56 | |||||||||||||||||||||||||||||||||||||||||
Tables (Output of Computation) | |||||||||||||||||||||||||||||||||||||||||
| |||||||||||||||||||||||||||||||||||||||||
Figures (Output of Computation) | |||||||||||||||||||||||||||||||||||||||||
Input Parameters & R Code | |||||||||||||||||||||||||||||||||||||||||
| Parameters (Session): | |||||||||||||||||||||||||||||||||||||||||
| par1 = Indexcijfers van de consumptieprijzen - synthese tabel (2004=100) , Classificatie per groep , Kleding en schoeisel ; par2 = belgostat ; par3 = Indexcijfers van de consumptieprijzen - synthese tabel (2004=100) , Classificatie per groep , Kleding en schoeisel ; par4 = 12 ; | |||||||||||||||||||||||||||||||||||||||||
| Parameters (R input): | |||||||||||||||||||||||||||||||||||||||||
| par1 = Indexcijfers van de consumptieprijzen - synthese tabel (2004=100) , Classificatie per groep , Kleding en schoeisel ; par2 = belgostat ; par3 = Indexcijfers van de consumptieprijzen - synthese tabel (2004=100) , Classificatie per groep , Kleding en schoeisel ; par4 = 12 ; | |||||||||||||||||||||||||||||||||||||||||
| R code (references can be found in the software module): | |||||||||||||||||||||||||||||||||||||||||
if (par4 != 'No season') { | |||||||||||||||||||||||||||||||||||||||||