Free Statistics
of Irreproducible Research!
Description of Statistical Computation | |||||||||||||||||||||||||||||||||||||||||
|---|---|---|---|---|---|---|---|---|---|---|---|---|---|---|---|---|---|---|---|---|---|---|---|---|---|---|---|---|---|---|---|---|---|---|---|---|---|---|---|---|---|
| Author's title | |||||||||||||||||||||||||||||||||||||||||
| Author | *Unverified author* | ||||||||||||||||||||||||||||||||||||||||
| R Software Module | rwasp_univariatedataseries.wasp | ||||||||||||||||||||||||||||||||||||||||
| Title produced by software | Univariate Data Series | ||||||||||||||||||||||||||||||||||||||||
| Date of computation | Mon, 23 Sep 2013 05:25:41 -0400 | ||||||||||||||||||||||||||||||||||||||||
| Cite this page as follows | Statistical Computations at FreeStatistics.org, Office for Research Development and Education, URL https://freestatistics.org/blog/index.php?v=date/2013/Sep/23/t1379928416206628hmpaqidet.htm/, Retrieved Sun, 28 Apr 2024 19:48:04 +0000 | ||||||||||||||||||||||||||||||||||||||||
| Statistical Computations at FreeStatistics.org, Office for Research Development and Education, URL https://freestatistics.org/blog/index.php?pk=211740, Retrieved Sun, 28 Apr 2024 19:48:04 +0000 | |||||||||||||||||||||||||||||||||||||||||
| QR Codes: | |||||||||||||||||||||||||||||||||||||||||
|
| |||||||||||||||||||||||||||||||||||||||||
| Original text written by user: | |||||||||||||||||||||||||||||||||||||||||
| IsPrivate? | No (this computation is public) | ||||||||||||||||||||||||||||||||||||||||
| User-defined keywords | |||||||||||||||||||||||||||||||||||||||||
| Estimated Impact | 108 | ||||||||||||||||||||||||||||||||||||||||
Tree of Dependent Computations | |||||||||||||||||||||||||||||||||||||||||
| Family? (F = Feedback message, R = changed R code, M = changed R Module, P = changed Parameters, D = changed Data) | |||||||||||||||||||||||||||||||||||||||||
| - [Univariate Data Series] [] [2013-09-23 09:25:41] [51fe0640a383c3aded7defd919b1cd8b] [Current] - RMPD [Histogram] [] [2013-09-25 08:50:14] [b7079cff98e044d2a5c76a0f34a19f1a] - RMPD [Kernel Density Estimation] [] [2013-09-25 09:15:22] [b7079cff98e044d2a5c76a0f34a19f1a] | |||||||||||||||||||||||||||||||||||||||||
| Feedback Forum | |||||||||||||||||||||||||||||||||||||||||
Post a new message | |||||||||||||||||||||||||||||||||||||||||
Dataset | |||||||||||||||||||||||||||||||||||||||||
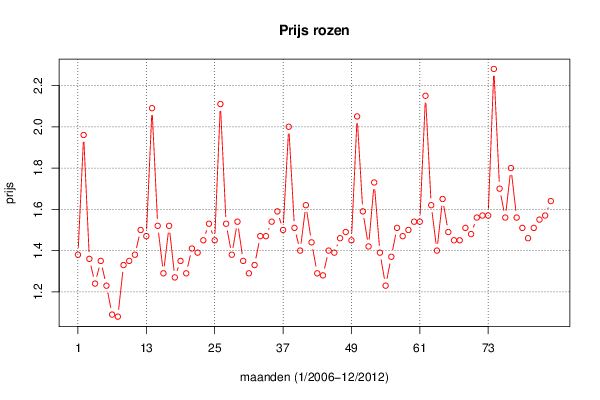
| Dataseries X: | |||||||||||||||||||||||||||||||||||||||||
1,38 1,96 1,36 1,24 1,35 1,23 1,09 1,08 1,33 1,35 1,38 1,5 1,47 2,09 1,52 1,29 1,52 1,27 1,35 1,29 1,41 1,39 1,45 1,53 1,45 2,11 1,53 1,38 1,54 1,35 1,29 1,33 1,47 1,47 1,54 1,59 1,5 2 1,51 1,4 1,62 1,44 1,29 1,28 1,4 1,39 1,46 1,49 1,45 2,05 1,59 1,42 1,73 1,39 1,23 1,37 1,51 1,47 1,5 1,54 1,54 2,15 1,62 1,4 1,65 1,49 1,45 1,45 1,51 1,48 1,56 1,57 1,57 2,28 1,7 1,56 1,8 1,56 1,51 1,46 1,51 1,55 1,57 1,64 | |||||||||||||||||||||||||||||||||||||||||
Tables (Output of Computation) | |||||||||||||||||||||||||||||||||||||||||
| |||||||||||||||||||||||||||||||||||||||||
Figures (Output of Computation) | |||||||||||||||||||||||||||||||||||||||||
Input Parameters & R Code | |||||||||||||||||||||||||||||||||||||||||
| Parameters (Session): | |||||||||||||||||||||||||||||||||||||||||
| par1 = Prijs rozen ; par2 = belgostat.be ; par3 = Prijs rozen ; par4 = 12 ; | |||||||||||||||||||||||||||||||||||||||||
| Parameters (R input): | |||||||||||||||||||||||||||||||||||||||||
| par1 = Prijs rozen ; par2 = belgostat.be ; par3 = Prijs rozen ; par4 = 12 ; | |||||||||||||||||||||||||||||||||||||||||
| R code (references can be found in the software module): | |||||||||||||||||||||||||||||||||||||||||
if (par4 != 'No season') { | |||||||||||||||||||||||||||||||||||||||||