Free Statistics
of Irreproducible Research!
Description of Statistical Computation | |||||||||||||||||||||||||||||||||||||||||
|---|---|---|---|---|---|---|---|---|---|---|---|---|---|---|---|---|---|---|---|---|---|---|---|---|---|---|---|---|---|---|---|---|---|---|---|---|---|---|---|---|---|
| Author's title | |||||||||||||||||||||||||||||||||||||||||
| Author | *Unverified author* | ||||||||||||||||||||||||||||||||||||||||
| R Software Module | rwasp_univariatedataseries.wasp | ||||||||||||||||||||||||||||||||||||||||
| Title produced by software | Univariate Data Series | ||||||||||||||||||||||||||||||||||||||||
| Date of computation | Mon, 23 Sep 2013 16:15:20 -0400 | ||||||||||||||||||||||||||||||||||||||||
| Cite this page as follows | Statistical Computations at FreeStatistics.org, Office for Research Development and Education, URL https://freestatistics.org/blog/index.php?v=date/2013/Sep/23/t1379968395cn191dxr61l9ui6.htm/, Retrieved Mon, 29 Apr 2024 05:01:27 +0000 | ||||||||||||||||||||||||||||||||||||||||
| Statistical Computations at FreeStatistics.org, Office for Research Development and Education, URL https://freestatistics.org/blog/index.php?pk=211819, Retrieved Mon, 29 Apr 2024 05:01:27 +0000 | |||||||||||||||||||||||||||||||||||||||||
| QR Codes: | |||||||||||||||||||||||||||||||||||||||||
|
| |||||||||||||||||||||||||||||||||||||||||
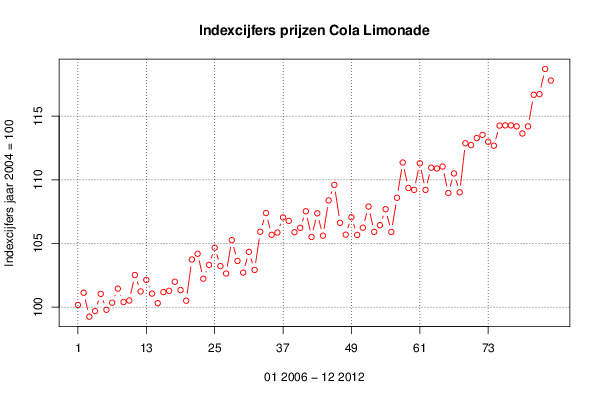
| Original text written by user: | lowest price March 2006 - 99,25 highest price November 2012 - 118,71 Difference: 19,46 | ||||||||||||||||||||||||||||||||||||||||
| IsPrivate? | No (this computation is public) | ||||||||||||||||||||||||||||||||||||||||
| User-defined keywords | Indexprijzen Cola Limonade 2006 - 2012 Source Belgostat Val�rie Weyts Karel de Grote Hogeschool Kwantitatief Onderzoek | ||||||||||||||||||||||||||||||||||||||||
| Estimated Impact | 147 | ||||||||||||||||||||||||||||||||||||||||
Tree of Dependent Computations | |||||||||||||||||||||||||||||||||||||||||
| Family? (F = Feedback message, R = changed R code, M = changed R Module, P = changed Parameters, D = changed Data) | |||||||||||||||||||||||||||||||||||||||||
| - [Univariate Data Series] [Datareeks - Index...] [2013-09-23 20:15:20] [d41d8cd98f00b204e9800998ecf8427e] [Current] - RMPD [Histogram] [Histogram - Index...] [2013-10-01 20:17:41] [ba0d20b2fbb0c8f9ef8b1828cc8a0bda] - RMPD [Histogram] [Histogram - Index...] [2013-10-01 20:29:04] [ba0d20b2fbb0c8f9ef8b1828cc8a0bda] - RMPD [Histogram] [Histogram - Index...] [2013-10-01 20:29:04] [ba0d20b2fbb0c8f9ef8b1828cc8a0bda] - RMPD [Histogram] [Histogram - Index...] [2013-10-01 20:36:53] [ba0d20b2fbb0c8f9ef8b1828cc8a0bda] - RMPD [Histogram] [Histogram - Index...] [2013-10-01 20:36:53] [ba0d20b2fbb0c8f9ef8b1828cc8a0bda] - RMP [Quartiles] [Indexprijzen cola...] [2013-10-08 18:44:17] [ba0d20b2fbb0c8f9ef8b1828cc8a0bda] - RMP [Notched Boxplots] [Indexprijzen cola...] [2013-10-08 18:52:55] [ba0d20b2fbb0c8f9ef8b1828cc8a0bda] - RMPD [Harrell-Davis Quantiles] [Gemiddelde Consum...] [2013-10-08 19:05:56] [ba0d20b2fbb0c8f9ef8b1828cc8a0bda] - RMP [Percentiles] [Gemiddelde Consum...] [2013-10-08 19:28:01] [ba0d20b2fbb0c8f9ef8b1828cc8a0bda] - RMP [Harrell-Davis Quantiles] [Indexprijzen cola...] [2013-10-08 19:42:20] [ba0d20b2fbb0c8f9ef8b1828cc8a0bda] - RMP [Percentiles] [Indexprijzen cola...] [2013-10-08 19:50:01] [ba0d20b2fbb0c8f9ef8b1828cc8a0bda] - RMPD [Kernel Density Estimation] [Dichtheidsgrafiek...] [2013-10-01 20:42:04] [ba0d20b2fbb0c8f9ef8b1828cc8a0bda] - RMPD [Kernel Density Estimation] [Dichtheidsgrafiek...] [2013-10-01 20:42:04] [ba0d20b2fbb0c8f9ef8b1828cc8a0bda] | |||||||||||||||||||||||||||||||||||||||||
| Feedback Forum | |||||||||||||||||||||||||||||||||||||||||
Post a new message | |||||||||||||||||||||||||||||||||||||||||
Dataset | |||||||||||||||||||||||||||||||||||||||||
| Dataseries X: | |||||||||||||||||||||||||||||||||||||||||
100,17 101,13 99,25 99,69 101,04 99,79 100,35 101,45 100,4 100,52 102,52 101,23 102,14 101,06 100,31 101,18 101,28 101,99 101,34 100,5 103,74 104,19 102,23 103,32 104,67 103,22 102,64 105,26 103,63 102,71 104,34 102,92 105,92 107,39 105,68 105,86 107,05 106,77 105,88 106,23 107,53 105,51 107,37 105,61 108,38 109,6 106,62 105,69 107,06 105,67 106,24 107,9 105,91 106,44 107,69 105,9 108,59 111,36 109,36 109,21 111,3 109,21 110,95 110,89 111,04 108,96 110,5 109,02 112,87 112,73 113,28 113,53 112,99 112,68 114,26 114,28 114,28 114,2 113,64 114,2 116,68 116,73 118,71 117,8 | |||||||||||||||||||||||||||||||||||||||||
Tables (Output of Computation) | |||||||||||||||||||||||||||||||||||||||||
| |||||||||||||||||||||||||||||||||||||||||
Figures (Output of Computation) | |||||||||||||||||||||||||||||||||||||||||
Input Parameters & R Code | |||||||||||||||||||||||||||||||||||||||||
| Parameters (Session): | |||||||||||||||||||||||||||||||||||||||||
| par1 = Cola-limonade ; par2 = Belgostat ; par3 = Indexcijfers van de consumptieprijzen Cola Limonade 2006 -2012 ; par4 = 12 ; | |||||||||||||||||||||||||||||||||||||||||
| Parameters (R input): | |||||||||||||||||||||||||||||||||||||||||
| par1 = Cola-limonade ; par2 = Belgostat ; par3 = Indexcijfers van de consumptieprijzen Cola Limonade 2006 -2012 ; par4 = 12 ; | |||||||||||||||||||||||||||||||||||||||||
| R code (references can be found in the software module): | |||||||||||||||||||||||||||||||||||||||||
if (par4 != 'No season') { | |||||||||||||||||||||||||||||||||||||||||