Free Statistics

of Irreproducible Research!

Author's title

Author*The author of this computation has been verified*
R Software Modulerwasp_twosampletests_mean.wasp
Title produced by softwarePaired and Unpaired Two Samples Tests about the Mean
Date of computationMon, 01 Dec 2014 18:02:30 +0000
Cite this page as followsStatistical Computations at FreeStatistics.org, Office for Research Development and Education, URL https://freestatistics.org/blog/index.php?v=date/2014/Dec/01/t1417456988fxuj9txuvynkgsa.htm/, Retrieved Thu, 16 May 2024 06:37:07 +0000
Statistical Computations at FreeStatistics.org, Office for Research Development and Education, URL https://freestatistics.org/blog/index.php?pk=262131, Retrieved Thu, 16 May 2024 06:37:07 +0000
QR Codes:

Original text written by user:
IsPrivate?No (this computation is public)
User-defined keywords
Estimated Impact76
Family? (F = Feedback message, R = changed R code, M = changed R Module, P = changed Parameters, D = changed Data)
-       [Paired and Unpaired Two Samples Tests about the Mean] [paper] [2014-12-01 18:02:30] [627bde65e5570be47fd7fc8a9f75ea40] [Current]
Feedback Forum

Post a new message
Dataseries X:
62	26
56	51
57	57
51	37
56	67
30	43
61	52
47	52
56	43
50	84
67	67
41	49
45	70
48	52
44	58
37	68
56	43
66	56
38	74
34	65
49	63
55	58
49	57
59	63
40	53
58	64
60	53
63	29
56	54
54	51
52	58
34	43
69	51
32	53
48	54
67	61
58	47
57	39
42	48
64	50
58	35
66	68
26	49
61	67
52	43
51	62
55	57
50	54
60	61
56	56
63	41
61	43
52	53
55	66
72	58
33	46
66	51
66	51
64	45
40	37
46	59
58	42
51	66
50	53
52	52
54	16
66	46
61	56
80	50
51	59
56	60
53	52
47	44
50	67
39	52
58	55
35	37
58	54
60	51
62	48
63	60
53	50
46	63
67	33
59	67
64	46
38	54
50	59
48	61
47	47
66	69
63	52
44	55
43	55
38	41
56	73
45	51
50	52
54	50
55	51
37	60
46	56
51	56
64	29
47	73
62	55
67	43
56	61
65	56
50	56
57	47
47	25
47	46
57	51
50	48
22	47
59	58
56	51
53	55
42	57
52	60
54	56
44	49
62	43
53	59
50	58
36	53
76	48
66	51
62	59
59	62
47	51
55	64
58	52
60	50
57	54
45	58
49	63
62	31
56	71
60	54
67	43
52	41
52	63
53	63
45	56
47	51
41	41
53	66
34	44
45	58
44	51
60	57
53	30
53	46
51	51
65	56
51	58
49	44
58	14
62	53
52	42
50	44
53	30
62	46
66	50
50	54
58	48
53	55
59	35
58	55
52	41
58	59
71	54
58	66
46	55
64	45
67	51
44	47
69	42
64	53
38	53
59	41
47	55
57	55
51	46
67	63
43	43
41	65
58	59
64	39
50	44
59	57
55	69
59	46
58	46
41	40
77	70
58	54
62	77
60	60
56	50
43	66
54	60
54	51
56	69
65	60
66	58
62	39
67	51
53	52
49	49
56	63
76	51
33	52
72	52
51	31
42	61
69	54
51	72
51	65
67	56
64	63
58	45
	52
	68
	45
	70
	69
	46
	39
	54
	41
	68
	63
	57
	61
	39
	59
	51
	51
	65
	50
	21
	47
	37
	58
	51
	40
	64
	58
	56
	63
	60
	64
	47
	46
	50
	46
	44
	58
	58
	25
	56
	56
	59
	46
	49
	53
	58
	54
	52
	59
	53


Summary of computational transaction
Raw Inputview raw input (R code)
Raw Outputview raw output of R engine
Computing time2 seconds
R Server'George Udny Yule' @ yule.wessa.net

\begin{tabular}{lllllllll}
\hline
Summary of computational transaction \tabularnewline
Raw Input & view raw input (R code)  \tabularnewline
Raw Output & view raw output of R engine  \tabularnewline
Computing time & 2 seconds \tabularnewline
R Server & 'George Udny Yule' @ yule.wessa.net \tabularnewline
\hline
\end{tabular}
%Source: https://freestatistics.org/blog/index.php?pk=262131&T=0

[TABLE]
[ROW][C]Summary of computational transaction[/C][/ROW]
[ROW][C]Raw Input[/C][C]view raw input (R code) [/C][/ROW]
[ROW][C]Raw Output[/C][C]view raw output of R engine [/C][/ROW]
[ROW][C]Computing time[/C][C]2 seconds[/C][/ROW]
[ROW][C]R Server[/C][C]'George Udny Yule' @ yule.wessa.net[/C][/ROW]
[/TABLE]
Source: https://freestatistics.org/blog/index.php?pk=262131&T=0

Globally Unique Identifier (entire table): ba.freestatistics.org/blog/index.php?pk=262131&T=0

As an alternative you can also use a QR Code:  

The GUIDs for individual cells are displayed in the table below:

Summary of computational transaction
Raw Inputview raw input (R code)
Raw Outputview raw output of R engine
Computing time2 seconds
R Server'George Udny Yule' @ yule.wessa.net


Two Sample t-test (unpaired)
Mean of Sample 153.5547445255474
Mean of Sample 253.0693430656934
t-stat0.554178349617128
df546
p-value0.579683692305468
H0 value0
Alternativetwo.sided
CI Level0.95
CI[-1.23513303027734,2.20593594998538]
F-test to compare two variances
F-stat0.847053356518013
df273
p-value0.170913053602247
H0 value1
Alternativetwo.sided
CI Level0.95
CI[0.667822684874703,1.07438606839636]

\begin{tabular}{lllllllll}
\hline
Two Sample t-test (unpaired) \tabularnewline
Mean of Sample 1 & 53.5547445255474 \tabularnewline
Mean of Sample 2 & 53.0693430656934 \tabularnewline
t-stat & 0.554178349617128 \tabularnewline
df & 546 \tabularnewline
p-value & 0.579683692305468 \tabularnewline
H0 value & 0 \tabularnewline
Alternative & two.sided \tabularnewline
CI Level & 0.95 \tabularnewline
CI & [-1.23513303027734,2.20593594998538] \tabularnewline
F-test to compare two variances \tabularnewline
F-stat & 0.847053356518013 \tabularnewline
df & 273 \tabularnewline
p-value & 0.170913053602247 \tabularnewline
H0 value & 1 \tabularnewline
Alternative & two.sided \tabularnewline
CI Level & 0.95 \tabularnewline
CI & [0.667822684874703,1.07438606839636] \tabularnewline
\hline
\end{tabular}
%Source: https://freestatistics.org/blog/index.php?pk=262131&T=1

[TABLE]
[ROW][C]Two Sample t-test (unpaired)[/C][/ROW]
[ROW][C]Mean of Sample 1[/C][C]53.5547445255474[/C][/ROW]
[ROW][C]Mean of Sample 2[/C][C]53.0693430656934[/C][/ROW]
[ROW][C]t-stat[/C][C]0.554178349617128[/C][/ROW]
[ROW][C]df[/C][C]546[/C][/ROW]
[ROW][C]p-value[/C][C]0.579683692305468[/C][/ROW]
[ROW][C]H0 value[/C][C]0[/C][/ROW]
[ROW][C]Alternative[/C][C]two.sided[/C][/ROW]
[ROW][C]CI Level[/C][C]0.95[/C][/ROW]
[ROW][C]CI[/C][C][-1.23513303027734,2.20593594998538][/C][/ROW]
[ROW][C]F-test to compare two variances[/C][/ROW]
[ROW][C]F-stat[/C][C]0.847053356518013[/C][/ROW]
[ROW][C]df[/C][C]273[/C][/ROW]
[ROW][C]p-value[/C][C]0.170913053602247[/C][/ROW]
[ROW][C]H0 value[/C][C]1[/C][/ROW]
[ROW][C]Alternative[/C][C]two.sided[/C][/ROW]
[ROW][C]CI Level[/C][C]0.95[/C][/ROW]
[ROW][C]CI[/C][C][0.667822684874703,1.07438606839636][/C][/ROW]
[/TABLE]
Source: https://freestatistics.org/blog/index.php?pk=262131&T=1

Globally Unique Identifier (entire table): ba.freestatistics.org/blog/index.php?pk=262131&T=1

As an alternative you can also use a QR Code:  

The GUIDs for individual cells are displayed in the table below:

Two Sample t-test (unpaired)
Mean of Sample 153.5547445255474
Mean of Sample 253.0693430656934
t-stat0.554178349617128
df546
p-value0.579683692305468
H0 value0
Alternativetwo.sided
CI Level0.95
CI[-1.23513303027734,2.20593594998538]
F-test to compare two variances
F-stat0.847053356518013
df273
p-value0.170913053602247
H0 value1
Alternativetwo.sided
CI Level0.95
CI[0.667822684874703,1.07438606839636]


Welch Two Sample t-test (unpaired)
Mean of Sample 153.5547445255474
Mean of Sample 253.0693430656934
t-stat0.554178349617128
df542.281686897768
p-value0.579685247633146
H0 value0
Alternativetwo.sided
CI Level0.95
CI[-1.23515923889151,2.20596215859954]

\begin{tabular}{lllllllll}
\hline
Welch Two Sample t-test (unpaired) \tabularnewline
Mean of Sample 1 & 53.5547445255474 \tabularnewline
Mean of Sample 2 & 53.0693430656934 \tabularnewline
t-stat & 0.554178349617128 \tabularnewline
df & 542.281686897768 \tabularnewline
p-value & 0.579685247633146 \tabularnewline
H0 value & 0 \tabularnewline
Alternative & two.sided \tabularnewline
CI Level & 0.95 \tabularnewline
CI & [-1.23515923889151,2.20596215859954] \tabularnewline
\hline
\end{tabular}
%Source: https://freestatistics.org/blog/index.php?pk=262131&T=2

[TABLE]
[ROW][C]Welch Two Sample t-test (unpaired)[/C][/ROW]
[ROW][C]Mean of Sample 1[/C][C]53.5547445255474[/C][/ROW]
[ROW][C]Mean of Sample 2[/C][C]53.0693430656934[/C][/ROW]
[ROW][C]t-stat[/C][C]0.554178349617128[/C][/ROW]
[ROW][C]df[/C][C]542.281686897768[/C][/ROW]
[ROW][C]p-value[/C][C]0.579685247633146[/C][/ROW]
[ROW][C]H0 value[/C][C]0[/C][/ROW]
[ROW][C]Alternative[/C][C]two.sided[/C][/ROW]
[ROW][C]CI Level[/C][C]0.95[/C][/ROW]
[ROW][C]CI[/C][C][-1.23515923889151,2.20596215859954][/C][/ROW]
[/TABLE]
Source: https://freestatistics.org/blog/index.php?pk=262131&T=2

Globally Unique Identifier (entire table): ba.freestatistics.org/blog/index.php?pk=262131&T=2

As an alternative you can also use a QR Code:  

The GUIDs for individual cells are displayed in the table below:

Welch Two Sample t-test (unpaired)
Mean of Sample 153.5547445255474
Mean of Sample 253.0693430656934
t-stat0.554178349617128
df542.281686897768
p-value0.579685247633146
H0 value0
Alternativetwo.sided
CI Level0.95
CI[-1.23515923889151,2.20596215859954]


Wicoxon rank sum test with continuity correction (unpaired)
W38655
p-value0.546610501601194
H0 value0
Alternativetwo.sided
Kolmogorov-Smirnov Test to compare Distributions of two Samples
KS Statistic0.062043795620438
p-value0.667286149623629
Kolmogorov-Smirnov Test to compare Distributional Shape of two Samples
KS Statistic0.0656934306569343
p-value0.595427735394038

\begin{tabular}{lllllllll}
\hline
Wicoxon rank sum test with continuity correction (unpaired) \tabularnewline
W & 38655 \tabularnewline
p-value & 0.546610501601194 \tabularnewline
H0 value & 0 \tabularnewline
Alternative & two.sided \tabularnewline
Kolmogorov-Smirnov Test to compare Distributions of two Samples \tabularnewline
KS Statistic & 0.062043795620438 \tabularnewline
p-value & 0.667286149623629 \tabularnewline
Kolmogorov-Smirnov Test to compare Distributional Shape of two Samples \tabularnewline
KS Statistic & 0.0656934306569343 \tabularnewline
p-value & 0.595427735394038 \tabularnewline
\hline
\end{tabular}
%Source: https://freestatistics.org/blog/index.php?pk=262131&T=3

[TABLE]
[ROW][C]Wicoxon rank sum test with continuity correction (unpaired)[/C][/ROW]
[ROW][C]W[/C][C]38655[/C][/ROW]
[ROW][C]p-value[/C][C]0.546610501601194[/C][/ROW]
[ROW][C]H0 value[/C][C]0[/C][/ROW]
[ROW][C]Alternative[/C][C]two.sided[/C][/ROW]
[ROW][C]Kolmogorov-Smirnov Test to compare Distributions of two Samples[/C][/ROW]
[ROW][C]KS Statistic[/C][C]0.062043795620438[/C][/ROW]
[ROW][C]p-value[/C][C]0.667286149623629[/C][/ROW]
[ROW][C]Kolmogorov-Smirnov Test to compare Distributional Shape of two Samples[/C][/ROW]
[ROW][C]KS Statistic[/C][C]0.0656934306569343[/C][/ROW]
[ROW][C]p-value[/C][C]0.595427735394038[/C][/ROW]
[/TABLE]
Source: https://freestatistics.org/blog/index.php?pk=262131&T=3

Globally Unique Identifier (entire table): ba.freestatistics.org/blog/index.php?pk=262131&T=3

As an alternative you can also use a QR Code:  

The GUIDs for individual cells are displayed in the table below:

Wicoxon rank sum test with continuity correction (unpaired)
W38655
p-value0.546610501601194
H0 value0
Alternativetwo.sided
Kolmogorov-Smirnov Test to compare Distributions of two Samples
KS Statistic0.062043795620438
p-value0.667286149623629
Kolmogorov-Smirnov Test to compare Distributional Shape of two Samples
KS Statistic0.0656934306569343
p-value0.595427735394038


Parameters (Session):
par1 = 1 ; par2 = 2 ; par3 = 0.95 ; par4 = two.sided ; par5 = unpaired ; par6 = 0 ;
Parameters (R input):
par1 = 1 ; par2 = 2 ; par3 = 0.95 ; par4 = two.sided ; par5 = unpaired ; par6 = 0 ;
R code (references can be found in the software module):
par1 <- as.numeric(par1) #column number of first sample
par2 <- as.numeric(par2) #column number of second sample
par3 <- as.numeric(par3) #confidence (= 1 - alpha)
if (par5 == 'unpaired') paired <- FALSE else paired <- TRUE
par6 <- as.numeric(par6) #H0
z <- t(y)
if (par1 == par2) stop('Please, select two different column numbers')
if (par1 < 1) stop('Please, select a column number greater than zero for the first sample')
if (par2 < 1) stop('Please, select a column number greater than zero for the second sample')
if (par1 > length(z[1,])) stop('The column number for the first sample should be smaller')
if (par2 > length(z[1,])) stop('The column number for the second sample should be smaller')
if (par3 <= 0) stop('The confidence level should be larger than zero')
if (par3 >= 1) stop('The confidence level should be smaller than zero')
(r.t <- t.test(z[,par1],z[,par2],var.equal=TRUE,alternative=par4,paired=paired,mu=par6,conf.level=par3))
(v.t <- var.test(z[,par1],z[,par2],conf.level=par3))
(r.w <- t.test(z[,par1],z[,par2],var.equal=FALSE,alternative=par4,paired=paired,mu=par6,conf.level=par3))
(w.t <- wilcox.test(z[,par1],z[,par2],alternative=par4,paired=paired,mu=par6,conf.level=par3))
(ks.t <- ks.test(z[,par1],z[,par2],alternative=par4))
m1 <- mean(z[,par1],na.rm=T)
m2 <- mean(z[,par2],na.rm=T)
mdiff <- m1 - m2
newsam1 <- z[!is.na(z[,par1]),par1]
newsam2 <- z[,par2]+mdiff
newsam2 <- newsam2[!is.na(newsam2)]
(ks1.t <- ks.test(newsam1,newsam2,alternative=par4))
mydf <- data.frame(cbind(z[,par1],z[,par2]))
colnames(mydf) <- c('Variable 1','Variable 2')
bitmap(file='test1.png')
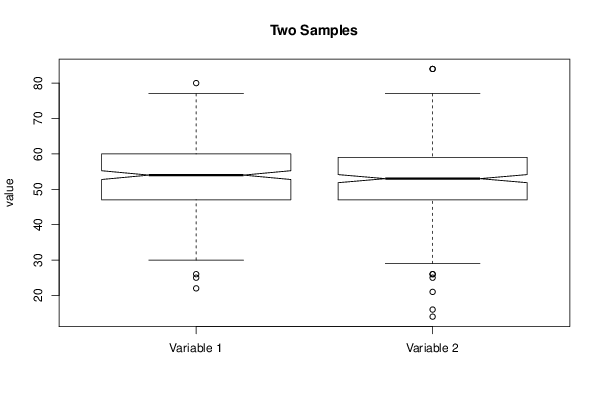
boxplot(mydf, notch=TRUE, ylab='value',main=main)
dev.off()
bitmap(file='test2.png')
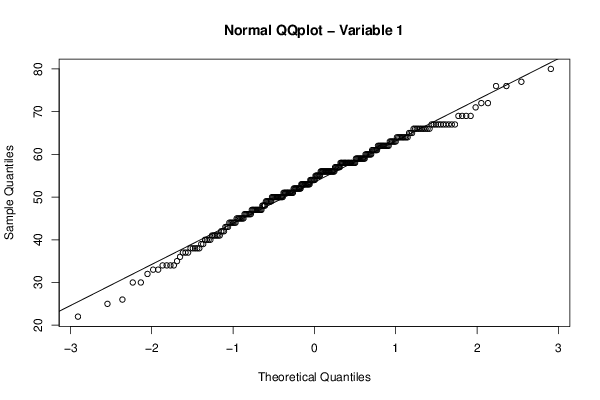
qqnorm(z[,par1],main='Normal QQplot - Variable 1')
qqline(z[,par1])
dev.off()
bitmap(file='test3.png')
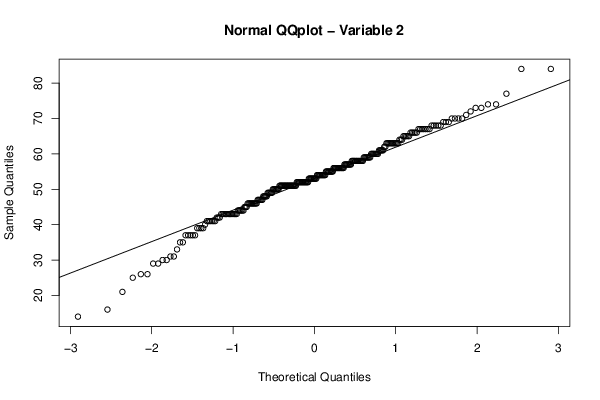
qqnorm(z[,par2],main='Normal QQplot - Variable 2')
qqline(z[,par2])
dev.off()
load(file='createtable')
a<-table.start()
a<-table.row.start(a)
a<-table.element(a,paste('Two Sample t-test (',par5,')',sep=''),2,TRUE)
a<-table.row.end(a)
if(!paired){
a<-table.row.start(a)
a<-table.element(a,'Mean of Sample 1',header=TRUE)
a<-table.element(a,r.t$estimate[[1]])
a<-table.row.end(a)
a<-table.row.start(a)
a<-table.element(a,'Mean of Sample 2',header=TRUE)
a<-table.element(a,r.t$estimate[[2]])
a<-table.row.end(a)
} else {
a<-table.row.start(a)
a<-table.element(a,'Difference: Mean1 - Mean2',header=TRUE)
a<-table.element(a,r.t$estimate)
a<-table.row.end(a)
}
a<-table.row.start(a)
a<-table.element(a,'t-stat',header=TRUE)
a<-table.element(a,r.t$statistic[[1]])
a<-table.row.end(a)
a<-table.row.start(a)
a<-table.element(a,'df',header=TRUE)
a<-table.element(a,r.t$parameter[[1]])
a<-table.row.end(a)
a<-table.row.start(a)
a<-table.element(a,'p-value',header=TRUE)
a<-table.element(a,r.t$p.value)
a<-table.row.end(a)
a<-table.row.start(a)
a<-table.element(a,'H0 value',header=TRUE)
a<-table.element(a,r.t$null.value[[1]])
a<-table.row.end(a)
a<-table.row.start(a)
a<-table.element(a,'Alternative',header=TRUE)
a<-table.element(a,r.t$alternative)
a<-table.row.end(a)
a<-table.row.start(a)
a<-table.element(a,'CI Level',header=TRUE)
a<-table.element(a,attr(r.t$conf.int,'conf.level'))
a<-table.row.end(a)
a<-table.row.start(a)
a<-table.element(a,'CI',header=TRUE)
a<-table.element(a,paste('[',r.t$conf.int[1],',',r.t$conf.int[2],']',sep=''))
a<-table.row.end(a)
a<-table.row.start(a)
a<-table.element(a,'F-test to compare two variances',2,TRUE)
a<-table.row.end(a)
a<-table.row.start(a)
a<-table.element(a,'F-stat',header=TRUE)
a<-table.element(a,v.t$statistic[[1]])
a<-table.row.end(a)
a<-table.row.start(a)
a<-table.element(a,'df',header=TRUE)
a<-table.element(a,v.t$parameter[[1]])
a<-table.row.end(a)
a<-table.row.start(a)
a<-table.element(a,'p-value',header=TRUE)
a<-table.element(a,v.t$p.value)
a<-table.row.end(a)
a<-table.row.start(a)
a<-table.element(a,'H0 value',header=TRUE)
a<-table.element(a,v.t$null.value[[1]])
a<-table.row.end(a)
a<-table.row.start(a)
a<-table.element(a,'Alternative',header=TRUE)
a<-table.element(a,v.t$alternative)
a<-table.row.end(a)
a<-table.row.start(a)
a<-table.element(a,'CI Level',header=TRUE)
a<-table.element(a,attr(v.t$conf.int,'conf.level'))
a<-table.row.end(a)
a<-table.row.start(a)
a<-table.element(a,'CI',header=TRUE)
a<-table.element(a,paste('[',v.t$conf.int[1],',',v.t$conf.int[2],']',sep=''))
a<-table.row.end(a)
a<-table.end(a)
table.save(a,file='mytable.tab')
a<-table.start()
a<-table.row.start(a)
a<-table.element(a,paste('Welch Two Sample t-test (',par5,')',sep=''),2,TRUE)
a<-table.row.end(a)
if(!paired){
a<-table.row.start(a)
a<-table.element(a,'Mean of Sample 1',header=TRUE)
a<-table.element(a,r.w$estimate[[1]])
a<-table.row.end(a)
a<-table.row.start(a)
a<-table.element(a,'Mean of Sample 2',header=TRUE)
a<-table.element(a,r.w$estimate[[2]])
a<-table.row.end(a)
} else {
a<-table.row.start(a)
a<-table.element(a,'Difference: Mean1 - Mean2',header=TRUE)
a<-table.element(a,r.w$estimate)
a<-table.row.end(a)
}
a<-table.row.start(a)
a<-table.element(a,'t-stat',header=TRUE)
a<-table.element(a,r.w$statistic[[1]])
a<-table.row.end(a)
a<-table.row.start(a)
a<-table.element(a,'df',header=TRUE)
a<-table.element(a,r.w$parameter[[1]])
a<-table.row.end(a)
a<-table.row.start(a)
a<-table.element(a,'p-value',header=TRUE)
a<-table.element(a,r.w$p.value)
a<-table.row.end(a)
a<-table.row.start(a)
a<-table.element(a,'H0 value',header=TRUE)
a<-table.element(a,r.w$null.value[[1]])
a<-table.row.end(a)
a<-table.row.start(a)
a<-table.element(a,'Alternative',header=TRUE)
a<-table.element(a,r.w$alternative)
a<-table.row.end(a)
a<-table.row.start(a)
a<-table.element(a,'CI Level',header=TRUE)
a<-table.element(a,attr(r.w$conf.int,'conf.level'))
a<-table.row.end(a)
a<-table.row.start(a)
a<-table.element(a,'CI',header=TRUE)
a<-table.element(a,paste('[',r.w$conf.int[1],',',r.w$conf.int[2],']',sep=''))
a<-table.row.end(a)
a<-table.end(a)
table.save(a,file='mytable1.tab')
a<-table.start()
a<-table.row.start(a)
a<-table.element(a,paste('Wicoxon rank sum test with continuity correction (',par5,')',sep=''),2,TRUE)
a<-table.row.end(a)
a<-table.row.start(a)
a<-table.element(a,'W',header=TRUE)
a<-table.element(a,w.t$statistic[[1]])
a<-table.row.end(a)
a<-table.row.start(a)
a<-table.element(a,'p-value',header=TRUE)
a<-table.element(a,w.t$p.value)
a<-table.row.end(a)
a<-table.row.start(a)
a<-table.element(a,'H0 value',header=TRUE)
a<-table.element(a,w.t$null.value[[1]])
a<-table.row.end(a)
a<-table.row.start(a)
a<-table.element(a,'Alternative',header=TRUE)
a<-table.element(a,w.t$alternative)
a<-table.row.end(a)
a<-table.row.start(a)
a<-table.element(a,'Kolmogorov-Smirnov Test to compare Distributions of two Samples',2,TRUE)
a<-table.row.end(a)
a<-table.row.start(a)
a<-table.element(a,'KS Statistic',header=TRUE)
a<-table.element(a,ks.t$statistic[[1]])
a<-table.row.end(a)
a<-table.row.start(a)
a<-table.element(a,'p-value',header=TRUE)
a<-table.element(a,ks.t$p.value)
a<-table.row.end(a)
a<-table.row.start(a)
a<-table.element(a,'Kolmogorov-Smirnov Test to compare Distributional Shape of two Samples',2,TRUE)
a<-table.row.end(a)
a<-table.row.start(a)
a<-table.element(a,'KS Statistic',header=TRUE)
a<-table.element(a,ks1.t$statistic[[1]])
a<-table.row.end(a)
a<-table.row.start(a)
a<-table.element(a,'p-value',header=TRUE)
a<-table.element(a,ks1.t$p.value)
a<-table.row.end(a)
a<-table.end(a)
table.save(a,file='mytable2.tab')