Free Statistics

of Irreproducible Research!

Author's title

Author*The author of this computation has been verified*
R Software Modulerwasp_arimabackwardselection.wasp
Title produced by softwareARIMA Backward Selection
Date of computationTue, 02 Dec 2014 19:07:14 +0000
Cite this page as followsStatistical Computations at FreeStatistics.org, Office for Research Development and Education, URL https://freestatistics.org/blog/index.php?v=date/2014/Dec/02/t1417547259rbmfuirrsnxo5or.htm/, Retrieved Thu, 16 May 2024 12:37:38 +0000
Statistical Computations at FreeStatistics.org, Office for Research Development and Education, URL https://freestatistics.org/blog/index.php?pk=262857, Retrieved Thu, 16 May 2024 12:37:38 +0000
QR Codes:

Original text written by user:
IsPrivate?No (this computation is public)
User-defined keywords
Estimated Impact71
Family? (F = Feedback message, R = changed R code, M = changed R Module, P = changed Parameters, D = changed Data)
-       [ARIMA Backward Selection] [WS 9 ARIMA] [2014-12-02 19:07:14] [a0dc8dfb1ad11084a66a61bab0a3c2c7] [Current]
Feedback Forum

Post a new message
Dataseries X:
9700
9081
9084
9743
8587
9731
9563
9998
9437
10038
9918
9252
9737
9035
9133
9487
8700
9627
8947
9283
8829
9947
9628
9318
9605
8640
9214
9567
8547
9185
9470
9123
9278
10170
9434
9655
9429
8739
9552
9687
9019
9672
9206
9069
9788
10312
10105
9863
9656
9295
9946
9701
9049
10190
9706
9765
9893
9994
10433
10073
10112
9266
9820
10097
9115
10411
9678
10408
10153
10368
10581
10597
10680
9738
9556


Summary of computational transaction
Raw Inputview raw input (R code)
Raw Outputview raw output of R engine
Computing time4 seconds
R Server'Sir Ronald Aylmer Fisher' @ fisher.wessa.net

\begin{tabular}{lllllllll}
\hline
Summary of computational transaction \tabularnewline
Raw Input & view raw input (R code)  \tabularnewline
Raw Output & view raw output of R engine  \tabularnewline
Computing time & 4 seconds \tabularnewline
R Server & 'Sir Ronald Aylmer Fisher' @ fisher.wessa.net \tabularnewline
\hline
\end{tabular}
%Source: https://freestatistics.org/blog/index.php?pk=262857&T=0

[TABLE]
[ROW][C]Summary of computational transaction[/C][/ROW]
[ROW][C]Raw Input[/C][C]view raw input (R code) [/C][/ROW]
[ROW][C]Raw Output[/C][C]view raw output of R engine [/C][/ROW]
[ROW][C]Computing time[/C][C]4 seconds[/C][/ROW]
[ROW][C]R Server[/C][C]'Sir Ronald Aylmer Fisher' @ fisher.wessa.net[/C][/ROW]
[/TABLE]
Source: https://freestatistics.org/blog/index.php?pk=262857&T=0

Globally Unique Identifier (entire table): ba.freestatistics.org/blog/index.php?pk=262857&T=0

As an alternative you can also use a QR Code:  

The GUIDs for individual cells are displayed in the table below:

Summary of computational transaction
Raw Inputview raw input (R code)
Raw Outputview raw output of R engine
Computing time4 seconds
R Server'Sir Ronald Aylmer Fisher' @ fisher.wessa.net


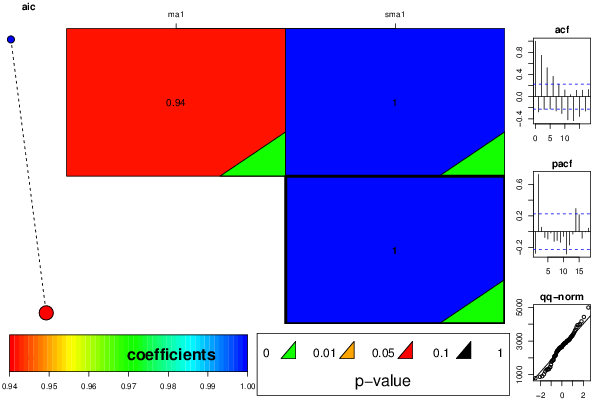
ARIMA Parameter Estimation and Backward Selection
Iterationma1sma1
Estimates ( 1 )0.94221
(p-val)(0 )(0 )
Estimates ( 2 )01
(p-val)(NA )(0 )
Estimates ( 3 )NANA
(p-val)(NA )(NA )

\begin{tabular}{lllllllll}
\hline
ARIMA Parameter Estimation and Backward Selection \tabularnewline
Iteration & ma1 & sma1 \tabularnewline
Estimates ( 1 ) & 0.9422 & 1 \tabularnewline
(p-val) & (0 ) & (0 ) \tabularnewline
Estimates ( 2 ) & 0 & 1 \tabularnewline
(p-val) & (NA ) & (0 ) \tabularnewline
Estimates ( 3 ) & NA & NA \tabularnewline
(p-val) & (NA ) & (NA ) \tabularnewline
\hline
\end{tabular}
%Source: https://freestatistics.org/blog/index.php?pk=262857&T=1

[TABLE]
[ROW][C]ARIMA Parameter Estimation and Backward Selection[/C][/ROW]
[ROW][C]Iteration[/C][C]ma1[/C][C]sma1[/C][/ROW]
[ROW][C]Estimates ( 1 )[/C][C]0.9422[/C][C]1[/C][/ROW]
[ROW][C](p-val)[/C][C](0 )[/C][C](0 )[/C][/ROW]
[ROW][C]Estimates ( 2 )[/C][C]0[/C][C]1[/C][/ROW]
[ROW][C](p-val)[/C][C](NA )[/C][C](0 )[/C][/ROW]
[ROW][C]Estimates ( 3 )[/C][C]NA[/C][C]NA[/C][/ROW]
[ROW][C](p-val)[/C][C](NA )[/C][C](NA )[/C][/ROW]
[/TABLE]
Source: https://freestatistics.org/blog/index.php?pk=262857&T=1

Globally Unique Identifier (entire table): ba.freestatistics.org/blog/index.php?pk=262857&T=1

As an alternative you can also use a QR Code:  

The GUIDs for individual cells are displayed in the table below:

ARIMA Parameter Estimation and Backward Selection
Iterationma1sma1
Estimates ( 1 )0.94221
(p-val)(0 )(0 )
Estimates ( 2 )01
(p-val)(NA )(0 )
Estimates ( 3 )NANA
(p-val)(NA )(NA )


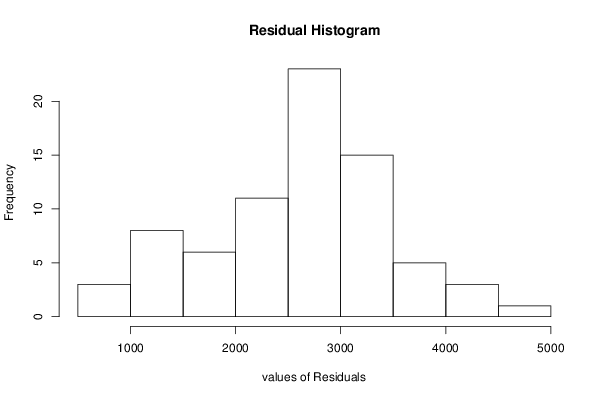
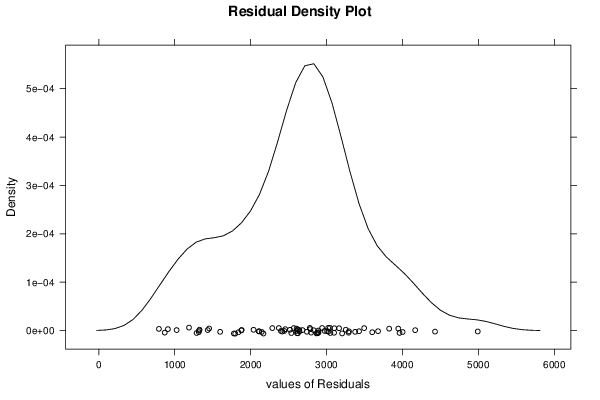
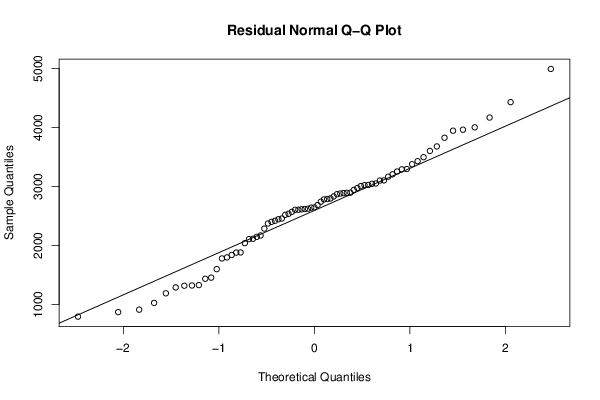
Estimated ARIMA Residuals
Value
4992.02979949943
2517.91558091349
3944.81586622486
3290.01630227098
3021.30440489972
4002.31168185367
3050.00733211069
4167.85973272968
2796.77935143476
4429.20538465835
2879.29986061295
2867.96175006434
1287.92523510233
2456.20528934039
1434.20920102312
2417.1695199345
1320.34499023329
2643.6657792967
910.155259211593
2640.28618606918
868.43054403844
3205.42594330005
791.945769909202
3602.0445326694
2112.87189448965
2893.43355241703
2604.81893737585
3164.59399142222
1881.2604658979
3428.37595950122
2568.91429051316
3006.1920303242
2830.01969250146
3295.20340567775
2371.45557271028
3024.25853281485
1327.10263899828
2779.53707415596
1797.19372668219
2617.09183086471
1838.31061971681
2886.47248265341
1024.97917272646
2941.40810287265
1597.79660601427
3099.24738576111
1877.65958115729
2973.7686714915
2603.79314808431
2740.86903454485
2891.4061937758
2612.09337092389
2285.53571731666
3376.74568505086
2621.99295542384
3252.91080880876
2399.18903609716
3102.46100920054
2683.63568096209
2786.70688634287
2168.32943522587
2145.69283422492
2443.42131258566
2535.91239430024
2038.15983130032
3043.61343638595
1188.1579255225
3678.56405574172
1316.49489557355
3825.29402153308
1453.58521019445
3961.74381759029
2106.83418525159
3495.84569084567
1778.63290245116

\begin{tabular}{lllllllll}
\hline
Estimated ARIMA Residuals \tabularnewline
Value \tabularnewline
 \tabularnewline
4992.02979949943 \tabularnewline
2517.91558091349 \tabularnewline
3944.81586622486 \tabularnewline
3290.01630227098 \tabularnewline
3021.30440489972 \tabularnewline
4002.31168185367 \tabularnewline
3050.00733211069 \tabularnewline
4167.85973272968 \tabularnewline
2796.77935143476 \tabularnewline
4429.20538465835 \tabularnewline
2879.29986061295 \tabularnewline
2867.96175006434 \tabularnewline
1287.92523510233 \tabularnewline
2456.20528934039 \tabularnewline
1434.20920102312 \tabularnewline
2417.1695199345 \tabularnewline
1320.34499023329 \tabularnewline
2643.6657792967 \tabularnewline
910.155259211593 \tabularnewline
2640.28618606918 \tabularnewline
868.43054403844 \tabularnewline
3205.42594330005 \tabularnewline
791.945769909202 \tabularnewline
3602.0445326694 \tabularnewline
2112.87189448965 \tabularnewline
2893.43355241703 \tabularnewline
2604.81893737585 \tabularnewline
3164.59399142222 \tabularnewline
1881.2604658979 \tabularnewline
3428.37595950122 \tabularnewline
2568.91429051316 \tabularnewline
3006.1920303242 \tabularnewline
2830.01969250146 \tabularnewline
3295.20340567775 \tabularnewline
2371.45557271028 \tabularnewline
3024.25853281485 \tabularnewline
1327.10263899828 \tabularnewline
2779.53707415596 \tabularnewline
1797.19372668219 \tabularnewline
2617.09183086471 \tabularnewline
1838.31061971681 \tabularnewline
2886.47248265341 \tabularnewline
1024.97917272646 \tabularnewline
2941.40810287265 \tabularnewline
1597.79660601427 \tabularnewline
3099.24738576111 \tabularnewline
1877.65958115729 \tabularnewline
2973.7686714915 \tabularnewline
2603.79314808431 \tabularnewline
2740.86903454485 \tabularnewline
2891.4061937758 \tabularnewline
2612.09337092389 \tabularnewline
2285.53571731666 \tabularnewline
3376.74568505086 \tabularnewline
2621.99295542384 \tabularnewline
3252.91080880876 \tabularnewline
2399.18903609716 \tabularnewline
3102.46100920054 \tabularnewline
2683.63568096209 \tabularnewline
2786.70688634287 \tabularnewline
2168.32943522587 \tabularnewline
2145.69283422492 \tabularnewline
2443.42131258566 \tabularnewline
2535.91239430024 \tabularnewline
2038.15983130032 \tabularnewline
3043.61343638595 \tabularnewline
1188.1579255225 \tabularnewline
3678.56405574172 \tabularnewline
1316.49489557355 \tabularnewline
3825.29402153308 \tabularnewline
1453.58521019445 \tabularnewline
3961.74381759029 \tabularnewline
2106.83418525159 \tabularnewline
3495.84569084567 \tabularnewline
1778.63290245116 \tabularnewline
\hline
\end{tabular}
%Source: https://freestatistics.org/blog/index.php?pk=262857&T=2

[TABLE]
[ROW][C]Estimated ARIMA Residuals[/C][/ROW]
[ROW][C]Value[/C][/ROW]
[ROW][C][/C][/ROW]
[ROW][C]4992.02979949943[/C][/ROW]
[ROW][C]2517.91558091349[/C][/ROW]
[ROW][C]3944.81586622486[/C][/ROW]
[ROW][C]3290.01630227098[/C][/ROW]
[ROW][C]3021.30440489972[/C][/ROW]
[ROW][C]4002.31168185367[/C][/ROW]
[ROW][C]3050.00733211069[/C][/ROW]
[ROW][C]4167.85973272968[/C][/ROW]
[ROW][C]2796.77935143476[/C][/ROW]
[ROW][C]4429.20538465835[/C][/ROW]
[ROW][C]2879.29986061295[/C][/ROW]
[ROW][C]2867.96175006434[/C][/ROW]
[ROW][C]1287.92523510233[/C][/ROW]
[ROW][C]2456.20528934039[/C][/ROW]
[ROW][C]1434.20920102312[/C][/ROW]
[ROW][C]2417.1695199345[/C][/ROW]
[ROW][C]1320.34499023329[/C][/ROW]
[ROW][C]2643.6657792967[/C][/ROW]
[ROW][C]910.155259211593[/C][/ROW]
[ROW][C]2640.28618606918[/C][/ROW]
[ROW][C]868.43054403844[/C][/ROW]
[ROW][C]3205.42594330005[/C][/ROW]
[ROW][C]791.945769909202[/C][/ROW]
[ROW][C]3602.0445326694[/C][/ROW]
[ROW][C]2112.87189448965[/C][/ROW]
[ROW][C]2893.43355241703[/C][/ROW]
[ROW][C]2604.81893737585[/C][/ROW]
[ROW][C]3164.59399142222[/C][/ROW]
[ROW][C]1881.2604658979[/C][/ROW]
[ROW][C]3428.37595950122[/C][/ROW]
[ROW][C]2568.91429051316[/C][/ROW]
[ROW][C]3006.1920303242[/C][/ROW]
[ROW][C]2830.01969250146[/C][/ROW]
[ROW][C]3295.20340567775[/C][/ROW]
[ROW][C]2371.45557271028[/C][/ROW]
[ROW][C]3024.25853281485[/C][/ROW]
[ROW][C]1327.10263899828[/C][/ROW]
[ROW][C]2779.53707415596[/C][/ROW]
[ROW][C]1797.19372668219[/C][/ROW]
[ROW][C]2617.09183086471[/C][/ROW]
[ROW][C]1838.31061971681[/C][/ROW]
[ROW][C]2886.47248265341[/C][/ROW]
[ROW][C]1024.97917272646[/C][/ROW]
[ROW][C]2941.40810287265[/C][/ROW]
[ROW][C]1597.79660601427[/C][/ROW]
[ROW][C]3099.24738576111[/C][/ROW]
[ROW][C]1877.65958115729[/C][/ROW]
[ROW][C]2973.7686714915[/C][/ROW]
[ROW][C]2603.79314808431[/C][/ROW]
[ROW][C]2740.86903454485[/C][/ROW]
[ROW][C]2891.4061937758[/C][/ROW]
[ROW][C]2612.09337092389[/C][/ROW]
[ROW][C]2285.53571731666[/C][/ROW]
[ROW][C]3376.74568505086[/C][/ROW]
[ROW][C]2621.99295542384[/C][/ROW]
[ROW][C]3252.91080880876[/C][/ROW]
[ROW][C]2399.18903609716[/C][/ROW]
[ROW][C]3102.46100920054[/C][/ROW]
[ROW][C]2683.63568096209[/C][/ROW]
[ROW][C]2786.70688634287[/C][/ROW]
[ROW][C]2168.32943522587[/C][/ROW]
[ROW][C]2145.69283422492[/C][/ROW]
[ROW][C]2443.42131258566[/C][/ROW]
[ROW][C]2535.91239430024[/C][/ROW]
[ROW][C]2038.15983130032[/C][/ROW]
[ROW][C]3043.61343638595[/C][/ROW]
[ROW][C]1188.1579255225[/C][/ROW]
[ROW][C]3678.56405574172[/C][/ROW]
[ROW][C]1316.49489557355[/C][/ROW]
[ROW][C]3825.29402153308[/C][/ROW]
[ROW][C]1453.58521019445[/C][/ROW]
[ROW][C]3961.74381759029[/C][/ROW]
[ROW][C]2106.83418525159[/C][/ROW]
[ROW][C]3495.84569084567[/C][/ROW]
[ROW][C]1778.63290245116[/C][/ROW]
[/TABLE]
Source: https://freestatistics.org/blog/index.php?pk=262857&T=2

Globally Unique Identifier (entire table): ba.freestatistics.org/blog/index.php?pk=262857&T=2

As an alternative you can also use a QR Code:  

The GUIDs for individual cells are displayed in the table below:

Estimated ARIMA Residuals
Value
4992.02979949943
2517.91558091349
3944.81586622486
3290.01630227098
3021.30440489972
4002.31168185367
3050.00733211069
4167.85973272968
2796.77935143476
4429.20538465835
2879.29986061295
2867.96175006434
1287.92523510233
2456.20528934039
1434.20920102312
2417.1695199345
1320.34499023329
2643.6657792967
910.155259211593
2640.28618606918
868.43054403844
3205.42594330005
791.945769909202
3602.0445326694
2112.87189448965
2893.43355241703
2604.81893737585
3164.59399142222
1881.2604658979
3428.37595950122
2568.91429051316
3006.1920303242
2830.01969250146
3295.20340567775
2371.45557271028
3024.25853281485
1327.10263899828
2779.53707415596
1797.19372668219
2617.09183086471
1838.31061971681
2886.47248265341
1024.97917272646
2941.40810287265
1597.79660601427
3099.24738576111
1877.65958115729
2973.7686714915
2603.79314808431
2740.86903454485
2891.4061937758
2612.09337092389
2285.53571731666
3376.74568505086
2621.99295542384
3252.91080880876
2399.18903609716
3102.46100920054
2683.63568096209
2786.70688634287
2168.32943522587
2145.69283422492
2443.42131258566
2535.91239430024
2038.15983130032
3043.61343638595
1188.1579255225
3678.56405574172
1316.49489557355
3825.29402153308
1453.58521019445
3961.74381759029
2106.83418525159
3495.84569084567
1778.63290245116


Parameters (Session):
par1 = FALSE ; par2 = 1 ; par3 = 0 ; par4 = 0 ; par5 = 12 ; par6 = 0 ; par7 = 1 ; par8 = 0 ; par9 = 1 ;
Parameters (R input):
par1 = FALSE ; par2 = 1 ; par3 = 0 ; par4 = 0 ; par5 = 12 ; par6 = 0 ; par7 = 1 ; par8 = 0 ; par9 = 1 ;
R code (references can be found in the software module):
par9 <- '0'
par8 <- '0'
par7 <- '0'
par6 <- '0'
par5 <- '12'
par4 <- '0'
par3 <- '0'
par2 <- '1'
par1 <- 'FALSE'
library(lattice)
if (par1 == 'TRUE') par1 <- TRUE
if (par1 == 'FALSE') par1 <- FALSE
par2 <- as.numeric(par2) #Box-Cox lambda transformation parameter
par3 <- as.numeric(par3) #degree of non-seasonal differencing
par4 <- as.numeric(par4) #degree of seasonal differencing
par5 <- as.numeric(par5) #seasonal period
par6 <- as.numeric(par6) #degree (p) of the non-seasonal AR(p) polynomial
par7 <- as.numeric(par7) #degree (q) of the non-seasonal MA(q) polynomial
par8 <- as.numeric(par8) #degree (P) of the seasonal AR(P) polynomial
par9 <- as.numeric(par9) #degree (Q) of the seasonal MA(Q) polynomial
armaGR <- function(arima.out, names, n){
try1 <- arima.out$coef
try2 <- sqrt(diag(arima.out$var.coef))
try.data.frame <- data.frame(matrix(NA,ncol=4,nrow=length(names)))
dimnames(try.data.frame) <- list(names,c('coef','std','tstat','pv'))
try.data.frame[,1] <- try1
for(i in 1:length(try2)) try.data.frame[which(rownames(try.data.frame)==names(try2)[i]),2] <- try2[i]
try.data.frame[,3] <- try.data.frame[,1] / try.data.frame[,2]
try.data.frame[,4] <- round((1-pt(abs(try.data.frame[,3]),df=n-(length(try2)+1)))*2,5)
vector <- rep(NA,length(names))
vector[is.na(try.data.frame[,4])] <- 0
maxi <- which.max(try.data.frame[,4])
continue <- max(try.data.frame[,4],na.rm=TRUE) > .05
vector[maxi] <- 0
list(summary=try.data.frame,next.vector=vector,continue=continue)
}
arimaSelect <- function(series, order=c(13,0,0), seasonal=list(order=c(2,0,0),period=12), include.mean=F){
nrc <- order[1]+order[3]+seasonal$order[1]+seasonal$order[3]
coeff <- matrix(NA, nrow=nrc*2, ncol=nrc)
pval <- matrix(NA, nrow=nrc*2, ncol=nrc)
mylist <- rep(list(NULL), nrc)
names <- NULL
if(order[1] > 0) names <- paste('ar',1:order[1],sep='')
if(order[3] > 0) names <- c( names , paste('ma',1:order[3],sep='') )
if(seasonal$order[1] > 0) names <- c(names, paste('sar',1:seasonal$order[1],sep=''))
if(seasonal$order[3] > 0) names <- c(names, paste('sma',1:seasonal$order[3],sep=''))
arima.out <- arima(series, order=order, seasonal=seasonal, include.mean=include.mean, method='ML')
mylist[[1]] <- arima.out
last.arma <- armaGR(arima.out, names, length(series))
mystop <- FALSE
i <- 1
coeff[i,] <- last.arma[[1]][,1]
pval [i,] <- last.arma[[1]][,4]
i <- 2
aic <- arima.out$aic
while(!mystop){
mylist[[i]] <- arima.out
arima.out <- arima(series, order=order, seasonal=seasonal, include.mean=include.mean, method='ML', fixed=last.arma$next.vector)
aic <- c(aic, arima.out$aic)
last.arma <- armaGR(arima.out, names, length(series))
mystop <- !last.arma$continue
coeff[i,] <- last.arma[[1]][,1]
pval [i,] <- last.arma[[1]][,4]
i <- i+1
}
list(coeff, pval, mylist, aic=aic)
}
arimaSelectplot <- function(arimaSelect.out,noms,choix){
noms <- names(arimaSelect.out[[3]][[1]]$coef)
coeff <- arimaSelect.out[[1]]
k <- min(which(is.na(coeff[,1])))-1
coeff <- coeff[1:k,]
pval <- arimaSelect.out[[2]][1:k,]
aic <- arimaSelect.out$aic[1:k]
coeff[coeff==0] <- NA
n <- ncol(coeff)
if(missing(choix)) choix <- k
layout(matrix(c(1,1,1,2,
3,3,3,2,
3,3,3,4,
5,6,7,7),nr=4),
widths=c(10,35,45,15),
heights=c(30,30,15,15))
couleurs <- rainbow(75)[1:50]#(50)
ticks <- pretty(coeff)
par(mar=c(1,1,3,1))
plot(aic,k:1-.5,type='o',pch=21,bg='blue',cex=2,axes=F,lty=2,xpd=NA)
points(aic[choix],k-choix+.5,pch=21,cex=4,bg=2,xpd=NA)
title('aic',line=2)
par(mar=c(3,0,0,0))
plot(0,axes=F,xlab='',ylab='',xlim=range(ticks),ylim=c(.1,1))
rect(xleft = min(ticks) + (0:49)/50*(max(ticks)-min(ticks)),
xright = min(ticks) + (1:50)/50*(max(ticks)-min(ticks)),
ytop = rep(1,50),
ybottom= rep(0,50),col=couleurs,border=NA)
axis(1,ticks)
rect(xleft=min(ticks),xright=max(ticks),ytop=1,ybottom=0)
text(mean(coeff,na.rm=T),.5,'coefficients',cex=2,font=2)
par(mar=c(1,1,3,1))
image(1:n,1:k,t(coeff[k:1,]),axes=F,col=couleurs,zlim=range(ticks))
for(i in 1:n) for(j in 1:k) if(!is.na(coeff[j,i])) {
if(pval[j,i]<.01) symb = 'green'
else if( (pval[j,i]<.05) & (pval[j,i]>=.01)) symb = 'orange'
else if( (pval[j,i]<.1) & (pval[j,i]>=.05)) symb = 'red'
else symb = 'black'
polygon(c(i+.5 ,i+.2 ,i+.5 ,i+.5),
c(k-j+0.5,k-j+0.5,k-j+0.8,k-j+0.5),
col=symb)
if(j==choix) {
rect(xleft=i-.5,
xright=i+.5,
ybottom=k-j+1.5,
ytop=k-j+.5,
lwd=4)
text(i,
k-j+1,
round(coeff[j,i],2),
cex=1.2,
font=2)
}
else{
rect(xleft=i-.5,xright=i+.5,ybottom=k-j+1.5,ytop=k-j+.5)
text(i,k-j+1,round(coeff[j,i],2),cex=1.2,font=1)
}
}
axis(3,1:n,noms)
par(mar=c(0.5,0,0,0.5))
plot(0,axes=F,xlab='',ylab='',type='n',xlim=c(0,8),ylim=c(-.2,.8))
cols <- c('green','orange','red','black')
niv <- c('0','0.01','0.05','0.1')
for(i in 0:3){
polygon(c(1+2*i ,1+2*i ,1+2*i-.5 ,1+2*i),
c(.4 ,.7 , .4 , .4),
col=cols[i+1])
text(2*i,0.5,niv[i+1],cex=1.5)
}
text(8,.5,1,cex=1.5)
text(4,0,'p-value',cex=2)
box()
residus <- arimaSelect.out[[3]][[choix]]$res
par(mar=c(1,2,4,1))
acf(residus,main='')
title('acf',line=.5)
par(mar=c(1,2,4,1))
pacf(residus,main='')
title('pacf',line=.5)
par(mar=c(2,2,4,1))
qqnorm(residus,main='')
title('qq-norm',line=.5)
qqline(residus)
residus
}
if (par2 == 0) x <- log(x)
if (par2 != 0) x <- x^par2
(selection <- arimaSelect(x, order=c(par6,par3,par7), seasonal=list(order=c(par8,par4,par9), period=par5)))
bitmap(file='test1.png')
resid <- arimaSelectplot(selection)
dev.off()
resid
bitmap(file='test2.png')
acf(resid,length(resid)/2, main='Residual Autocorrelation Function')
dev.off()
bitmap(file='test3.png')
pacf(resid,length(resid)/2, main='Residual Partial Autocorrelation Function')
dev.off()
bitmap(file='test4.png')
cpgram(resid, main='Residual Cumulative Periodogram')
dev.off()
bitmap(file='test5.png')
hist(resid, main='Residual Histogram', xlab='values of Residuals')
dev.off()
bitmap(file='test6.png')
densityplot(~resid,col='black',main='Residual Density Plot', xlab='values of Residuals')
dev.off()
bitmap(file='test7.png')
qqnorm(resid, main='Residual Normal Q-Q Plot')
qqline(resid)
dev.off()
ncols <- length(selection[[1]][1,])
nrows <- length(selection[[2]][,1])-1
load(file='createtable')
a<-table.start()
a<-table.row.start(a)
a<-table.element(a,'ARIMA Parameter Estimation and Backward Selection', ncols+1,TRUE)
a<-table.row.end(a)
a<-table.row.start(a)
a<-table.element(a,'Iteration', header=TRUE)
for (i in 1:ncols) {
a<-table.element(a,names(selection[[3]][[1]]$coef)[i],header=TRUE)
}
a<-table.row.end(a)
for (j in 1:nrows) {
a<-table.row.start(a)
mydum <- 'Estimates ('
mydum <- paste(mydum,j)
mydum <- paste(mydum,')')
a<-table.element(a,mydum, header=TRUE)
for (i in 1:ncols) {
a<-table.element(a,round(selection[[1]][j,i],4))
}
a<-table.row.end(a)
a<-table.row.start(a)
a<-table.element(a,'(p-val)', header=TRUE)
for (i in 1:ncols) {
mydum <- '('
mydum <- paste(mydum,round(selection[[2]][j,i],4),sep='')
mydum <- paste(mydum,')')
a<-table.element(a,mydum)
}
a<-table.row.end(a)
}
a<-table.end(a)
table.save(a,file='mytable.tab')
a<-table.start()
a<-table.row.start(a)
a<-table.element(a,'Estimated ARIMA Residuals', 1,TRUE)
a<-table.row.end(a)
a<-table.row.start(a)
a<-table.element(a,'Value', 1,TRUE)
a<-table.row.end(a)
for (i in (par4*par5+par3):length(resid)) {
a<-table.row.start(a)
a<-table.element(a,resid[i])
a<-table.row.end(a)
}
a<-table.end(a)
table.save(a,file='mytable1.tab')