Free Statistics

of Irreproducible Research!

Author's title

Author*The author of this computation has been verified*
R Software Modulerwasp_multipleregression.wasp
Title produced by softwareMultiple Regression
Date of computationTue, 09 Dec 2014 16:29:56 +0000
Cite this page as followsStatistical Computations at FreeStatistics.org, Office for Research Development and Education, URL https://freestatistics.org/blog/index.php?v=date/2014/Dec/09/t1418142626jtnf24zty7dmxi5.htm/, Retrieved Thu, 16 May 2024 05:42:19 +0000
Statistical Computations at FreeStatistics.org, Office for Research Development and Education, URL https://freestatistics.org/blog/index.php?pk=264745, Retrieved Thu, 16 May 2024 05:42:19 +0000
QR Codes:

Original text written by user:
IsPrivate?No (this computation is public)
User-defined keywords
Estimated Impact74
Family? (F = Feedback message, R = changed R code, M = changed R Module, P = changed Parameters, D = changed Data)
-       [Multiple Regression] [paper mr totaal] [2014-12-09 16:29:56] [ec1b40d1a9751af99658fe8fca4f9eca] [Current]
Feedback Forum

Post a new message
Dataseries X:
1 12.9
0 12.2
1 12.8
0 7.4
0 6.7
0 12.6
1 14.8
0 13.3
0 11.1
0 8.2
0 11.4
0 6.4
0 10.6
1 12
1 6.3
1 11.3
0 11.9
1 9.3
0 9.6
1 10
0 6.4
0 13.8
1 10.8
0 13.8
0 11.7
0 10.9
0 16.1
1 13.4
0 9.9
1 11.5
1 8.3
1 11.7
0 9
0 9.7
0 10.8
0 10.3
1 10.4
0 12.7
0 9.3
1 11.8
0 5.9
0 11.4
0 13
0 10.8
0 12.3
1 11.3
0 11.8
0 7.9
1 12.7
0 12.3
0 11.6
0 6.7
0 10.9
0 12.1
0 13.3
0 10.1
1 5.7
0 14.3
1 8
0 13.3
0 9.3
1 12.5
1 7.6
0 15.9
1 9.2
0 9.1
1 11.1
0 13
0 14.5
1 12.2
1 12.3
1 11.4
1 8.8
0 14.6
1 12.6
0 NA
1 13
0 12.6
1 13.2
1 9.9
0 7.7
1 10.5
1 13.4
1 10.9
0 4.3
1 10.3
0 11.8
0 11.2
1 11.4
1 8.6
1 13.2
0 12.6
0 5.6
0 9.9
1 8.8
0 7.7
1 9
0 7.3
0 11.4
0 13.6
0 7.9
0 10.7
1 10.3
0 8.3
0 9.6
0 14.2
1 8.5
1 13.5
1 4.9
1 6.4
1 9.6
1 11.6
0 11.1


Summary of computational transaction
Raw Inputview raw input (R code)
Raw Outputview raw output of R engine
Computing time5 seconds
R Server'Sir Ronald Aylmer Fisher' @ fisher.wessa.net

\begin{tabular}{lllllllll}
\hline
Summary of computational transaction \tabularnewline
Raw Input & view raw input (R code)  \tabularnewline
Raw Output & view raw output of R engine  \tabularnewline
Computing time & 5 seconds \tabularnewline
R Server & 'Sir Ronald Aylmer Fisher' @ fisher.wessa.net \tabularnewline
\hline
\end{tabular}
%Source: https://freestatistics.org/blog/index.php?pk=264745&T=0

[TABLE]
[ROW][C]Summary of computational transaction[/C][/ROW]
[ROW][C]Raw Input[/C][C]view raw input (R code) [/C][/ROW]
[ROW][C]Raw Output[/C][C]view raw output of R engine [/C][/ROW]
[ROW][C]Computing time[/C][C]5 seconds[/C][/ROW]
[ROW][C]R Server[/C][C]'Sir Ronald Aylmer Fisher' @ fisher.wessa.net[/C][/ROW]
[/TABLE]
Source: https://freestatistics.org/blog/index.php?pk=264745&T=0

Globally Unique Identifier (entire table): ba.freestatistics.org/blog/index.php?pk=264745&T=0

As an alternative you can also use a QR Code:  

The GUIDs for individual cells are displayed in the table below:

Summary of computational transaction
Raw Inputview raw input (R code)
Raw Outputview raw output of R engine
Computing time5 seconds
R Server'Sir Ronald Aylmer Fisher' @ fisher.wessa.net


Multiple Linear Regression - Estimated Regression Equation
gender[t] = + 0.461493 -0.00391551TOT[t] + e[t]

\begin{tabular}{lllllllll}
\hline
Multiple Linear Regression - Estimated Regression Equation \tabularnewline
gender[t] =  +  0.461493 -0.00391551TOT[t]  + e[t] \tabularnewline
\hline
\end{tabular}
%Source: https://freestatistics.org/blog/index.php?pk=264745&T=1

[TABLE]
[ROW][C]Multiple Linear Regression - Estimated Regression Equation[/C][/ROW]
[ROW][C]gender[t] =  +  0.461493 -0.00391551TOT[t]  + e[t][/C][/ROW]
[/TABLE]
Source: https://freestatistics.org/blog/index.php?pk=264745&T=1

Globally Unique Identifier (entire table): ba.freestatistics.org/blog/index.php?pk=264745&T=1

As an alternative you can also use a QR Code:  

The GUIDs for individual cells are displayed in the table below:

Multiple Linear Regression - Estimated Regression Equation
gender[t] = + 0.461493 -0.00391551TOT[t] + e[t]


Multiple Linear Regression - Ordinary Least Squares
VariableParameterS.D.T-STATH0: parameter = 02-tail p-value1-tail p-value
(Intercept)0.4614930.2097232.20.02986260.0149313
TOT-0.003915510.0191216-0.20480.8381310.419065

\begin{tabular}{lllllllll}
\hline
Multiple Linear Regression - Ordinary Least Squares \tabularnewline
Variable & Parameter & S.D. & T-STATH0: parameter = 0 & 2-tail p-value & 1-tail p-value \tabularnewline
(Intercept) & 0.461493 & 0.209723 & 2.2 & 0.0298626 & 0.0149313 \tabularnewline
TOT & -0.00391551 & 0.0191216 & -0.2048 & 0.838131 & 0.419065 \tabularnewline
\hline
\end{tabular}
%Source: https://freestatistics.org/blog/index.php?pk=264745&T=2

[TABLE]
[ROW][C]Multiple Linear Regression - Ordinary Least Squares[/C][/ROW]
[ROW][C]Variable[/C][C]Parameter[/C][C]S.D.[/C][C]T-STATH0: parameter = 0[/C][C]2-tail p-value[/C][C]1-tail p-value[/C][/ROW]
[ROW][C](Intercept)[/C][C]0.461493[/C][C]0.209723[/C][C]2.2[/C][C]0.0298626[/C][C]0.0149313[/C][/ROW]
[ROW][C]TOT[/C][C]-0.00391551[/C][C]0.0191216[/C][C]-0.2048[/C][C]0.838131[/C][C]0.419065[/C][/ROW]
[/TABLE]
Source: https://freestatistics.org/blog/index.php?pk=264745&T=2

Globally Unique Identifier (entire table): ba.freestatistics.org/blog/index.php?pk=264745&T=2

As an alternative you can also use a QR Code:  

The GUIDs for individual cells are displayed in the table below:

Multiple Linear Regression - Ordinary Least Squares
VariableParameterS.D.T-STATH0: parameter = 02-tail p-value1-tail p-value
(Intercept)0.4614930.2097232.20.02986260.0149313
TOT-0.003915510.0191216-0.20480.8381310.419065


Multiple Linear Regression - Regression Statistics
Multiple R0.0195203
R-squared0.000381042
Adjusted R-squared-0.0087064
F-TEST (value)0.0419306
F-TEST (DF numerator)1
F-TEST (DF denominator)110
p-value0.838131
Multiple Linear Regression - Residual Statistics
Residual Standard Deviation0.497872
Sum Squared Residuals27.2664

\begin{tabular}{lllllllll}
\hline
Multiple Linear Regression - Regression Statistics \tabularnewline
Multiple R & 0.0195203 \tabularnewline
R-squared & 0.000381042 \tabularnewline
Adjusted R-squared & -0.0087064 \tabularnewline
F-TEST (value) & 0.0419306 \tabularnewline
F-TEST (DF numerator) & 1 \tabularnewline
F-TEST (DF denominator) & 110 \tabularnewline
p-value & 0.838131 \tabularnewline
Multiple Linear Regression - Residual Statistics \tabularnewline
Residual Standard Deviation & 0.497872 \tabularnewline
Sum Squared Residuals & 27.2664 \tabularnewline
\hline
\end{tabular}
%Source: https://freestatistics.org/blog/index.php?pk=264745&T=3

[TABLE]
[ROW][C]Multiple Linear Regression - Regression Statistics[/C][/ROW]
[ROW][C]Multiple R[/C][C]0.0195203[/C][/ROW]
[ROW][C]R-squared[/C][C]0.000381042[/C][/ROW]
[ROW][C]Adjusted R-squared[/C][C]-0.0087064[/C][/ROW]
[ROW][C]F-TEST (value)[/C][C]0.0419306[/C][/ROW]
[ROW][C]F-TEST (DF numerator)[/C][C]1[/C][/ROW]
[ROW][C]F-TEST (DF denominator)[/C][C]110[/C][/ROW]
[ROW][C]p-value[/C][C]0.838131[/C][/ROW]
[ROW][C]Multiple Linear Regression - Residual Statistics[/C][/ROW]
[ROW][C]Residual Standard Deviation[/C][C]0.497872[/C][/ROW]
[ROW][C]Sum Squared Residuals[/C][C]27.2664[/C][/ROW]
[/TABLE]
Source: https://freestatistics.org/blog/index.php?pk=264745&T=3

Globally Unique Identifier (entire table): ba.freestatistics.org/blog/index.php?pk=264745&T=3

As an alternative you can also use a QR Code:  

The GUIDs for individual cells are displayed in the table below:

Multiple Linear Regression - Regression Statistics
Multiple R0.0195203
R-squared0.000381042
Adjusted R-squared-0.0087064
F-TEST (value)0.0419306
F-TEST (DF numerator)1
F-TEST (DF denominator)110
p-value0.838131
Multiple Linear Regression - Residual Statistics
Residual Standard Deviation0.497872
Sum Squared Residuals27.2664


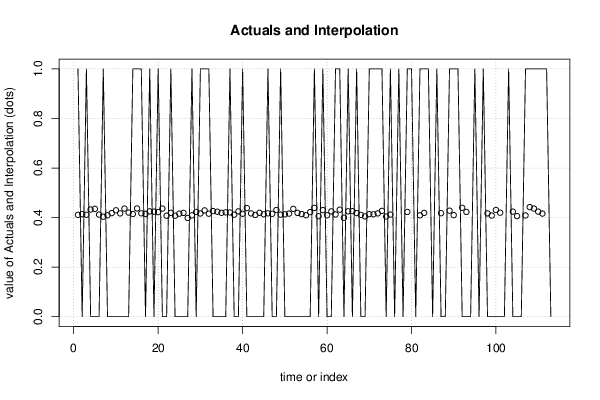
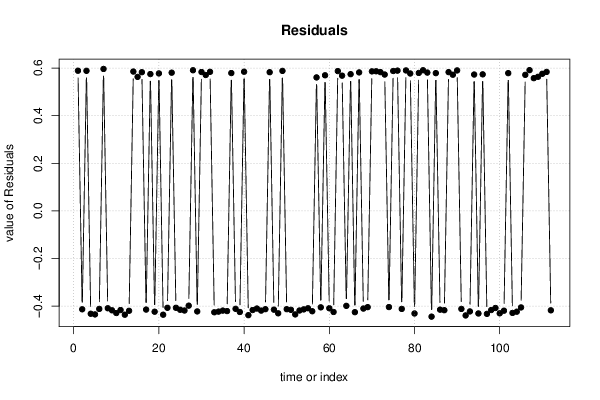
Multiple Linear Regression - Actuals, Interpolation, and Residuals
Time or IndexActualsInterpolationForecastResidualsPrediction Error
110.4109830.589017
200.413724-0.413724
310.4113750.588625
400.432519-0.432519
500.435259-0.435259
600.412158-0.412158
710.4035440.596456
800.409417-0.409417
900.418031-0.418031
1000.429386-0.429386
1100.416857-0.416857
1200.436434-0.436434
1300.419989-0.419989
1410.4145070.585493
1510.4368260.563174
1610.4172480.582752
1700.414899-0.414899
1810.4250790.574921
1900.423904-0.423904
2010.4223380.577662
2100.436434-0.436434
2200.407459-0.407459
2310.4192060.580794
2400.407459-0.407459
2500.415682-0.415682
2600.418814-0.418814
2700.398454-0.398454
2810.4090260.590974
2900.42273-0.42273
3010.4164650.583535
3110.4289950.571005
3210.4156820.584318
3300.426254-0.426254
3400.423513-0.423513
3500.419206-0.419206
3600.421164-0.421164
3710.4207720.579228
3800.411766-0.411766
3900.425079-0.425079
4010.415290.58471
4100.438392-0.438392
4200.416857-0.416857
4300.410592-0.410592
4400.419206-0.419206
4500.413333-0.413333
4610.4172480.582752
4700.41529-0.41529
4800.430561-0.430561
4910.4117660.588234
5000.413333-0.413333
5100.416073-0.416073
5200.435259-0.435259
5300.418814-0.418814
5400.414116-0.414116
5500.409417-0.409417
5600.421947-0.421947
5710.4391750.560825
5800.405502-0.405502
5910.4301690.569831
6000.409417-0.409417
6100.425079-0.425079
6210.4125490.587451
6310.4317360.568264
6400.399237-0.399237
6510.4254710.574529
6600.425862-0.425862
6710.4180310.581969
6800.410592-0.410592
6900.404718-0.404718
7010.4137240.586276
7110.4133330.586667
7210.4168570.583143
7310.4270370.572963
7400.404327-0.404327
7510.4121580.587842
760-0.5894080.589408
7711.41216-0.412158
780-0.5901910.590191
7910.422730.57727
8011.43134-0.431344
810-0.5796190.579619
8210.4090260.590974
8310.4188140.581186
8411.44466-0.444657
850-0.5788360.578836
8611.41529-0.41529
8700.41764-0.41764
880-0.5831430.583143
8910.427820.57218
9010.4098090.590191
9111.41216-0.412158
9200.439567-0.439567
9300.42273-0.42273
940-0.5729630.572963
9511.43134-0.431344
960-0.5737460.573746
9711.43291-0.43291
9800.416857-0.416857
9900.408242-0.408242
10000.430561-0.430561
10100.419597-0.419597
1020-0.5788360.578836
10311.42899-0.428995
10400.423904-0.423904
10500.405893-0.405893
1060-0.5717880.571788
10710.4086340.591366
10810.4423070.557693
10910.4364340.563566
11010.4239040.576096
11110.4160730.583927
11211.41803-0.418031
1130NANA

\begin{tabular}{lllllllll}
\hline
Multiple Linear Regression - Actuals, Interpolation, and Residuals \tabularnewline
Time or Index & Actuals & InterpolationForecast & ResidualsPrediction Error \tabularnewline
1 & 1 & 0.410983 & 0.589017 \tabularnewline
2 & 0 & 0.413724 & -0.413724 \tabularnewline
3 & 1 & 0.411375 & 0.588625 \tabularnewline
4 & 0 & 0.432519 & -0.432519 \tabularnewline
5 & 0 & 0.435259 & -0.435259 \tabularnewline
6 & 0 & 0.412158 & -0.412158 \tabularnewline
7 & 1 & 0.403544 & 0.596456 \tabularnewline
8 & 0 & 0.409417 & -0.409417 \tabularnewline
9 & 0 & 0.418031 & -0.418031 \tabularnewline
10 & 0 & 0.429386 & -0.429386 \tabularnewline
11 & 0 & 0.416857 & -0.416857 \tabularnewline
12 & 0 & 0.436434 & -0.436434 \tabularnewline
13 & 0 & 0.419989 & -0.419989 \tabularnewline
14 & 1 & 0.414507 & 0.585493 \tabularnewline
15 & 1 & 0.436826 & 0.563174 \tabularnewline
16 & 1 & 0.417248 & 0.582752 \tabularnewline
17 & 0 & 0.414899 & -0.414899 \tabularnewline
18 & 1 & 0.425079 & 0.574921 \tabularnewline
19 & 0 & 0.423904 & -0.423904 \tabularnewline
20 & 1 & 0.422338 & 0.577662 \tabularnewline
21 & 0 & 0.436434 & -0.436434 \tabularnewline
22 & 0 & 0.407459 & -0.407459 \tabularnewline
23 & 1 & 0.419206 & 0.580794 \tabularnewline
24 & 0 & 0.407459 & -0.407459 \tabularnewline
25 & 0 & 0.415682 & -0.415682 \tabularnewline
26 & 0 & 0.418814 & -0.418814 \tabularnewline
27 & 0 & 0.398454 & -0.398454 \tabularnewline
28 & 1 & 0.409026 & 0.590974 \tabularnewline
29 & 0 & 0.42273 & -0.42273 \tabularnewline
30 & 1 & 0.416465 & 0.583535 \tabularnewline
31 & 1 & 0.428995 & 0.571005 \tabularnewline
32 & 1 & 0.415682 & 0.584318 \tabularnewline
33 & 0 & 0.426254 & -0.426254 \tabularnewline
34 & 0 & 0.423513 & -0.423513 \tabularnewline
35 & 0 & 0.419206 & -0.419206 \tabularnewline
36 & 0 & 0.421164 & -0.421164 \tabularnewline
37 & 1 & 0.420772 & 0.579228 \tabularnewline
38 & 0 & 0.411766 & -0.411766 \tabularnewline
39 & 0 & 0.425079 & -0.425079 \tabularnewline
40 & 1 & 0.41529 & 0.58471 \tabularnewline
41 & 0 & 0.438392 & -0.438392 \tabularnewline
42 & 0 & 0.416857 & -0.416857 \tabularnewline
43 & 0 & 0.410592 & -0.410592 \tabularnewline
44 & 0 & 0.419206 & -0.419206 \tabularnewline
45 & 0 & 0.413333 & -0.413333 \tabularnewline
46 & 1 & 0.417248 & 0.582752 \tabularnewline
47 & 0 & 0.41529 & -0.41529 \tabularnewline
48 & 0 & 0.430561 & -0.430561 \tabularnewline
49 & 1 & 0.411766 & 0.588234 \tabularnewline
50 & 0 & 0.413333 & -0.413333 \tabularnewline
51 & 0 & 0.416073 & -0.416073 \tabularnewline
52 & 0 & 0.435259 & -0.435259 \tabularnewline
53 & 0 & 0.418814 & -0.418814 \tabularnewline
54 & 0 & 0.414116 & -0.414116 \tabularnewline
55 & 0 & 0.409417 & -0.409417 \tabularnewline
56 & 0 & 0.421947 & -0.421947 \tabularnewline
57 & 1 & 0.439175 & 0.560825 \tabularnewline
58 & 0 & 0.405502 & -0.405502 \tabularnewline
59 & 1 & 0.430169 & 0.569831 \tabularnewline
60 & 0 & 0.409417 & -0.409417 \tabularnewline
61 & 0 & 0.425079 & -0.425079 \tabularnewline
62 & 1 & 0.412549 & 0.587451 \tabularnewline
63 & 1 & 0.431736 & 0.568264 \tabularnewline
64 & 0 & 0.399237 & -0.399237 \tabularnewline
65 & 1 & 0.425471 & 0.574529 \tabularnewline
66 & 0 & 0.425862 & -0.425862 \tabularnewline
67 & 1 & 0.418031 & 0.581969 \tabularnewline
68 & 0 & 0.410592 & -0.410592 \tabularnewline
69 & 0 & 0.404718 & -0.404718 \tabularnewline
70 & 1 & 0.413724 & 0.586276 \tabularnewline
71 & 1 & 0.413333 & 0.586667 \tabularnewline
72 & 1 & 0.416857 & 0.583143 \tabularnewline
73 & 1 & 0.427037 & 0.572963 \tabularnewline
74 & 0 & 0.404327 & -0.404327 \tabularnewline
75 & 1 & 0.412158 & 0.587842 \tabularnewline
76 & 0 & -0.589408 & 0.589408 \tabularnewline
77 & 1 & 1.41216 & -0.412158 \tabularnewline
78 & 0 & -0.590191 & 0.590191 \tabularnewline
79 & 1 & 0.42273 & 0.57727 \tabularnewline
80 & 1 & 1.43134 & -0.431344 \tabularnewline
81 & 0 & -0.579619 & 0.579619 \tabularnewline
82 & 1 & 0.409026 & 0.590974 \tabularnewline
83 & 1 & 0.418814 & 0.581186 \tabularnewline
84 & 1 & 1.44466 & -0.444657 \tabularnewline
85 & 0 & -0.578836 & 0.578836 \tabularnewline
86 & 1 & 1.41529 & -0.41529 \tabularnewline
87 & 0 & 0.41764 & -0.41764 \tabularnewline
88 & 0 & -0.583143 & 0.583143 \tabularnewline
89 & 1 & 0.42782 & 0.57218 \tabularnewline
90 & 1 & 0.409809 & 0.590191 \tabularnewline
91 & 1 & 1.41216 & -0.412158 \tabularnewline
92 & 0 & 0.439567 & -0.439567 \tabularnewline
93 & 0 & 0.42273 & -0.42273 \tabularnewline
94 & 0 & -0.572963 & 0.572963 \tabularnewline
95 & 1 & 1.43134 & -0.431344 \tabularnewline
96 & 0 & -0.573746 & 0.573746 \tabularnewline
97 & 1 & 1.43291 & -0.43291 \tabularnewline
98 & 0 & 0.416857 & -0.416857 \tabularnewline
99 & 0 & 0.408242 & -0.408242 \tabularnewline
100 & 0 & 0.430561 & -0.430561 \tabularnewline
101 & 0 & 0.419597 & -0.419597 \tabularnewline
102 & 0 & -0.578836 & 0.578836 \tabularnewline
103 & 1 & 1.42899 & -0.428995 \tabularnewline
104 & 0 & 0.423904 & -0.423904 \tabularnewline
105 & 0 & 0.405893 & -0.405893 \tabularnewline
106 & 0 & -0.571788 & 0.571788 \tabularnewline
107 & 1 & 0.408634 & 0.591366 \tabularnewline
108 & 1 & 0.442307 & 0.557693 \tabularnewline
109 & 1 & 0.436434 & 0.563566 \tabularnewline
110 & 1 & 0.423904 & 0.576096 \tabularnewline
111 & 1 & 0.416073 & 0.583927 \tabularnewline
112 & 1 & 1.41803 & -0.418031 \tabularnewline
113 & 0 & NA & NA \tabularnewline
\hline
\end{tabular}
%Source: https://freestatistics.org/blog/index.php?pk=264745&T=4

[TABLE]
[ROW][C]Multiple Linear Regression - Actuals, Interpolation, and Residuals[/C][/ROW]
[ROW][C]Time or Index[/C][C]Actuals[/C][C]InterpolationForecast[/C][C]ResidualsPrediction Error[/C][/ROW]
[ROW][C]1[/C][C]1[/C][C]0.410983[/C][C]0.589017[/C][/ROW]
[ROW][C]2[/C][C]0[/C][C]0.413724[/C][C]-0.413724[/C][/ROW]
[ROW][C]3[/C][C]1[/C][C]0.411375[/C][C]0.588625[/C][/ROW]
[ROW][C]4[/C][C]0[/C][C]0.432519[/C][C]-0.432519[/C][/ROW]
[ROW][C]5[/C][C]0[/C][C]0.435259[/C][C]-0.435259[/C][/ROW]
[ROW][C]6[/C][C]0[/C][C]0.412158[/C][C]-0.412158[/C][/ROW]
[ROW][C]7[/C][C]1[/C][C]0.403544[/C][C]0.596456[/C][/ROW]
[ROW][C]8[/C][C]0[/C][C]0.409417[/C][C]-0.409417[/C][/ROW]
[ROW][C]9[/C][C]0[/C][C]0.418031[/C][C]-0.418031[/C][/ROW]
[ROW][C]10[/C][C]0[/C][C]0.429386[/C][C]-0.429386[/C][/ROW]
[ROW][C]11[/C][C]0[/C][C]0.416857[/C][C]-0.416857[/C][/ROW]
[ROW][C]12[/C][C]0[/C][C]0.436434[/C][C]-0.436434[/C][/ROW]
[ROW][C]13[/C][C]0[/C][C]0.419989[/C][C]-0.419989[/C][/ROW]
[ROW][C]14[/C][C]1[/C][C]0.414507[/C][C]0.585493[/C][/ROW]
[ROW][C]15[/C][C]1[/C][C]0.436826[/C][C]0.563174[/C][/ROW]
[ROW][C]16[/C][C]1[/C][C]0.417248[/C][C]0.582752[/C][/ROW]
[ROW][C]17[/C][C]0[/C][C]0.414899[/C][C]-0.414899[/C][/ROW]
[ROW][C]18[/C][C]1[/C][C]0.425079[/C][C]0.574921[/C][/ROW]
[ROW][C]19[/C][C]0[/C][C]0.423904[/C][C]-0.423904[/C][/ROW]
[ROW][C]20[/C][C]1[/C][C]0.422338[/C][C]0.577662[/C][/ROW]
[ROW][C]21[/C][C]0[/C][C]0.436434[/C][C]-0.436434[/C][/ROW]
[ROW][C]22[/C][C]0[/C][C]0.407459[/C][C]-0.407459[/C][/ROW]
[ROW][C]23[/C][C]1[/C][C]0.419206[/C][C]0.580794[/C][/ROW]
[ROW][C]24[/C][C]0[/C][C]0.407459[/C][C]-0.407459[/C][/ROW]
[ROW][C]25[/C][C]0[/C][C]0.415682[/C][C]-0.415682[/C][/ROW]
[ROW][C]26[/C][C]0[/C][C]0.418814[/C][C]-0.418814[/C][/ROW]
[ROW][C]27[/C][C]0[/C][C]0.398454[/C][C]-0.398454[/C][/ROW]
[ROW][C]28[/C][C]1[/C][C]0.409026[/C][C]0.590974[/C][/ROW]
[ROW][C]29[/C][C]0[/C][C]0.42273[/C][C]-0.42273[/C][/ROW]
[ROW][C]30[/C][C]1[/C][C]0.416465[/C][C]0.583535[/C][/ROW]
[ROW][C]31[/C][C]1[/C][C]0.428995[/C][C]0.571005[/C][/ROW]
[ROW][C]32[/C][C]1[/C][C]0.415682[/C][C]0.584318[/C][/ROW]
[ROW][C]33[/C][C]0[/C][C]0.426254[/C][C]-0.426254[/C][/ROW]
[ROW][C]34[/C][C]0[/C][C]0.423513[/C][C]-0.423513[/C][/ROW]
[ROW][C]35[/C][C]0[/C][C]0.419206[/C][C]-0.419206[/C][/ROW]
[ROW][C]36[/C][C]0[/C][C]0.421164[/C][C]-0.421164[/C][/ROW]
[ROW][C]37[/C][C]1[/C][C]0.420772[/C][C]0.579228[/C][/ROW]
[ROW][C]38[/C][C]0[/C][C]0.411766[/C][C]-0.411766[/C][/ROW]
[ROW][C]39[/C][C]0[/C][C]0.425079[/C][C]-0.425079[/C][/ROW]
[ROW][C]40[/C][C]1[/C][C]0.41529[/C][C]0.58471[/C][/ROW]
[ROW][C]41[/C][C]0[/C][C]0.438392[/C][C]-0.438392[/C][/ROW]
[ROW][C]42[/C][C]0[/C][C]0.416857[/C][C]-0.416857[/C][/ROW]
[ROW][C]43[/C][C]0[/C][C]0.410592[/C][C]-0.410592[/C][/ROW]
[ROW][C]44[/C][C]0[/C][C]0.419206[/C][C]-0.419206[/C][/ROW]
[ROW][C]45[/C][C]0[/C][C]0.413333[/C][C]-0.413333[/C][/ROW]
[ROW][C]46[/C][C]1[/C][C]0.417248[/C][C]0.582752[/C][/ROW]
[ROW][C]47[/C][C]0[/C][C]0.41529[/C][C]-0.41529[/C][/ROW]
[ROW][C]48[/C][C]0[/C][C]0.430561[/C][C]-0.430561[/C][/ROW]
[ROW][C]49[/C][C]1[/C][C]0.411766[/C][C]0.588234[/C][/ROW]
[ROW][C]50[/C][C]0[/C][C]0.413333[/C][C]-0.413333[/C][/ROW]
[ROW][C]51[/C][C]0[/C][C]0.416073[/C][C]-0.416073[/C][/ROW]
[ROW][C]52[/C][C]0[/C][C]0.435259[/C][C]-0.435259[/C][/ROW]
[ROW][C]53[/C][C]0[/C][C]0.418814[/C][C]-0.418814[/C][/ROW]
[ROW][C]54[/C][C]0[/C][C]0.414116[/C][C]-0.414116[/C][/ROW]
[ROW][C]55[/C][C]0[/C][C]0.409417[/C][C]-0.409417[/C][/ROW]
[ROW][C]56[/C][C]0[/C][C]0.421947[/C][C]-0.421947[/C][/ROW]
[ROW][C]57[/C][C]1[/C][C]0.439175[/C][C]0.560825[/C][/ROW]
[ROW][C]58[/C][C]0[/C][C]0.405502[/C][C]-0.405502[/C][/ROW]
[ROW][C]59[/C][C]1[/C][C]0.430169[/C][C]0.569831[/C][/ROW]
[ROW][C]60[/C][C]0[/C][C]0.409417[/C][C]-0.409417[/C][/ROW]
[ROW][C]61[/C][C]0[/C][C]0.425079[/C][C]-0.425079[/C][/ROW]
[ROW][C]62[/C][C]1[/C][C]0.412549[/C][C]0.587451[/C][/ROW]
[ROW][C]63[/C][C]1[/C][C]0.431736[/C][C]0.568264[/C][/ROW]
[ROW][C]64[/C][C]0[/C][C]0.399237[/C][C]-0.399237[/C][/ROW]
[ROW][C]65[/C][C]1[/C][C]0.425471[/C][C]0.574529[/C][/ROW]
[ROW][C]66[/C][C]0[/C][C]0.425862[/C][C]-0.425862[/C][/ROW]
[ROW][C]67[/C][C]1[/C][C]0.418031[/C][C]0.581969[/C][/ROW]
[ROW][C]68[/C][C]0[/C][C]0.410592[/C][C]-0.410592[/C][/ROW]
[ROW][C]69[/C][C]0[/C][C]0.404718[/C][C]-0.404718[/C][/ROW]
[ROW][C]70[/C][C]1[/C][C]0.413724[/C][C]0.586276[/C][/ROW]
[ROW][C]71[/C][C]1[/C][C]0.413333[/C][C]0.586667[/C][/ROW]
[ROW][C]72[/C][C]1[/C][C]0.416857[/C][C]0.583143[/C][/ROW]
[ROW][C]73[/C][C]1[/C][C]0.427037[/C][C]0.572963[/C][/ROW]
[ROW][C]74[/C][C]0[/C][C]0.404327[/C][C]-0.404327[/C][/ROW]
[ROW][C]75[/C][C]1[/C][C]0.412158[/C][C]0.587842[/C][/ROW]
[ROW][C]76[/C][C]0[/C][C]-0.589408[/C][C]0.589408[/C][/ROW]
[ROW][C]77[/C][C]1[/C][C]1.41216[/C][C]-0.412158[/C][/ROW]
[ROW][C]78[/C][C]0[/C][C]-0.590191[/C][C]0.590191[/C][/ROW]
[ROW][C]79[/C][C]1[/C][C]0.42273[/C][C]0.57727[/C][/ROW]
[ROW][C]80[/C][C]1[/C][C]1.43134[/C][C]-0.431344[/C][/ROW]
[ROW][C]81[/C][C]0[/C][C]-0.579619[/C][C]0.579619[/C][/ROW]
[ROW][C]82[/C][C]1[/C][C]0.409026[/C][C]0.590974[/C][/ROW]
[ROW][C]83[/C][C]1[/C][C]0.418814[/C][C]0.581186[/C][/ROW]
[ROW][C]84[/C][C]1[/C][C]1.44466[/C][C]-0.444657[/C][/ROW]
[ROW][C]85[/C][C]0[/C][C]-0.578836[/C][C]0.578836[/C][/ROW]
[ROW][C]86[/C][C]1[/C][C]1.41529[/C][C]-0.41529[/C][/ROW]
[ROW][C]87[/C][C]0[/C][C]0.41764[/C][C]-0.41764[/C][/ROW]
[ROW][C]88[/C][C]0[/C][C]-0.583143[/C][C]0.583143[/C][/ROW]
[ROW][C]89[/C][C]1[/C][C]0.42782[/C][C]0.57218[/C][/ROW]
[ROW][C]90[/C][C]1[/C][C]0.409809[/C][C]0.590191[/C][/ROW]
[ROW][C]91[/C][C]1[/C][C]1.41216[/C][C]-0.412158[/C][/ROW]
[ROW][C]92[/C][C]0[/C][C]0.439567[/C][C]-0.439567[/C][/ROW]
[ROW][C]93[/C][C]0[/C][C]0.42273[/C][C]-0.42273[/C][/ROW]
[ROW][C]94[/C][C]0[/C][C]-0.572963[/C][C]0.572963[/C][/ROW]
[ROW][C]95[/C][C]1[/C][C]1.43134[/C][C]-0.431344[/C][/ROW]
[ROW][C]96[/C][C]0[/C][C]-0.573746[/C][C]0.573746[/C][/ROW]
[ROW][C]97[/C][C]1[/C][C]1.43291[/C][C]-0.43291[/C][/ROW]
[ROW][C]98[/C][C]0[/C][C]0.416857[/C][C]-0.416857[/C][/ROW]
[ROW][C]99[/C][C]0[/C][C]0.408242[/C][C]-0.408242[/C][/ROW]
[ROW][C]100[/C][C]0[/C][C]0.430561[/C][C]-0.430561[/C][/ROW]
[ROW][C]101[/C][C]0[/C][C]0.419597[/C][C]-0.419597[/C][/ROW]
[ROW][C]102[/C][C]0[/C][C]-0.578836[/C][C]0.578836[/C][/ROW]
[ROW][C]103[/C][C]1[/C][C]1.42899[/C][C]-0.428995[/C][/ROW]
[ROW][C]104[/C][C]0[/C][C]0.423904[/C][C]-0.423904[/C][/ROW]
[ROW][C]105[/C][C]0[/C][C]0.405893[/C][C]-0.405893[/C][/ROW]
[ROW][C]106[/C][C]0[/C][C]-0.571788[/C][C]0.571788[/C][/ROW]
[ROW][C]107[/C][C]1[/C][C]0.408634[/C][C]0.591366[/C][/ROW]
[ROW][C]108[/C][C]1[/C][C]0.442307[/C][C]0.557693[/C][/ROW]
[ROW][C]109[/C][C]1[/C][C]0.436434[/C][C]0.563566[/C][/ROW]
[ROW][C]110[/C][C]1[/C][C]0.423904[/C][C]0.576096[/C][/ROW]
[ROW][C]111[/C][C]1[/C][C]0.416073[/C][C]0.583927[/C][/ROW]
[ROW][C]112[/C][C]1[/C][C]1.41803[/C][C]-0.418031[/C][/ROW]
[ROW][C]113[/C][C]0[/C][C]NA[/C][C]NA[/C][/ROW]
[/TABLE]
Source: https://freestatistics.org/blog/index.php?pk=264745&T=4

Globally Unique Identifier (entire table): ba.freestatistics.org/blog/index.php?pk=264745&T=4

As an alternative you can also use a QR Code:  

The GUIDs for individual cells are displayed in the table below:

Multiple Linear Regression - Actuals, Interpolation, and Residuals
Time or IndexActualsInterpolationForecastResidualsPrediction Error
110.4109830.589017
200.413724-0.413724
310.4113750.588625
400.432519-0.432519
500.435259-0.435259
600.412158-0.412158
710.4035440.596456
800.409417-0.409417
900.418031-0.418031
1000.429386-0.429386
1100.416857-0.416857
1200.436434-0.436434
1300.419989-0.419989
1410.4145070.585493
1510.4368260.563174
1610.4172480.582752
1700.414899-0.414899
1810.4250790.574921
1900.423904-0.423904
2010.4223380.577662
2100.436434-0.436434
2200.407459-0.407459
2310.4192060.580794
2400.407459-0.407459
2500.415682-0.415682
2600.418814-0.418814
2700.398454-0.398454
2810.4090260.590974
2900.42273-0.42273
3010.4164650.583535
3110.4289950.571005
3210.4156820.584318
3300.426254-0.426254
3400.423513-0.423513
3500.419206-0.419206
3600.421164-0.421164
3710.4207720.579228
3800.411766-0.411766
3900.425079-0.425079
4010.415290.58471
4100.438392-0.438392
4200.416857-0.416857
4300.410592-0.410592
4400.419206-0.419206
4500.413333-0.413333
4610.4172480.582752
4700.41529-0.41529
4800.430561-0.430561
4910.4117660.588234
5000.413333-0.413333
5100.416073-0.416073
5200.435259-0.435259
5300.418814-0.418814
5400.414116-0.414116
5500.409417-0.409417
5600.421947-0.421947
5710.4391750.560825
5800.405502-0.405502
5910.4301690.569831
6000.409417-0.409417
6100.425079-0.425079
6210.4125490.587451
6310.4317360.568264
6400.399237-0.399237
6510.4254710.574529
6600.425862-0.425862
6710.4180310.581969
6800.410592-0.410592
6900.404718-0.404718
7010.4137240.586276
7110.4133330.586667
7210.4168570.583143
7310.4270370.572963
7400.404327-0.404327
7510.4121580.587842
760-0.5894080.589408
7711.41216-0.412158
780-0.5901910.590191
7910.422730.57727
8011.43134-0.431344
810-0.5796190.579619
8210.4090260.590974
8310.4188140.581186
8411.44466-0.444657
850-0.5788360.578836
8611.41529-0.41529
8700.41764-0.41764
880-0.5831430.583143
8910.427820.57218
9010.4098090.590191
9111.41216-0.412158
9200.439567-0.439567
9300.42273-0.42273
940-0.5729630.572963
9511.43134-0.431344
960-0.5737460.573746
9711.43291-0.43291
9800.416857-0.416857
9900.408242-0.408242
10000.430561-0.430561
10100.419597-0.419597
1020-0.5788360.578836
10311.42899-0.428995
10400.423904-0.423904
10500.405893-0.405893
1060-0.5717880.571788
10710.4086340.591366
10810.4423070.557693
10910.4364340.563566
11010.4239040.576096
11110.4160730.583927
11211.41803-0.418031
1130NANA


Goldfeld-Quandt test for Heteroskedasticity
p-valuesAlternative Hypothesis
breakpoint indexgreater2-sidedless
50.4832260.9664510.516774
60.5481130.9037750.451887
70.4351550.870310.564845
80.4929180.9858360.507082
90.4215860.8431710.578414
100.3183460.6366920.681654
110.2668840.5337670.733116
120.202750.40550.79725
130.156170.312340.84383
140.2189310.4378620.781069
150.476930.953860.52307
160.5156920.9686160.484308
170.4937110.9874210.506289
180.5564680.8870640.443532
190.5173230.9653550.482677
200.5581860.8836280.441814
210.5069940.9860110.493006
220.5057560.9884880.494244
230.5365270.9269460.463473
240.5275840.9448320.472416
250.5026360.9947290.497364
260.4733830.9467660.526617
270.4550310.9100620.544969
280.4860010.9720020.513999
290.4554830.9109660.544517
300.4880960.9761920.511904
310.525980.9480390.47402
320.547730.9045390.45227
330.5234140.9531720.476586
340.4992230.9984460.500777
350.4763990.9527980.523601
360.4523220.9046450.547678
370.4814890.9629770.518511
380.4624350.9248690.537565
390.43850.8770.5615
400.4627590.9255180.537241
410.4372350.8744690.562765
420.417690.835380.58231
430.4003260.8006510.599674
440.3799720.7599440.620028
450.3613860.7227720.638614
460.388240.776480.61176
470.3698340.7396690.630166
480.3505270.7010550.649473
490.3726080.7452160.627392
500.3561940.7123880.643806
510.3396430.6792850.660357
520.3247770.6495540.675223
530.3098810.6197630.690119
540.2960380.5920760.703962
550.2832920.5665850.716708
560.2715720.5431440.728428
570.3016130.6032270.698387
580.2886650.577330.711335
590.3087370.6174740.691263
600.2975330.5950660.702467
610.2893260.5786510.710674
620.3075060.6150120.692494
630.3226160.6452330.677384
640.3141640.6283280.685836
650.3280780.6561570.671922
660.3204740.6409490.679526
670.333090.666180.66691
680.3282430.6564860.671757
690.3302440.6604870.669756
700.3386750.677350.661325
710.3461610.6923220.653839
720.3538230.7076450.646177
730.3633320.7266650.636668
740.3672980.7345950.632702
750.3700340.7400690.629966
760.372980.7459590.62702
770.3716490.7432970.628351
780.3720180.7440350.627982
790.3793370.7586730.620663
800.3669420.7338840.633058
810.3731320.7462640.626868
820.3807450.7614910.619255
830.3927640.7855290.607236
840.3897910.7795820.610209
850.4035620.8071240.596438
860.3819970.7639940.618003
870.3654890.7309770.634511
880.3795310.7590630.620469
890.3881490.7762980.611851
900.4280890.8561790.571911
910.3918050.7836110.608195
920.4013830.8027660.598617
930.3840880.7681760.615912
940.3860230.7720470.613977
950.3908570.7817130.609143
960.3921560.7843120.607844
970.4123450.824690.587655
980.3814940.7629890.618506
990.3361610.6723220.663839
1000.3778660.7557330.622134
1010.3918390.7836790.608161
1020.3612020.7224030.638798
1030.458640.917280.54136
1040.5977340.8045310.402266
1050.6531030.6937940.346897
1060.5235630.9528740.476437
1070.4605960.9211920.539404
1080.2839980.5679970.716002

\begin{tabular}{lllllllll}
\hline
Goldfeld-Quandt test for Heteroskedasticity \tabularnewline
p-values & Alternative Hypothesis \tabularnewline
breakpoint index & greater & 2-sided & less \tabularnewline
5 & 0.483226 & 0.966451 & 0.516774 \tabularnewline
6 & 0.548113 & 0.903775 & 0.451887 \tabularnewline
7 & 0.435155 & 0.87031 & 0.564845 \tabularnewline
8 & 0.492918 & 0.985836 & 0.507082 \tabularnewline
9 & 0.421586 & 0.843171 & 0.578414 \tabularnewline
10 & 0.318346 & 0.636692 & 0.681654 \tabularnewline
11 & 0.266884 & 0.533767 & 0.733116 \tabularnewline
12 & 0.20275 & 0.4055 & 0.79725 \tabularnewline
13 & 0.15617 & 0.31234 & 0.84383 \tabularnewline
14 & 0.218931 & 0.437862 & 0.781069 \tabularnewline
15 & 0.47693 & 0.95386 & 0.52307 \tabularnewline
16 & 0.515692 & 0.968616 & 0.484308 \tabularnewline
17 & 0.493711 & 0.987421 & 0.506289 \tabularnewline
18 & 0.556468 & 0.887064 & 0.443532 \tabularnewline
19 & 0.517323 & 0.965355 & 0.482677 \tabularnewline
20 & 0.558186 & 0.883628 & 0.441814 \tabularnewline
21 & 0.506994 & 0.986011 & 0.493006 \tabularnewline
22 & 0.505756 & 0.988488 & 0.494244 \tabularnewline
23 & 0.536527 & 0.926946 & 0.463473 \tabularnewline
24 & 0.527584 & 0.944832 & 0.472416 \tabularnewline
25 & 0.502636 & 0.994729 & 0.497364 \tabularnewline
26 & 0.473383 & 0.946766 & 0.526617 \tabularnewline
27 & 0.455031 & 0.910062 & 0.544969 \tabularnewline
28 & 0.486001 & 0.972002 & 0.513999 \tabularnewline
29 & 0.455483 & 0.910966 & 0.544517 \tabularnewline
30 & 0.488096 & 0.976192 & 0.511904 \tabularnewline
31 & 0.52598 & 0.948039 & 0.47402 \tabularnewline
32 & 0.54773 & 0.904539 & 0.45227 \tabularnewline
33 & 0.523414 & 0.953172 & 0.476586 \tabularnewline
34 & 0.499223 & 0.998446 & 0.500777 \tabularnewline
35 & 0.476399 & 0.952798 & 0.523601 \tabularnewline
36 & 0.452322 & 0.904645 & 0.547678 \tabularnewline
37 & 0.481489 & 0.962977 & 0.518511 \tabularnewline
38 & 0.462435 & 0.924869 & 0.537565 \tabularnewline
39 & 0.4385 & 0.877 & 0.5615 \tabularnewline
40 & 0.462759 & 0.925518 & 0.537241 \tabularnewline
41 & 0.437235 & 0.874469 & 0.562765 \tabularnewline
42 & 0.41769 & 0.83538 & 0.58231 \tabularnewline
43 & 0.400326 & 0.800651 & 0.599674 \tabularnewline
44 & 0.379972 & 0.759944 & 0.620028 \tabularnewline
45 & 0.361386 & 0.722772 & 0.638614 \tabularnewline
46 & 0.38824 & 0.77648 & 0.61176 \tabularnewline
47 & 0.369834 & 0.739669 & 0.630166 \tabularnewline
48 & 0.350527 & 0.701055 & 0.649473 \tabularnewline
49 & 0.372608 & 0.745216 & 0.627392 \tabularnewline
50 & 0.356194 & 0.712388 & 0.643806 \tabularnewline
51 & 0.339643 & 0.679285 & 0.660357 \tabularnewline
52 & 0.324777 & 0.649554 & 0.675223 \tabularnewline
53 & 0.309881 & 0.619763 & 0.690119 \tabularnewline
54 & 0.296038 & 0.592076 & 0.703962 \tabularnewline
55 & 0.283292 & 0.566585 & 0.716708 \tabularnewline
56 & 0.271572 & 0.543144 & 0.728428 \tabularnewline
57 & 0.301613 & 0.603227 & 0.698387 \tabularnewline
58 & 0.288665 & 0.57733 & 0.711335 \tabularnewline
59 & 0.308737 & 0.617474 & 0.691263 \tabularnewline
60 & 0.297533 & 0.595066 & 0.702467 \tabularnewline
61 & 0.289326 & 0.578651 & 0.710674 \tabularnewline
62 & 0.307506 & 0.615012 & 0.692494 \tabularnewline
63 & 0.322616 & 0.645233 & 0.677384 \tabularnewline
64 & 0.314164 & 0.628328 & 0.685836 \tabularnewline
65 & 0.328078 & 0.656157 & 0.671922 \tabularnewline
66 & 0.320474 & 0.640949 & 0.679526 \tabularnewline
67 & 0.33309 & 0.66618 & 0.66691 \tabularnewline
68 & 0.328243 & 0.656486 & 0.671757 \tabularnewline
69 & 0.330244 & 0.660487 & 0.669756 \tabularnewline
70 & 0.338675 & 0.67735 & 0.661325 \tabularnewline
71 & 0.346161 & 0.692322 & 0.653839 \tabularnewline
72 & 0.353823 & 0.707645 & 0.646177 \tabularnewline
73 & 0.363332 & 0.726665 & 0.636668 \tabularnewline
74 & 0.367298 & 0.734595 & 0.632702 \tabularnewline
75 & 0.370034 & 0.740069 & 0.629966 \tabularnewline
76 & 0.37298 & 0.745959 & 0.62702 \tabularnewline
77 & 0.371649 & 0.743297 & 0.628351 \tabularnewline
78 & 0.372018 & 0.744035 & 0.627982 \tabularnewline
79 & 0.379337 & 0.758673 & 0.620663 \tabularnewline
80 & 0.366942 & 0.733884 & 0.633058 \tabularnewline
81 & 0.373132 & 0.746264 & 0.626868 \tabularnewline
82 & 0.380745 & 0.761491 & 0.619255 \tabularnewline
83 & 0.392764 & 0.785529 & 0.607236 \tabularnewline
84 & 0.389791 & 0.779582 & 0.610209 \tabularnewline
85 & 0.403562 & 0.807124 & 0.596438 \tabularnewline
86 & 0.381997 & 0.763994 & 0.618003 \tabularnewline
87 & 0.365489 & 0.730977 & 0.634511 \tabularnewline
88 & 0.379531 & 0.759063 & 0.620469 \tabularnewline
89 & 0.388149 & 0.776298 & 0.611851 \tabularnewline
90 & 0.428089 & 0.856179 & 0.571911 \tabularnewline
91 & 0.391805 & 0.783611 & 0.608195 \tabularnewline
92 & 0.401383 & 0.802766 & 0.598617 \tabularnewline
93 & 0.384088 & 0.768176 & 0.615912 \tabularnewline
94 & 0.386023 & 0.772047 & 0.613977 \tabularnewline
95 & 0.390857 & 0.781713 & 0.609143 \tabularnewline
96 & 0.392156 & 0.784312 & 0.607844 \tabularnewline
97 & 0.412345 & 0.82469 & 0.587655 \tabularnewline
98 & 0.381494 & 0.762989 & 0.618506 \tabularnewline
99 & 0.336161 & 0.672322 & 0.663839 \tabularnewline
100 & 0.377866 & 0.755733 & 0.622134 \tabularnewline
101 & 0.391839 & 0.783679 & 0.608161 \tabularnewline
102 & 0.361202 & 0.722403 & 0.638798 \tabularnewline
103 & 0.45864 & 0.91728 & 0.54136 \tabularnewline
104 & 0.597734 & 0.804531 & 0.402266 \tabularnewline
105 & 0.653103 & 0.693794 & 0.346897 \tabularnewline
106 & 0.523563 & 0.952874 & 0.476437 \tabularnewline
107 & 0.460596 & 0.921192 & 0.539404 \tabularnewline
108 & 0.283998 & 0.567997 & 0.716002 \tabularnewline
\hline
\end{tabular}
%Source: https://freestatistics.org/blog/index.php?pk=264745&T=5

[TABLE]
[ROW][C]Goldfeld-Quandt test for Heteroskedasticity[/C][/ROW]
[ROW][C]p-values[/C][C]Alternative Hypothesis[/C][/ROW]
[ROW][C]breakpoint index[/C][C]greater[/C][C]2-sided[/C][C]less[/C][/ROW]
[ROW][C]5[/C][C]0.483226[/C][C]0.966451[/C][C]0.516774[/C][/ROW]
[ROW][C]6[/C][C]0.548113[/C][C]0.903775[/C][C]0.451887[/C][/ROW]
[ROW][C]7[/C][C]0.435155[/C][C]0.87031[/C][C]0.564845[/C][/ROW]
[ROW][C]8[/C][C]0.492918[/C][C]0.985836[/C][C]0.507082[/C][/ROW]
[ROW][C]9[/C][C]0.421586[/C][C]0.843171[/C][C]0.578414[/C][/ROW]
[ROW][C]10[/C][C]0.318346[/C][C]0.636692[/C][C]0.681654[/C][/ROW]
[ROW][C]11[/C][C]0.266884[/C][C]0.533767[/C][C]0.733116[/C][/ROW]
[ROW][C]12[/C][C]0.20275[/C][C]0.4055[/C][C]0.79725[/C][/ROW]
[ROW][C]13[/C][C]0.15617[/C][C]0.31234[/C][C]0.84383[/C][/ROW]
[ROW][C]14[/C][C]0.218931[/C][C]0.437862[/C][C]0.781069[/C][/ROW]
[ROW][C]15[/C][C]0.47693[/C][C]0.95386[/C][C]0.52307[/C][/ROW]
[ROW][C]16[/C][C]0.515692[/C][C]0.968616[/C][C]0.484308[/C][/ROW]
[ROW][C]17[/C][C]0.493711[/C][C]0.987421[/C][C]0.506289[/C][/ROW]
[ROW][C]18[/C][C]0.556468[/C][C]0.887064[/C][C]0.443532[/C][/ROW]
[ROW][C]19[/C][C]0.517323[/C][C]0.965355[/C][C]0.482677[/C][/ROW]
[ROW][C]20[/C][C]0.558186[/C][C]0.883628[/C][C]0.441814[/C][/ROW]
[ROW][C]21[/C][C]0.506994[/C][C]0.986011[/C][C]0.493006[/C][/ROW]
[ROW][C]22[/C][C]0.505756[/C][C]0.988488[/C][C]0.494244[/C][/ROW]
[ROW][C]23[/C][C]0.536527[/C][C]0.926946[/C][C]0.463473[/C][/ROW]
[ROW][C]24[/C][C]0.527584[/C][C]0.944832[/C][C]0.472416[/C][/ROW]
[ROW][C]25[/C][C]0.502636[/C][C]0.994729[/C][C]0.497364[/C][/ROW]
[ROW][C]26[/C][C]0.473383[/C][C]0.946766[/C][C]0.526617[/C][/ROW]
[ROW][C]27[/C][C]0.455031[/C][C]0.910062[/C][C]0.544969[/C][/ROW]
[ROW][C]28[/C][C]0.486001[/C][C]0.972002[/C][C]0.513999[/C][/ROW]
[ROW][C]29[/C][C]0.455483[/C][C]0.910966[/C][C]0.544517[/C][/ROW]
[ROW][C]30[/C][C]0.488096[/C][C]0.976192[/C][C]0.511904[/C][/ROW]
[ROW][C]31[/C][C]0.52598[/C][C]0.948039[/C][C]0.47402[/C][/ROW]
[ROW][C]32[/C][C]0.54773[/C][C]0.904539[/C][C]0.45227[/C][/ROW]
[ROW][C]33[/C][C]0.523414[/C][C]0.953172[/C][C]0.476586[/C][/ROW]
[ROW][C]34[/C][C]0.499223[/C][C]0.998446[/C][C]0.500777[/C][/ROW]
[ROW][C]35[/C][C]0.476399[/C][C]0.952798[/C][C]0.523601[/C][/ROW]
[ROW][C]36[/C][C]0.452322[/C][C]0.904645[/C][C]0.547678[/C][/ROW]
[ROW][C]37[/C][C]0.481489[/C][C]0.962977[/C][C]0.518511[/C][/ROW]
[ROW][C]38[/C][C]0.462435[/C][C]0.924869[/C][C]0.537565[/C][/ROW]
[ROW][C]39[/C][C]0.4385[/C][C]0.877[/C][C]0.5615[/C][/ROW]
[ROW][C]40[/C][C]0.462759[/C][C]0.925518[/C][C]0.537241[/C][/ROW]
[ROW][C]41[/C][C]0.437235[/C][C]0.874469[/C][C]0.562765[/C][/ROW]
[ROW][C]42[/C][C]0.41769[/C][C]0.83538[/C][C]0.58231[/C][/ROW]
[ROW][C]43[/C][C]0.400326[/C][C]0.800651[/C][C]0.599674[/C][/ROW]
[ROW][C]44[/C][C]0.379972[/C][C]0.759944[/C][C]0.620028[/C][/ROW]
[ROW][C]45[/C][C]0.361386[/C][C]0.722772[/C][C]0.638614[/C][/ROW]
[ROW][C]46[/C][C]0.38824[/C][C]0.77648[/C][C]0.61176[/C][/ROW]
[ROW][C]47[/C][C]0.369834[/C][C]0.739669[/C][C]0.630166[/C][/ROW]
[ROW][C]48[/C][C]0.350527[/C][C]0.701055[/C][C]0.649473[/C][/ROW]
[ROW][C]49[/C][C]0.372608[/C][C]0.745216[/C][C]0.627392[/C][/ROW]
[ROW][C]50[/C][C]0.356194[/C][C]0.712388[/C][C]0.643806[/C][/ROW]
[ROW][C]51[/C][C]0.339643[/C][C]0.679285[/C][C]0.660357[/C][/ROW]
[ROW][C]52[/C][C]0.324777[/C][C]0.649554[/C][C]0.675223[/C][/ROW]
[ROW][C]53[/C][C]0.309881[/C][C]0.619763[/C][C]0.690119[/C][/ROW]
[ROW][C]54[/C][C]0.296038[/C][C]0.592076[/C][C]0.703962[/C][/ROW]
[ROW][C]55[/C][C]0.283292[/C][C]0.566585[/C][C]0.716708[/C][/ROW]
[ROW][C]56[/C][C]0.271572[/C][C]0.543144[/C][C]0.728428[/C][/ROW]
[ROW][C]57[/C][C]0.301613[/C][C]0.603227[/C][C]0.698387[/C][/ROW]
[ROW][C]58[/C][C]0.288665[/C][C]0.57733[/C][C]0.711335[/C][/ROW]
[ROW][C]59[/C][C]0.308737[/C][C]0.617474[/C][C]0.691263[/C][/ROW]
[ROW][C]60[/C][C]0.297533[/C][C]0.595066[/C][C]0.702467[/C][/ROW]
[ROW][C]61[/C][C]0.289326[/C][C]0.578651[/C][C]0.710674[/C][/ROW]
[ROW][C]62[/C][C]0.307506[/C][C]0.615012[/C][C]0.692494[/C][/ROW]
[ROW][C]63[/C][C]0.322616[/C][C]0.645233[/C][C]0.677384[/C][/ROW]
[ROW][C]64[/C][C]0.314164[/C][C]0.628328[/C][C]0.685836[/C][/ROW]
[ROW][C]65[/C][C]0.328078[/C][C]0.656157[/C][C]0.671922[/C][/ROW]
[ROW][C]66[/C][C]0.320474[/C][C]0.640949[/C][C]0.679526[/C][/ROW]
[ROW][C]67[/C][C]0.33309[/C][C]0.66618[/C][C]0.66691[/C][/ROW]
[ROW][C]68[/C][C]0.328243[/C][C]0.656486[/C][C]0.671757[/C][/ROW]
[ROW][C]69[/C][C]0.330244[/C][C]0.660487[/C][C]0.669756[/C][/ROW]
[ROW][C]70[/C][C]0.338675[/C][C]0.67735[/C][C]0.661325[/C][/ROW]
[ROW][C]71[/C][C]0.346161[/C][C]0.692322[/C][C]0.653839[/C][/ROW]
[ROW][C]72[/C][C]0.353823[/C][C]0.707645[/C][C]0.646177[/C][/ROW]
[ROW][C]73[/C][C]0.363332[/C][C]0.726665[/C][C]0.636668[/C][/ROW]
[ROW][C]74[/C][C]0.367298[/C][C]0.734595[/C][C]0.632702[/C][/ROW]
[ROW][C]75[/C][C]0.370034[/C][C]0.740069[/C][C]0.629966[/C][/ROW]
[ROW][C]76[/C][C]0.37298[/C][C]0.745959[/C][C]0.62702[/C][/ROW]
[ROW][C]77[/C][C]0.371649[/C][C]0.743297[/C][C]0.628351[/C][/ROW]
[ROW][C]78[/C][C]0.372018[/C][C]0.744035[/C][C]0.627982[/C][/ROW]
[ROW][C]79[/C][C]0.379337[/C][C]0.758673[/C][C]0.620663[/C][/ROW]
[ROW][C]80[/C][C]0.366942[/C][C]0.733884[/C][C]0.633058[/C][/ROW]
[ROW][C]81[/C][C]0.373132[/C][C]0.746264[/C][C]0.626868[/C][/ROW]
[ROW][C]82[/C][C]0.380745[/C][C]0.761491[/C][C]0.619255[/C][/ROW]
[ROW][C]83[/C][C]0.392764[/C][C]0.785529[/C][C]0.607236[/C][/ROW]
[ROW][C]84[/C][C]0.389791[/C][C]0.779582[/C][C]0.610209[/C][/ROW]
[ROW][C]85[/C][C]0.403562[/C][C]0.807124[/C][C]0.596438[/C][/ROW]
[ROW][C]86[/C][C]0.381997[/C][C]0.763994[/C][C]0.618003[/C][/ROW]
[ROW][C]87[/C][C]0.365489[/C][C]0.730977[/C][C]0.634511[/C][/ROW]
[ROW][C]88[/C][C]0.379531[/C][C]0.759063[/C][C]0.620469[/C][/ROW]
[ROW][C]89[/C][C]0.388149[/C][C]0.776298[/C][C]0.611851[/C][/ROW]
[ROW][C]90[/C][C]0.428089[/C][C]0.856179[/C][C]0.571911[/C][/ROW]
[ROW][C]91[/C][C]0.391805[/C][C]0.783611[/C][C]0.608195[/C][/ROW]
[ROW][C]92[/C][C]0.401383[/C][C]0.802766[/C][C]0.598617[/C][/ROW]
[ROW][C]93[/C][C]0.384088[/C][C]0.768176[/C][C]0.615912[/C][/ROW]
[ROW][C]94[/C][C]0.386023[/C][C]0.772047[/C][C]0.613977[/C][/ROW]
[ROW][C]95[/C][C]0.390857[/C][C]0.781713[/C][C]0.609143[/C][/ROW]
[ROW][C]96[/C][C]0.392156[/C][C]0.784312[/C][C]0.607844[/C][/ROW]
[ROW][C]97[/C][C]0.412345[/C][C]0.82469[/C][C]0.587655[/C][/ROW]
[ROW][C]98[/C][C]0.381494[/C][C]0.762989[/C][C]0.618506[/C][/ROW]
[ROW][C]99[/C][C]0.336161[/C][C]0.672322[/C][C]0.663839[/C][/ROW]
[ROW][C]100[/C][C]0.377866[/C][C]0.755733[/C][C]0.622134[/C][/ROW]
[ROW][C]101[/C][C]0.391839[/C][C]0.783679[/C][C]0.608161[/C][/ROW]
[ROW][C]102[/C][C]0.361202[/C][C]0.722403[/C][C]0.638798[/C][/ROW]
[ROW][C]103[/C][C]0.45864[/C][C]0.91728[/C][C]0.54136[/C][/ROW]
[ROW][C]104[/C][C]0.597734[/C][C]0.804531[/C][C]0.402266[/C][/ROW]
[ROW][C]105[/C][C]0.653103[/C][C]0.693794[/C][C]0.346897[/C][/ROW]
[ROW][C]106[/C][C]0.523563[/C][C]0.952874[/C][C]0.476437[/C][/ROW]
[ROW][C]107[/C][C]0.460596[/C][C]0.921192[/C][C]0.539404[/C][/ROW]
[ROW][C]108[/C][C]0.283998[/C][C]0.567997[/C][C]0.716002[/C][/ROW]
[/TABLE]
Source: https://freestatistics.org/blog/index.php?pk=264745&T=5

Globally Unique Identifier (entire table): ba.freestatistics.org/blog/index.php?pk=264745&T=5

As an alternative you can also use a QR Code:  

The GUIDs for individual cells are displayed in the table below:

Goldfeld-Quandt test for Heteroskedasticity
p-valuesAlternative Hypothesis
breakpoint indexgreater2-sidedless
50.4832260.9664510.516774
60.5481130.9037750.451887
70.4351550.870310.564845
80.4929180.9858360.507082
90.4215860.8431710.578414
100.3183460.6366920.681654
110.2668840.5337670.733116
120.202750.40550.79725
130.156170.312340.84383
140.2189310.4378620.781069
150.476930.953860.52307
160.5156920.9686160.484308
170.4937110.9874210.506289
180.5564680.8870640.443532
190.5173230.9653550.482677
200.5581860.8836280.441814
210.5069940.9860110.493006
220.5057560.9884880.494244
230.5365270.9269460.463473
240.5275840.9448320.472416
250.5026360.9947290.497364
260.4733830.9467660.526617
270.4550310.9100620.544969
280.4860010.9720020.513999
290.4554830.9109660.544517
300.4880960.9761920.511904
310.525980.9480390.47402
320.547730.9045390.45227
330.5234140.9531720.476586
340.4992230.9984460.500777
350.4763990.9527980.523601
360.4523220.9046450.547678
370.4814890.9629770.518511
380.4624350.9248690.537565
390.43850.8770.5615
400.4627590.9255180.537241
410.4372350.8744690.562765
420.417690.835380.58231
430.4003260.8006510.599674
440.3799720.7599440.620028
450.3613860.7227720.638614
460.388240.776480.61176
470.3698340.7396690.630166
480.3505270.7010550.649473
490.3726080.7452160.627392
500.3561940.7123880.643806
510.3396430.6792850.660357
520.3247770.6495540.675223
530.3098810.6197630.690119
540.2960380.5920760.703962
550.2832920.5665850.716708
560.2715720.5431440.728428
570.3016130.6032270.698387
580.2886650.577330.711335
590.3087370.6174740.691263
600.2975330.5950660.702467
610.2893260.5786510.710674
620.3075060.6150120.692494
630.3226160.6452330.677384
640.3141640.6283280.685836
650.3280780.6561570.671922
660.3204740.6409490.679526
670.333090.666180.66691
680.3282430.6564860.671757
690.3302440.6604870.669756
700.3386750.677350.661325
710.3461610.6923220.653839
720.3538230.7076450.646177
730.3633320.7266650.636668
740.3672980.7345950.632702
750.3700340.7400690.629966
760.372980.7459590.62702
770.3716490.7432970.628351
780.3720180.7440350.627982
790.3793370.7586730.620663
800.3669420.7338840.633058
810.3731320.7462640.626868
820.3807450.7614910.619255
830.3927640.7855290.607236
840.3897910.7795820.610209
850.4035620.8071240.596438
860.3819970.7639940.618003
870.3654890.7309770.634511
880.3795310.7590630.620469
890.3881490.7762980.611851
900.4280890.8561790.571911
910.3918050.7836110.608195
920.4013830.8027660.598617
930.3840880.7681760.615912
940.3860230.7720470.613977
950.3908570.7817130.609143
960.3921560.7843120.607844
970.4123450.824690.587655
980.3814940.7629890.618506
990.3361610.6723220.663839
1000.3778660.7557330.622134
1010.3918390.7836790.608161
1020.3612020.7224030.638798
1030.458640.917280.54136
1040.5977340.8045310.402266
1050.6531030.6937940.346897
1060.5235630.9528740.476437
1070.4605960.9211920.539404
1080.2839980.5679970.716002


Meta Analysis of Goldfeld-Quandt test for Heteroskedasticity
Description# significant tests% significant testsOK/NOK
1% type I error level00OK
5% type I error level00OK
10% type I error level00OK

\begin{tabular}{lllllllll}
\hline
Meta Analysis of Goldfeld-Quandt test for Heteroskedasticity \tabularnewline
Description & # significant tests & % significant tests & OK/NOK \tabularnewline
1% type I error level & 0 & 0 & OK \tabularnewline
5% type I error level & 0 & 0 & OK \tabularnewline
10% type I error level & 0 & 0 & OK \tabularnewline
\hline
\end{tabular}
%Source: https://freestatistics.org/blog/index.php?pk=264745&T=6

[TABLE]
[ROW][C]Meta Analysis of Goldfeld-Quandt test for Heteroskedasticity[/C][/ROW]
[ROW][C]Description[/C][C]# significant tests[/C][C]% significant tests[/C][C]OK/NOK[/C][/ROW]
[ROW][C]1% type I error level[/C][C]0[/C][C]0[/C][C]OK[/C][/ROW]
[ROW][C]5% type I error level[/C][C]0[/C][C]0[/C][C]OK[/C][/ROW]
[ROW][C]10% type I error level[/C][C]0[/C][C]0[/C][C]OK[/C][/ROW]
[/TABLE]
Source: https://freestatistics.org/blog/index.php?pk=264745&T=6

Globally Unique Identifier (entire table): ba.freestatistics.org/blog/index.php?pk=264745&T=6

As an alternative you can also use a QR Code:  

The GUIDs for individual cells are displayed in the table below:

Meta Analysis of Goldfeld-Quandt test for Heteroskedasticity
Description# significant tests% significant testsOK/NOK
1% type I error level00OK
5% type I error level00OK
10% type I error level00OK


Parameters (Session):
par1 = 1 ; par2 = Do not include Seasonal Dummies ; par3 = No Linear Trend ;
Parameters (R input):
par1 = 1 ; par2 = Do not include Seasonal Dummies ; par3 = No Linear Trend ;
R code (references can be found in the software module):
par3 <- 'No Linear Trend'
par2 <- 'Do not include Seasonal Dummies'
par1 <- ''
library(lattice)
library(lmtest)
n25 <- 25 #minimum number of obs. for Goldfeld-Quandt test
par1 <- as.numeric(par1)
x <- t(y)
k <- length(x[1,])
n <- length(x[,1])
x1 <- cbind(x[,par1], x[,1:k!=par1])
mycolnames <- c(colnames(x)[par1], colnames(x)[1:k!=par1])
colnames(x1) <- mycolnames #colnames(x)[par1]
x <- x1
if (par3 == 'First Differences'){
x2 <- array(0, dim=c(n-1,k), dimnames=list(1:(n-1), paste('(1-B)',colnames(x),sep='')))
for (i in 1:n-1) {
for (j in 1:k) {
x2[i,j] <- x[i+1,j] - x[i,j]
}
}
x <- x2
}
if (par2 == 'Include Monthly Dummies'){
x2 <- array(0, dim=c(n,11), dimnames=list(1:n, paste('M', seq(1:11), sep ='')))
for (i in 1:11){
x2[seq(i,n,12),i] <- 1
}
x <- cbind(x, x2)
}
if (par2 == 'Include Quarterly Dummies'){
x2 <- array(0, dim=c(n,3), dimnames=list(1:n, paste('Q', seq(1:3), sep ='')))
for (i in 1:3){
x2[seq(i,n,4),i] <- 1
}
x <- cbind(x, x2)
}
k <- length(x[1,])
if (par3 == 'Linear Trend'){
x <- cbind(x, c(1:n))
colnames(x)[k+1] <- 't'
}
x
k <- length(x[1,])
df <- as.data.frame(x)
(mylm <- lm(df))
(mysum <- summary(mylm))
if (n > n25) {
kp3 <- k + 3
nmkm3 <- n - k - 3
gqarr <- array(NA, dim=c(nmkm3-kp3+1,3))
numgqtests <- 0
numsignificant1 <- 0
numsignificant5 <- 0
numsignificant10 <- 0
for (mypoint in kp3:nmkm3) {
j <- 0
numgqtests <- numgqtests + 1
for (myalt in c('greater', 'two.sided', 'less')) {
j <- j + 1
gqarr[mypoint-kp3+1,j] <- gqtest(mylm, point=mypoint, alternative=myalt)$p.value
}
if (gqarr[mypoint-kp3+1,2] < 0.01) numsignificant1 <- numsignificant1 + 1
if (gqarr[mypoint-kp3+1,2] < 0.05) numsignificant5 <- numsignificant5 + 1
if (gqarr[mypoint-kp3+1,2] < 0.10) numsignificant10 <- numsignificant10 + 1
}
gqarr
}
bitmap(file='test0.png')
plot(x[,1], type='l', main='Actuals and Interpolation', ylab='value of Actuals and Interpolation (dots)', xlab='time or index')
points(x[,1]-mysum$resid)
grid()
dev.off()
bitmap(file='test1.png')
plot(mysum$resid, type='b', pch=19, main='Residuals', ylab='value of Residuals', xlab='time or index')
grid()
dev.off()
bitmap(file='test2.png')
hist(mysum$resid, main='Residual Histogram', xlab='values of Residuals')
grid()
dev.off()
bitmap(file='test3.png')
densityplot(~mysum$resid,col='black',main='Residual Density Plot', xlab='values of Residuals')
dev.off()
bitmap(file='test4.png')
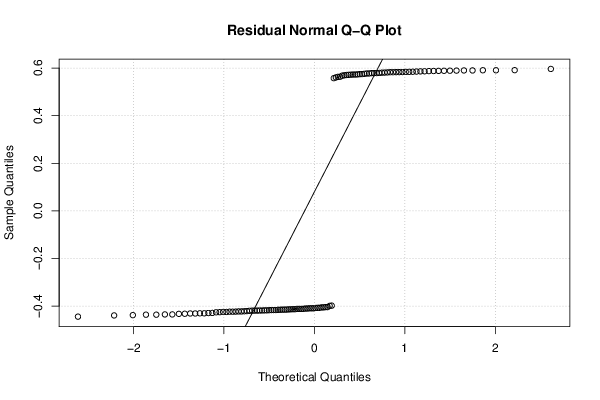
qqnorm(mysum$resid, main='Residual Normal Q-Q Plot')
qqline(mysum$resid)
grid()
dev.off()
(myerror <- as.ts(mysum$resid))
bitmap(file='test5.png')
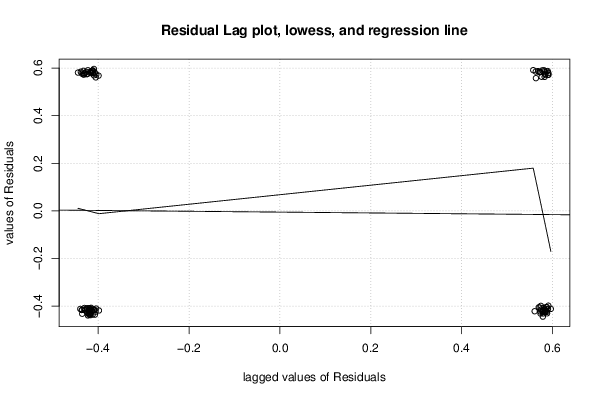
dum <- cbind(lag(myerror,k=1),myerror)
dum
dum1 <- dum[2:length(myerror),]
dum1
z <- as.data.frame(dum1)
z
plot(z,main=paste('Residual Lag plot, lowess, and regression line'), ylab='values of Residuals', xlab='lagged values of Residuals')
lines(lowess(z))
abline(lm(z))
grid()
dev.off()
bitmap(file='test6.png')
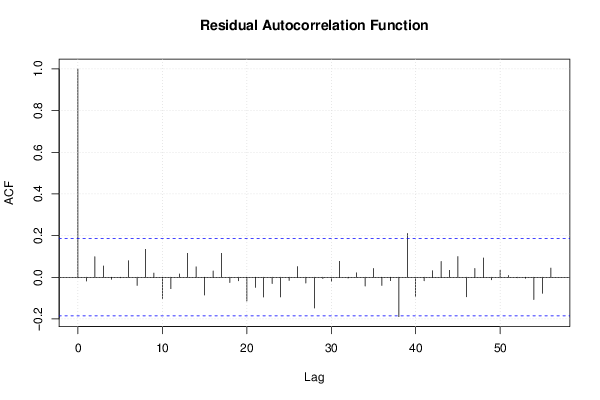
acf(mysum$resid, lag.max=length(mysum$resid)/2, main='Residual Autocorrelation Function')
grid()
dev.off()
bitmap(file='test7.png')
pacf(mysum$resid, lag.max=length(mysum$resid)/2, main='Residual Partial Autocorrelation Function')
grid()
dev.off()
bitmap(file='test8.png')
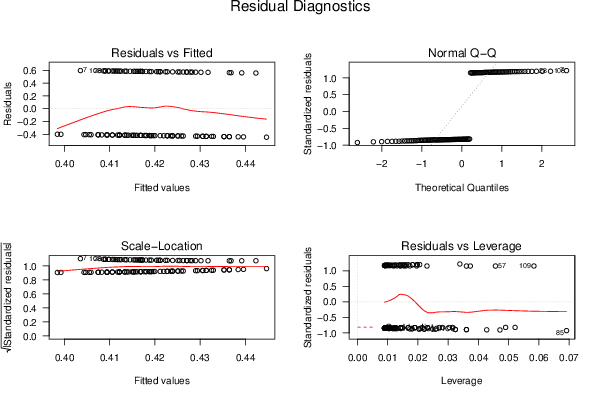
opar <- par(mfrow = c(2,2), oma = c(0, 0, 1.1, 0))
plot(mylm, las = 1, sub='Residual Diagnostics')
par(opar)
dev.off()
if (n > n25) {
bitmap(file='test9.png')
plot(kp3:nmkm3,gqarr[,2], main='Goldfeld-Quandt test',ylab='2-sided p-value',xlab='breakpoint')
grid()
dev.off()
}
load(file='createtable')
a<-table.start()
a<-table.row.start(a)
a<-table.element(a, 'Multiple Linear Regression - Estimated Regression Equation', 1, TRUE)
a<-table.row.end(a)
myeq <- colnames(x)[1]
myeq <- paste(myeq, '[t] = ', sep='')
for (i in 1:k){
if (mysum$coefficients[i,1] > 0) myeq <- paste(myeq, '+', '')
myeq <- paste(myeq, signif(mysum$coefficients[i,1],6), sep=' ')
if (rownames(mysum$coefficients)[i] != '(Intercept)') {
myeq <- paste(myeq, rownames(mysum$coefficients)[i], sep='')
if (rownames(mysum$coefficients)[i] != 't') myeq <- paste(myeq, '[t]', sep='')
}
}
myeq <- paste(myeq, ' + e[t]')
a<-table.row.start(a)
a<-table.element(a, myeq)
a<-table.row.end(a)
a<-table.end(a)
table.save(a,file='mytable1.tab')
a<-table.start()
a<-table.row.start(a)
a<-table.element(a,hyperlink('ols1.htm','Multiple Linear Regression - Ordinary Least Squares',''), 6, TRUE)
a<-table.row.end(a)
a<-table.row.start(a)
a<-table.element(a,'Variable',header=TRUE)
a<-table.element(a,'Parameter',header=TRUE)
a<-table.element(a,'S.D.',header=TRUE)
a<-table.element(a,'T-STAT
H0: parameter = 0',header=TRUE)
a<-table.element(a,'2-tail p-value',header=TRUE)
a<-table.element(a,'1-tail p-value',header=TRUE)
a<-table.row.end(a)
for (i in 1:k){
a<-table.row.start(a)
a<-table.element(a,rownames(mysum$coefficients)[i],header=TRUE)
a<-table.element(a,signif(mysum$coefficients[i,1],6))
a<-table.element(a, signif(mysum$coefficients[i,2],6))
a<-table.element(a, signif(mysum$coefficients[i,3],4))
a<-table.element(a, signif(mysum$coefficients[i,4],6))
a<-table.element(a, signif(mysum$coefficients[i,4]/2,6))
a<-table.row.end(a)
}
a<-table.end(a)
table.save(a,file='mytable2.tab')
a<-table.start()
a<-table.row.start(a)
a<-table.element(a, 'Multiple Linear Regression - Regression Statistics', 2, TRUE)
a<-table.row.end(a)
a<-table.row.start(a)
a<-table.element(a, 'Multiple R',1,TRUE)
a<-table.element(a, signif(sqrt(mysum$r.squared),6))
a<-table.row.end(a)
a<-table.row.start(a)
a<-table.element(a, 'R-squared',1,TRUE)
a<-table.element(a, signif(mysum$r.squared,6))
a<-table.row.end(a)
a<-table.row.start(a)
a<-table.element(a, 'Adjusted R-squared',1,TRUE)
a<-table.element(a, signif(mysum$adj.r.squared,6))
a<-table.row.end(a)
a<-table.row.start(a)
a<-table.element(a, 'F-TEST (value)',1,TRUE)
a<-table.element(a, signif(mysum$fstatistic[1],6))
a<-table.row.end(a)
a<-table.row.start(a)
a<-table.element(a, 'F-TEST (DF numerator)',1,TRUE)
a<-table.element(a, signif(mysum$fstatistic[2],6))
a<-table.row.end(a)
a<-table.row.start(a)
a<-table.element(a, 'F-TEST (DF denominator)',1,TRUE)
a<-table.element(a, signif(mysum$fstatistic[3],6))
a<-table.row.end(a)
a<-table.row.start(a)
a<-table.element(a, 'p-value',1,TRUE)
a<-table.element(a, signif(1-pf(mysum$fstatistic[1],mysum$fstatistic[2],mysum$fstatistic[3]),6))
a<-table.row.end(a)
a<-table.row.start(a)
a<-table.element(a, 'Multiple Linear Regression - Residual Statistics', 2, TRUE)
a<-table.row.end(a)
a<-table.row.start(a)
a<-table.element(a, 'Residual Standard Deviation',1,TRUE)
a<-table.element(a, signif(mysum$sigma,6))
a<-table.row.end(a)
a<-table.row.start(a)
a<-table.element(a, 'Sum Squared Residuals',1,TRUE)
a<-table.element(a, signif(sum(myerror*myerror),6))
a<-table.row.end(a)
a<-table.end(a)
table.save(a,file='mytable3.tab')
a<-table.start()
a<-table.row.start(a)
a<-table.element(a, 'Multiple Linear Regression - Actuals, Interpolation, and Residuals', 4, TRUE)
a<-table.row.end(a)
a<-table.row.start(a)
a<-table.element(a, 'Time or Index', 1, TRUE)
a<-table.element(a, 'Actuals', 1, TRUE)
a<-table.element(a, 'Interpolation
Forecast', 1, TRUE)
a<-table.element(a, 'Residuals
Prediction Error', 1, TRUE)
a<-table.row.end(a)
for (i in 1:n) {
a<-table.row.start(a)
a<-table.element(a,i, 1, TRUE)
a<-table.element(a,signif(x[i],6))
a<-table.element(a,signif(x[i]-mysum$resid[i],6))
a<-table.element(a,signif(mysum$resid[i],6))
a<-table.row.end(a)
}
a<-table.end(a)
table.save(a,file='mytable4.tab')
if (n > n25) {
a<-table.start()
a<-table.row.start(a)
a<-table.element(a,'Goldfeld-Quandt test for Heteroskedasticity',4,TRUE)
a<-table.row.end(a)
a<-table.row.start(a)
a<-table.element(a,'p-values',header=TRUE)
a<-table.element(a,'Alternative Hypothesis',3,header=TRUE)
a<-table.row.end(a)
a<-table.row.start(a)
a<-table.element(a,'breakpoint index',header=TRUE)
a<-table.element(a,'greater',header=TRUE)
a<-table.element(a,'2-sided',header=TRUE)
a<-table.element(a,'less',header=TRUE)
a<-table.row.end(a)
for (mypoint in kp3:nmkm3) {
a<-table.row.start(a)
a<-table.element(a,mypoint,header=TRUE)
a<-table.element(a,signif(gqarr[mypoint-kp3+1,1],6))
a<-table.element(a,signif(gqarr[mypoint-kp3+1,2],6))
a<-table.element(a,signif(gqarr[mypoint-kp3+1,3],6))
a<-table.row.end(a)
}
a<-table.end(a)
table.save(a,file='mytable5.tab')
a<-table.start()
a<-table.row.start(a)
a<-table.element(a,'Meta Analysis of Goldfeld-Quandt test for Heteroskedasticity',4,TRUE)
a<-table.row.end(a)
a<-table.row.start(a)
a<-table.element(a,'Description',header=TRUE)
a<-table.element(a,'# significant tests',header=TRUE)
a<-table.element(a,'% significant tests',header=TRUE)
a<-table.element(a,'OK/NOK',header=TRUE)
a<-table.row.end(a)
a<-table.row.start(a)
a<-table.element(a,'1% type I error level',header=TRUE)
a<-table.element(a,signif(numsignificant1,6))
a<-table.element(a,signif(numsignificant1/numgqtests,6))
if (numsignificant1/numgqtests < 0.01) dum <- 'OK' else dum <- 'NOK'
a<-table.element(a,dum)
a<-table.row.end(a)
a<-table.row.start(a)
a<-table.element(a,'5% type I error level',header=TRUE)
a<-table.element(a,signif(numsignificant5,6))
a<-table.element(a,signif(numsignificant5/numgqtests,6))
if (numsignificant5/numgqtests < 0.05) dum <- 'OK' else dum <- 'NOK'
a<-table.element(a,dum)
a<-table.row.end(a)
a<-table.row.start(a)
a<-table.element(a,'10% type I error level',header=TRUE)
a<-table.element(a,signif(numsignificant10,6))
a<-table.element(a,signif(numsignificant10/numgqtests,6))
if (numsignificant10/numgqtests < 0.1) dum <- 'OK' else dum <- 'NOK'
a<-table.element(a,dum)
a<-table.row.end(a)
a<-table.end(a)
table.save(a,file='mytable6.tab')
}