Free Statistics

of Irreproducible Research!

Author's title

Author*The author of this computation has been verified*
R Software Modulerwasp_smp.wasp
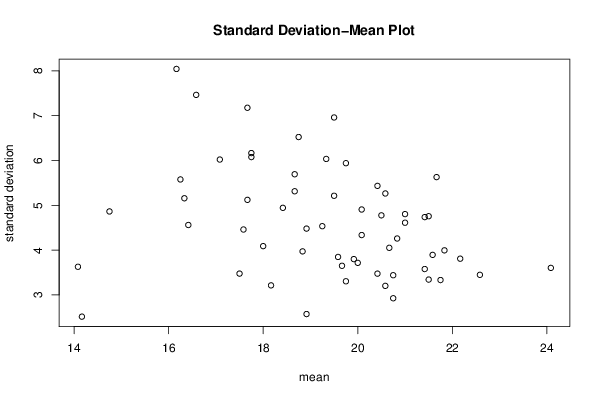
Title produced by softwareStandard Deviation-Mean Plot
Date of computationTue, 09 Dec 2014 17:51:51 +0000
Cite this page as followsStatistical Computations at FreeStatistics.org, Office for Research Development and Education, URL https://freestatistics.org/blog/index.php?v=date/2014/Dec/09/t1418147612xf9om7923e9ikwg.htm/, Retrieved Thu, 16 May 2024 14:50:19 +0000
Statistical Computations at FreeStatistics.org, Office for Research Development and Education, URL https://freestatistics.org/blog/index.php?pk=264783, Retrieved Thu, 16 May 2024 14:50:19 +0000
QR Codes:

Original text written by user:
IsPrivate?No (this computation is public)
User-defined keywords
Estimated Impact64
Family? (F = Feedback message, R = changed R code, M = changed R Module, P = changed Parameters, D = changed Data)
-       [Standard Deviation-Mean Plot] [] [2014-12-09 17:51:51] [83f8f1d217ef29583e8b7cd372ece6b5] [Current]
Feedback Forum

Post a new message
Dataseries X:
21
22
22
18
23
12
20
22
21
19
22
15
20
19
18
15
20
21
21
15
16
23
21
18
25
9
30
20
23
16
16
19
25
18
23
21
10
14
22
26
23
23
24
24
18
23
15
19
16
25
23
17
19
21
18
27
21
13
8
29
28
23
21
19
19
20
18
19
17
19
25
19
22
23
14
16
24
20
12
24
22
12
22
20
10
23
17
22
24
18
21
20
20
22
19
20
26
23
24
21
21
19
8
17
20
11
8
15
18
18
19
19
23
22
21
25
30
17
27
23
23
18
18
23
19
15
20
16
24
25
25
19
19
16
19
19
23
21
22
19
20
20
3
23
23
20
15
16
7
24
17
24
24
19
25
20
28
23
27
18
28
21
19
23
27
22
28
25
21
22
28
20
29
25
25
20
20
16
20
20
23
18
25
18
19
25
25
25
24
19
26
10
17
13
17
30
25
4
16
21
23
22
17
20
20
22
16
23
0
18
25
23
12
18
24
11
18
23
24
29
18
15
29
16
19
22
16
23
23
19
4
20
24
20
4
24
22
16
3
15
24
17
20
27
26
23
17
20
22
19
24
19
23
15
27
26
22
22
18
15
22
27
10
20
17
23
19
13
27
23
16
25
2
26
20
23
22
24
22
17
23
23
28
29
21
24
20
7
19
28
18
26
21
19
20
23
24
16
19
24
21
16
16
21
28
16
23
26
29
18
19
19
16
16
16
18
22
14
20
15
22
24
16
19
24
19
15
11
15
17
20
21
16
17
20
15
21
16
18
25
21
21
16
20
24
28
27
22
20
27
17
22
23
15
22
13
21
18
22
19
15
20
17
21
23
20
18
22
24
24
18
27
19
20
15
20
27
20
20
13
21
23
26
24
25
18
21
23
16
19
20
25
22
20
25
27
20
18
26
26
24
27
16
15
25
27
18
16
18
23
21
21
14
24
18
16
25
22
13
20
17
23
22
23
22
23
10
18
25
26
14
23
22
23
19
14
26
24
21
17
16
15
11
19
21
20
16
19
16
11
22
20
26
26
20
24
20
15
23
25
27
23
20
25
24
22
27
20
17
22
26
19
19
24
22
16
22
23
19
20
16
19
20
15
22
26
24
17
22
15
20
24
17
24
15
20
20
17
11
21
28
14
13
12
21
13
19
23
27
25
22
27
16
20
18
19
17
10
11
16
13
14
12
15
19
15
14
14
10
13
21
11
14
20
7
22
24
16
22
25
5
19
23
13
10
12
21
22
20
17
20
13
9
22
15
12
25
14
14
17
9
10
15
15
15
14
21
13
18
20
16
28
12
20
26
18
21
23
13
22
14
23
16
14
22
19
23
16
20
8
16
11
16
10
17
16
17
10
15
13
19
14
18
25
10
22
15
18
22
18
15
20
18
6
17
12
12
19
23
26
28
19
16
3
11
15
22
12
21
25
12
14
24
12
13
15
17
12
28
25
14
21
18
23
16
15
5
19
22
19
12
22
18
24
19
4
20
24
26
22
19
9
22
18
16
19
20
21
17
9
26
28
13
16
22
18
21
10
15
15
13
10
23
21
14
17
15
15
17
26
12
14
26
18
17
20
16
19
12
20
19
25
19
15
12


Summary of computational transaction
Raw Inputview raw input (R code)
Raw Outputview raw output of R engine
Computing time1 seconds
R Server'Gertrude Mary Cox' @ cox.wessa.net

\begin{tabular}{lllllllll}
\hline
Summary of computational transaction \tabularnewline
Raw Input & view raw input (R code)  \tabularnewline
Raw Output & view raw output of R engine  \tabularnewline
Computing time & 1 seconds \tabularnewline
R Server & 'Gertrude Mary Cox' @ cox.wessa.net \tabularnewline
\hline
\end{tabular}
%Source: https://freestatistics.org/blog/index.php?pk=264783&T=0

[TABLE]
[ROW][C]Summary of computational transaction[/C][/ROW]
[ROW][C]Raw Input[/C][C]view raw input (R code) [/C][/ROW]
[ROW][C]Raw Output[/C][C]view raw output of R engine [/C][/ROW]
[ROW][C]Computing time[/C][C]1 seconds[/C][/ROW]
[ROW][C]R Server[/C][C]'Gertrude Mary Cox' @ cox.wessa.net[/C][/ROW]
[/TABLE]
Source: https://freestatistics.org/blog/index.php?pk=264783&T=0

Globally Unique Identifier (entire table): ba.freestatistics.org/blog/index.php?pk=264783&T=0

As an alternative you can also use a QR Code:  

The GUIDs for individual cells are displayed in the table below:

Summary of computational transaction
Raw Inputview raw input (R code)
Raw Outputview raw output of R engine
Computing time1 seconds
R Server'Gertrude Mary Cox' @ cox.wessa.net


Standard Deviation-Mean Plot
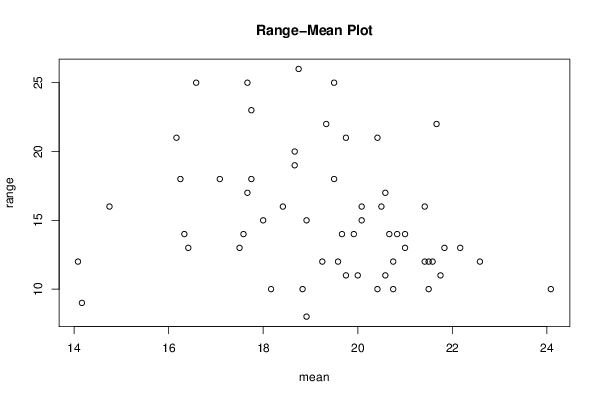
SectionMeanStandard DeviationRange
119.753.3063300170760611
218.91666666666672.574643252722198
320.41666666666675.4348761520276421
420.08333333333334.9074772881118216
519.755.9409977735608121
620.58333333333333.2039275140289211
719.254.5352157410846312
819.66666666666673.6514837167011114
917.756.0771554350549718
1021.83333333333333.996210326008513
1120.41666666666673.4761089357690410
1218.66666666666675.3143601912576720
1319.55.2136185305235218
1424.08333333333333.6045005538110610
1522.16666666666673.8098755248894313
1621.41666666666674.7378233079094116
1718.756.5244296163099126
1817.66666666666677.1774056256527325
19214.8053001041463714
2016.16666666666678.0434426520594821
2121.53.3439225741362810
2220.58333333333335.2649498544332817
2319.56.9609299274267625
2421.66666666666675.6300061897807622
2521.41666666666673.5791906991114712
26214.6122366887148413
2718.16666666666673.2145502536643210
2817.53.4771984543464113
2921.58333333333333.8954129979043812
3019.91666666666673.8009169547583814
3120.753.4410622038709312
3220.66666666666674.0526833609649814
3321.753.3337120996925311
3421.54.7577687665925512
3519.58333333333333.8484550225520512
3620.54.7768380565162416
3718.91666666666674.4814432199162515
3820.08333333333334.3371195580253615
3922.58333333333333.449857265382912
4020.752.9271456776494410
41203.7172815091383411
4217.66666666666675.1227360113931517
4320.83333333333334.26045950004414
4414.16666666666672.516611478423589
4517.08333333333336.0220554227897618
4616.255.5779598746886318
4714.754.8640611539217816
4818.41666666666674.9443876968710416
4918.83333333333333.9733963794062610
5014.08333333333333.6296339242742412
51184.0898988651643615
5216.58333333333337.4645627447089625
5316.33333333333335.1581063003839514
5417.756.1662571526597323
5519.33333333333336.0352499885458322
5618.66666666666675.6942288700264319
5716.41666666666674.561864318522213
5817.58333333333334.4611114255883814

\begin{tabular}{lllllllll}
\hline
Standard Deviation-Mean Plot \tabularnewline
Section & Mean & Standard Deviation & Range \tabularnewline
1 & 19.75 & 3.30633001707606 & 11 \tabularnewline
2 & 18.9166666666667 & 2.57464325272219 & 8 \tabularnewline
3 & 20.4166666666667 & 5.43487615202764 & 21 \tabularnewline
4 & 20.0833333333333 & 4.90747728811182 & 16 \tabularnewline
5 & 19.75 & 5.94099777356081 & 21 \tabularnewline
6 & 20.5833333333333 & 3.20392751402892 & 11 \tabularnewline
7 & 19.25 & 4.53521574108463 & 12 \tabularnewline
8 & 19.6666666666667 & 3.65148371670111 & 14 \tabularnewline
9 & 17.75 & 6.07715543505497 & 18 \tabularnewline
10 & 21.8333333333333 & 3.9962103260085 & 13 \tabularnewline
11 & 20.4166666666667 & 3.47610893576904 & 10 \tabularnewline
12 & 18.6666666666667 & 5.31436019125767 & 20 \tabularnewline
13 & 19.5 & 5.21361853052352 & 18 \tabularnewline
14 & 24.0833333333333 & 3.60450055381106 & 10 \tabularnewline
15 & 22.1666666666667 & 3.80987552488943 & 13 \tabularnewline
16 & 21.4166666666667 & 4.73782330790941 & 16 \tabularnewline
17 & 18.75 & 6.52442961630991 & 26 \tabularnewline
18 & 17.6666666666667 & 7.17740562565273 & 25 \tabularnewline
19 & 21 & 4.80530010414637 & 14 \tabularnewline
20 & 16.1666666666667 & 8.04344265205948 & 21 \tabularnewline
21 & 21.5 & 3.34392257413628 & 10 \tabularnewline
22 & 20.5833333333333 & 5.26494985443328 & 17 \tabularnewline
23 & 19.5 & 6.96092992742676 & 25 \tabularnewline
24 & 21.6666666666667 & 5.63000618978076 & 22 \tabularnewline
25 & 21.4166666666667 & 3.57919069911147 & 12 \tabularnewline
26 & 21 & 4.61223668871484 & 13 \tabularnewline
27 & 18.1666666666667 & 3.21455025366432 & 10 \tabularnewline
28 & 17.5 & 3.47719845434641 & 13 \tabularnewline
29 & 21.5833333333333 & 3.89541299790438 & 12 \tabularnewline
30 & 19.9166666666667 & 3.80091695475838 & 14 \tabularnewline
31 & 20.75 & 3.44106220387093 & 12 \tabularnewline
32 & 20.6666666666667 & 4.05268336096498 & 14 \tabularnewline
33 & 21.75 & 3.33371209969253 & 11 \tabularnewline
34 & 21.5 & 4.75776876659255 & 12 \tabularnewline
35 & 19.5833333333333 & 3.84845502255205 & 12 \tabularnewline
36 & 20.5 & 4.77683805651624 & 16 \tabularnewline
37 & 18.9166666666667 & 4.48144321991625 & 15 \tabularnewline
38 & 20.0833333333333 & 4.33711955802536 & 15 \tabularnewline
39 & 22.5833333333333 & 3.4498572653829 & 12 \tabularnewline
40 & 20.75 & 2.92714567764944 & 10 \tabularnewline
41 & 20 & 3.71728150913834 & 11 \tabularnewline
42 & 17.6666666666667 & 5.12273601139315 & 17 \tabularnewline
43 & 20.8333333333333 & 4.260459500044 & 14 \tabularnewline
44 & 14.1666666666667 & 2.51661147842358 & 9 \tabularnewline
45 & 17.0833333333333 & 6.02205542278976 & 18 \tabularnewline
46 & 16.25 & 5.57795987468863 & 18 \tabularnewline
47 & 14.75 & 4.86406115392178 & 16 \tabularnewline
48 & 18.4166666666667 & 4.94438769687104 & 16 \tabularnewline
49 & 18.8333333333333 & 3.97339637940626 & 10 \tabularnewline
50 & 14.0833333333333 & 3.62963392427424 & 12 \tabularnewline
51 & 18 & 4.08989886516436 & 15 \tabularnewline
52 & 16.5833333333333 & 7.46456274470896 & 25 \tabularnewline
53 & 16.3333333333333 & 5.15810630038395 & 14 \tabularnewline
54 & 17.75 & 6.16625715265973 & 23 \tabularnewline
55 & 19.3333333333333 & 6.03524998854583 & 22 \tabularnewline
56 & 18.6666666666667 & 5.69422887002643 & 19 \tabularnewline
57 & 16.4166666666667 & 4.5618643185222 & 13 \tabularnewline
58 & 17.5833333333333 & 4.46111142558838 & 14 \tabularnewline
\hline
\end{tabular}
%Source: https://freestatistics.org/blog/index.php?pk=264783&T=1

[TABLE]
[ROW][C]Standard Deviation-Mean Plot[/C][/ROW]
[ROW][C]Section[/C][C]Mean[/C][C]Standard Deviation[/C][C]Range[/C][/ROW]
[ROW][C]1[/C][C]19.75[/C][C]3.30633001707606[/C][C]11[/C][/ROW]
[ROW][C]2[/C][C]18.9166666666667[/C][C]2.57464325272219[/C][C]8[/C][/ROW]
[ROW][C]3[/C][C]20.4166666666667[/C][C]5.43487615202764[/C][C]21[/C][/ROW]
[ROW][C]4[/C][C]20.0833333333333[/C][C]4.90747728811182[/C][C]16[/C][/ROW]
[ROW][C]5[/C][C]19.75[/C][C]5.94099777356081[/C][C]21[/C][/ROW]
[ROW][C]6[/C][C]20.5833333333333[/C][C]3.20392751402892[/C][C]11[/C][/ROW]
[ROW][C]7[/C][C]19.25[/C][C]4.53521574108463[/C][C]12[/C][/ROW]
[ROW][C]8[/C][C]19.6666666666667[/C][C]3.65148371670111[/C][C]14[/C][/ROW]
[ROW][C]9[/C][C]17.75[/C][C]6.07715543505497[/C][C]18[/C][/ROW]
[ROW][C]10[/C][C]21.8333333333333[/C][C]3.9962103260085[/C][C]13[/C][/ROW]
[ROW][C]11[/C][C]20.4166666666667[/C][C]3.47610893576904[/C][C]10[/C][/ROW]
[ROW][C]12[/C][C]18.6666666666667[/C][C]5.31436019125767[/C][C]20[/C][/ROW]
[ROW][C]13[/C][C]19.5[/C][C]5.21361853052352[/C][C]18[/C][/ROW]
[ROW][C]14[/C][C]24.0833333333333[/C][C]3.60450055381106[/C][C]10[/C][/ROW]
[ROW][C]15[/C][C]22.1666666666667[/C][C]3.80987552488943[/C][C]13[/C][/ROW]
[ROW][C]16[/C][C]21.4166666666667[/C][C]4.73782330790941[/C][C]16[/C][/ROW]
[ROW][C]17[/C][C]18.75[/C][C]6.52442961630991[/C][C]26[/C][/ROW]
[ROW][C]18[/C][C]17.6666666666667[/C][C]7.17740562565273[/C][C]25[/C][/ROW]
[ROW][C]19[/C][C]21[/C][C]4.80530010414637[/C][C]14[/C][/ROW]
[ROW][C]20[/C][C]16.1666666666667[/C][C]8.04344265205948[/C][C]21[/C][/ROW]
[ROW][C]21[/C][C]21.5[/C][C]3.34392257413628[/C][C]10[/C][/ROW]
[ROW][C]22[/C][C]20.5833333333333[/C][C]5.26494985443328[/C][C]17[/C][/ROW]
[ROW][C]23[/C][C]19.5[/C][C]6.96092992742676[/C][C]25[/C][/ROW]
[ROW][C]24[/C][C]21.6666666666667[/C][C]5.63000618978076[/C][C]22[/C][/ROW]
[ROW][C]25[/C][C]21.4166666666667[/C][C]3.57919069911147[/C][C]12[/C][/ROW]
[ROW][C]26[/C][C]21[/C][C]4.61223668871484[/C][C]13[/C][/ROW]
[ROW][C]27[/C][C]18.1666666666667[/C][C]3.21455025366432[/C][C]10[/C][/ROW]
[ROW][C]28[/C][C]17.5[/C][C]3.47719845434641[/C][C]13[/C][/ROW]
[ROW][C]29[/C][C]21.5833333333333[/C][C]3.89541299790438[/C][C]12[/C][/ROW]
[ROW][C]30[/C][C]19.9166666666667[/C][C]3.80091695475838[/C][C]14[/C][/ROW]
[ROW][C]31[/C][C]20.75[/C][C]3.44106220387093[/C][C]12[/C][/ROW]
[ROW][C]32[/C][C]20.6666666666667[/C][C]4.05268336096498[/C][C]14[/C][/ROW]
[ROW][C]33[/C][C]21.75[/C][C]3.33371209969253[/C][C]11[/C][/ROW]
[ROW][C]34[/C][C]21.5[/C][C]4.75776876659255[/C][C]12[/C][/ROW]
[ROW][C]35[/C][C]19.5833333333333[/C][C]3.84845502255205[/C][C]12[/C][/ROW]
[ROW][C]36[/C][C]20.5[/C][C]4.77683805651624[/C][C]16[/C][/ROW]
[ROW][C]37[/C][C]18.9166666666667[/C][C]4.48144321991625[/C][C]15[/C][/ROW]
[ROW][C]38[/C][C]20.0833333333333[/C][C]4.33711955802536[/C][C]15[/C][/ROW]
[ROW][C]39[/C][C]22.5833333333333[/C][C]3.4498572653829[/C][C]12[/C][/ROW]
[ROW][C]40[/C][C]20.75[/C][C]2.92714567764944[/C][C]10[/C][/ROW]
[ROW][C]41[/C][C]20[/C][C]3.71728150913834[/C][C]11[/C][/ROW]
[ROW][C]42[/C][C]17.6666666666667[/C][C]5.12273601139315[/C][C]17[/C][/ROW]
[ROW][C]43[/C][C]20.8333333333333[/C][C]4.260459500044[/C][C]14[/C][/ROW]
[ROW][C]44[/C][C]14.1666666666667[/C][C]2.51661147842358[/C][C]9[/C][/ROW]
[ROW][C]45[/C][C]17.0833333333333[/C][C]6.02205542278976[/C][C]18[/C][/ROW]
[ROW][C]46[/C][C]16.25[/C][C]5.57795987468863[/C][C]18[/C][/ROW]
[ROW][C]47[/C][C]14.75[/C][C]4.86406115392178[/C][C]16[/C][/ROW]
[ROW][C]48[/C][C]18.4166666666667[/C][C]4.94438769687104[/C][C]16[/C][/ROW]
[ROW][C]49[/C][C]18.8333333333333[/C][C]3.97339637940626[/C][C]10[/C][/ROW]
[ROW][C]50[/C][C]14.0833333333333[/C][C]3.62963392427424[/C][C]12[/C][/ROW]
[ROW][C]51[/C][C]18[/C][C]4.08989886516436[/C][C]15[/C][/ROW]
[ROW][C]52[/C][C]16.5833333333333[/C][C]7.46456274470896[/C][C]25[/C][/ROW]
[ROW][C]53[/C][C]16.3333333333333[/C][C]5.15810630038395[/C][C]14[/C][/ROW]
[ROW][C]54[/C][C]17.75[/C][C]6.16625715265973[/C][C]23[/C][/ROW]
[ROW][C]55[/C][C]19.3333333333333[/C][C]6.03524998854583[/C][C]22[/C][/ROW]
[ROW][C]56[/C][C]18.6666666666667[/C][C]5.69422887002643[/C][C]19[/C][/ROW]
[ROW][C]57[/C][C]16.4166666666667[/C][C]4.5618643185222[/C][C]13[/C][/ROW]
[ROW][C]58[/C][C]17.5833333333333[/C][C]4.46111142558838[/C][C]14[/C][/ROW]
[/TABLE]
Source: https://freestatistics.org/blog/index.php?pk=264783&T=1

Globally Unique Identifier (entire table): ba.freestatistics.org/blog/index.php?pk=264783&T=1

As an alternative you can also use a QR Code:  

The GUIDs for individual cells are displayed in the table below:

Standard Deviation-Mean Plot
SectionMeanStandard DeviationRange
119.753.3063300170760611
218.91666666666672.574643252722198
320.41666666666675.4348761520276421
420.08333333333334.9074772881118216
519.755.9409977735608121
620.58333333333333.2039275140289211
719.254.5352157410846312
819.66666666666673.6514837167011114
917.756.0771554350549718
1021.83333333333333.996210326008513
1120.41666666666673.4761089357690410
1218.66666666666675.3143601912576720
1319.55.2136185305235218
1424.08333333333333.6045005538110610
1522.16666666666673.8098755248894313
1621.41666666666674.7378233079094116
1718.756.5244296163099126
1817.66666666666677.1774056256527325
19214.8053001041463714
2016.16666666666678.0434426520594821
2121.53.3439225741362810
2220.58333333333335.2649498544332817
2319.56.9609299274267625
2421.66666666666675.6300061897807622
2521.41666666666673.5791906991114712
26214.6122366887148413
2718.16666666666673.2145502536643210
2817.53.4771984543464113
2921.58333333333333.8954129979043812
3019.91666666666673.8009169547583814
3120.753.4410622038709312
3220.66666666666674.0526833609649814
3321.753.3337120996925311
3421.54.7577687665925512
3519.58333333333333.8484550225520512
3620.54.7768380565162416
3718.91666666666674.4814432199162515
3820.08333333333334.3371195580253615
3922.58333333333333.449857265382912
4020.752.9271456776494410
41203.7172815091383411
4217.66666666666675.1227360113931517
4320.83333333333334.26045950004414
4414.16666666666672.516611478423589
4517.08333333333336.0220554227897618
4616.255.5779598746886318
4714.754.8640611539217816
4818.41666666666674.9443876968710416
4918.83333333333333.9733963794062610
5014.08333333333333.6296339242742412
51184.0898988651643615
5216.58333333333337.4645627447089625
5316.33333333333335.1581063003839514
5417.756.1662571526597323
5519.33333333333336.0352499885458322
5618.66666666666675.6942288700264319
5716.41666666666674.561864318522213
5817.58333333333334.4611114255883814


Regression: S.E.(k) = alpha + beta * Mean(k)
alpha8.0077732261379
beta-0.175520216345651
S.D.0.074563819241922
T-STAT-2.35395957624135
p-value0.0221084654178359

\begin{tabular}{lllllllll}
\hline
Regression: S.E.(k) = alpha + beta * Mean(k) \tabularnewline
alpha & 8.0077732261379 \tabularnewline
beta & -0.175520216345651 \tabularnewline
S.D. & 0.074563819241922 \tabularnewline
T-STAT & -2.35395957624135 \tabularnewline
p-value & 0.0221084654178359 \tabularnewline
\hline
\end{tabular}
%Source: https://freestatistics.org/blog/index.php?pk=264783&T=2

[TABLE]
[ROW][C]Regression: S.E.(k) = alpha + beta * Mean(k)[/C][/ROW]
[ROW][C]alpha[/C][C]8.0077732261379[/C][/ROW]
[ROW][C]beta[/C][C]-0.175520216345651[/C][/ROW]
[ROW][C]S.D.[/C][C]0.074563819241922[/C][/ROW]
[ROW][C]T-STAT[/C][C]-2.35395957624135[/C][/ROW]
[ROW][C]p-value[/C][C]0.0221084654178359[/C][/ROW]
[/TABLE]
Source: https://freestatistics.org/blog/index.php?pk=264783&T=2

Globally Unique Identifier (entire table): ba.freestatistics.org/blog/index.php?pk=264783&T=2

As an alternative you can also use a QR Code:  

The GUIDs for individual cells are displayed in the table below:

Regression: S.E.(k) = alpha + beta * Mean(k)
alpha8.0077732261379
beta-0.175520216345651
S.D.0.074563819241922
T-STAT-2.35395957624135
p-value0.0221084654178359


Regression: ln S.E.(k) = alpha + beta * ln Mean(k)
alpha3.08073701781965
beta-0.536335069986875
S.D.0.299324401823381
T-STAT-1.79181873151573
p-value0.0785653996587906
Lambda1.53633506998688

\begin{tabular}{lllllllll}
\hline
Regression: ln S.E.(k) = alpha + beta * ln Mean(k) \tabularnewline
alpha & 3.08073701781965 \tabularnewline
beta & -0.536335069986875 \tabularnewline
S.D. & 0.299324401823381 \tabularnewline
T-STAT & -1.79181873151573 \tabularnewline
p-value & 0.0785653996587906 \tabularnewline
Lambda & 1.53633506998688 \tabularnewline
\hline
\end{tabular}
%Source: https://freestatistics.org/blog/index.php?pk=264783&T=3

[TABLE]
[ROW][C]Regression: ln S.E.(k) = alpha + beta * ln Mean(k)[/C][/ROW]
[ROW][C]alpha[/C][C]3.08073701781965[/C][/ROW]
[ROW][C]beta[/C][C]-0.536335069986875[/C][/ROW]
[ROW][C]S.D.[/C][C]0.299324401823381[/C][/ROW]
[ROW][C]T-STAT[/C][C]-1.79181873151573[/C][/ROW]
[ROW][C]p-value[/C][C]0.0785653996587906[/C][/ROW]
[ROW][C]Lambda[/C][C]1.53633506998688[/C][/ROW]
[/TABLE]
Source: https://freestatistics.org/blog/index.php?pk=264783&T=3

Globally Unique Identifier (entire table): ba.freestatistics.org/blog/index.php?pk=264783&T=3

As an alternative you can also use a QR Code:  

The GUIDs for individual cells are displayed in the table below:

Regression: ln S.E.(k) = alpha + beta * ln Mean(k)
alpha3.08073701781965
beta-0.536335069986875
S.D.0.299324401823381
T-STAT-1.79181873151573
p-value0.0785653996587906
Lambda1.53633506998688


Parameters (Session):
par1 = 12 ;
Parameters (R input):
par1 = 12 ;
R code (references can be found in the software module):
par1 <- as.numeric(par1)
(n <- length(x))
(np <- floor(n / par1))
arr <- array(NA,dim=c(par1,np))
j <- 0
k <- 1
for (i in 1:(np*par1))
{
j = j + 1
arr[j,k] <- x[i]
if (j == par1) {
j = 0
k=k+1
}
}
arr
arr.mean <- array(NA,dim=np)
arr.sd <- array(NA,dim=np)
arr.range <- array(NA,dim=np)
for (j in 1:np)
{
arr.mean[j] <- mean(arr[,j],na.rm=TRUE)
arr.sd[j] <- sd(arr[,j],na.rm=TRUE)
arr.range[j] <- max(arr[,j],na.rm=TRUE) - min(arr[,j],na.rm=TRUE)
}
arr.mean
arr.sd
arr.range
(lm1 <- lm(arr.sd~arr.mean))
(lnlm1 <- lm(log(arr.sd)~log(arr.mean)))
(lm2 <- lm(arr.range~arr.mean))
bitmap(file='test1.png')
plot(arr.mean,arr.sd,main='Standard Deviation-Mean Plot',xlab='mean',ylab='standard deviation')
dev.off()
bitmap(file='test2.png')
plot(arr.mean,arr.range,main='Range-Mean Plot',xlab='mean',ylab='range')
dev.off()
load(file='createtable')
a<-table.start()
a<-table.row.start(a)
a<-table.element(a,'Standard Deviation-Mean Plot',4,TRUE)
a<-table.row.end(a)
a<-table.row.start(a)
a<-table.element(a,'Section',header=TRUE)
a<-table.element(a,'Mean',header=TRUE)
a<-table.element(a,'Standard Deviation',header=TRUE)
a<-table.element(a,'Range',header=TRUE)
a<-table.row.end(a)
for (j in 1:np) {
a<-table.row.start(a)
a<-table.element(a,j,header=TRUE)
a<-table.element(a,arr.mean[j])
a<-table.element(a,arr.sd[j] )
a<-table.element(a,arr.range[j] )
a<-table.row.end(a)
}
a<-table.end(a)
table.save(a,file='mytable.tab')
a<-table.start()
a<-table.row.start(a)
a<-table.element(a,'Regression: S.E.(k) = alpha + beta * Mean(k)',2,TRUE)
a<-table.row.end(a)
a<-table.row.start(a)
a<-table.element(a,'alpha',header=TRUE)
a<-table.element(a,lm1$coefficients[[1]])
a<-table.row.end(a)
a<-table.row.start(a)
a<-table.element(a,'beta',header=TRUE)
a<-table.element(a,lm1$coefficients[[2]])
a<-table.row.end(a)
a<-table.row.start(a)
a<-table.element(a,'S.D.',header=TRUE)
a<-table.element(a,summary(lm1)$coefficients[2,2])
a<-table.row.end(a)
a<-table.row.start(a)
a<-table.element(a,'T-STAT',header=TRUE)
a<-table.element(a,summary(lm1)$coefficients[2,3])
a<-table.row.end(a)
a<-table.row.start(a)
a<-table.element(a,'p-value',header=TRUE)
a<-table.element(a,summary(lm1)$coefficients[2,4])
a<-table.row.end(a)
a<-table.end(a)
table.save(a,file='mytable1.tab')
a<-table.start()
a<-table.row.start(a)
a<-table.element(a,'Regression: ln S.E.(k) = alpha + beta * ln Mean(k)',2,TRUE)
a<-table.row.end(a)
a<-table.row.start(a)
a<-table.element(a,'alpha',header=TRUE)
a<-table.element(a,lnlm1$coefficients[[1]])
a<-table.row.end(a)
a<-table.row.start(a)
a<-table.element(a,'beta',header=TRUE)
a<-table.element(a,lnlm1$coefficients[[2]])
a<-table.row.end(a)
a<-table.row.start(a)
a<-table.element(a,'S.D.',header=TRUE)
a<-table.element(a,summary(lnlm1)$coefficients[2,2])
a<-table.row.end(a)
a<-table.row.start(a)
a<-table.element(a,'T-STAT',header=TRUE)
a<-table.element(a,summary(lnlm1)$coefficients[2,3])
a<-table.row.end(a)
a<-table.row.start(a)
a<-table.element(a,'p-value',header=TRUE)
a<-table.element(a,summary(lnlm1)$coefficients[2,4])
a<-table.row.end(a)
a<-table.row.start(a)
a<-table.element(a,'Lambda',header=TRUE)
a<-table.element(a,1-lnlm1$coefficients[[2]])
a<-table.row.end(a)
a<-table.end(a)
table.save(a,file='mytable2.tab')