Free Statistics

of Irreproducible Research!

Author's title

Author*The author of this computation has been verified*
R Software Modulerwasp_autocorrelation.wasp
Title produced by software(Partial) Autocorrelation Function
Date of computationThu, 11 Dec 2014 15:26:57 +0000
Cite this page as followsStatistical Computations at FreeStatistics.org, Office for Research Development and Education, URL https://freestatistics.org/blog/index.php?v=date/2014/Dec/11/t1418311633a8ewojzknql3xnz.htm/, Retrieved Thu, 16 May 2024 14:31:24 +0000
Statistical Computations at FreeStatistics.org, Office for Research Development and Education, URL https://freestatistics.org/blog/index.php?pk=266117, Retrieved Thu, 16 May 2024 14:31:24 +0000
QR Codes:

Original text written by user:
IsPrivate?No (this computation is public)
User-defined keywords
Estimated Impact64
Family? (F = Feedback message, R = changed R code, M = changed R Module, P = changed Parameters, D = changed Data)
-       [(Partial) Autocorrelation Function] [fshs] [2014-12-11 15:26:57] [7de4f24d5c21ad7c83693f758b02221d] [Current]
Feedback Forum

Post a new message
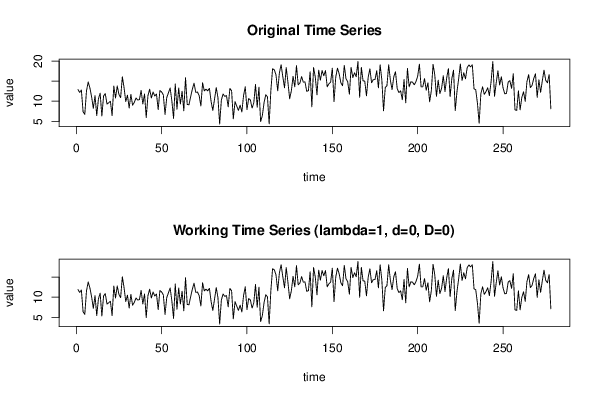
Dataseries X:
12.9
12.2
12.8
7.4
6.7
12.6
14.8
13.3
11.1
8.2
11.4
6.4
10.6
12.0
6.3
11.3
11.9
9.3
9.6
10.0
6.4
13.8
10.8
13.8
11.7
10.9
16.1
13.4
9.9
11.5
8.3
11.7
9.0
9.7
10.8
10.3
10.4
12.7
9.3
11.8
5.9
11.4
13.0
10.8
12.3
11.3
11.8
7.9
12.7
12.3
11.6
6.7
10.9
12.1
13.3
10.1
5.7
14.3
8.0
13.3
9.3
12.5
7.6
15.9
9.2
9.1
11.1
13.0
14.5
12.2
12.3
11.4
8.8
14.6
12.6
13.0
12.6
13.2
9.9
7.7
10.5
13.4
10.9
4.3
10.3
11.8
11.2
11.4
8.6
13.2
12.6
5.6
9.9
8.8
7.7
9.0
7.3
11.4
13.6
7.9
10.7
10.3
8.3
9.6
14.2
8.5
13.5
4.9
6.4
9.6
11.6
11.1
4.35
12.7
18.1
17.85
16.6
12.6
17.1
19.1
16.1
13.35
18.4
14.7
10.6
12.6
16.2
13.6
18.9
14.1
14.5
16.15
14.75
14.8
12.45
12.65
17.35
8.6
18.4
16.1
11.6
17.75
15.25
17.65
16.35
17.65
13.6
14.35
14.75
18.25
9.9
16
18.25
16.85
14.6
13.85
18.95
15.6
14.85
11.75
18.45
15.9
17.1
16.1
19.9
10.95
18.45
15.1
15
11.35
15.95
18.1
14.6
15.4
15.4
17.6
13.35
19.1
15.35
7.6
13.4
13.9
19.1
15.25
12.9
16.1
17.35
13.15
12.15
12.6
10.35
15.4
9.6
18.2
13.6
14.85
14.75
14.1
14.9
16.25
19.25
13.6
13.6
15.65
12.75
14.6
9.85
12.65
19.2
16.6
11.2
15.25
11.9
13.2
16.35
12.4
15.85
18.15
11.15
15.65
17.75
7.65
12.35
15.6
19.3
15.2
17.1
15.6
18.4
19.05
18.55
19.1
13.1
12.85
9.5
4.5
11.85
13.6
11.7
12.4
13.35
11.4
14.9
19.9
11.2
14.6
17.6
14.05
16.1
13.35
11.85
11.95
14.75
15.15
13.2
16.85
7.85
7.7
12.6
7.85
10.95
12.35
9.95
14.9
16.65
13.4
13.95
15.7
16.85
10.95
15.35
12.2
15.1
17.75
15.2
14.6
16.65
8.1


Summary of computational transaction
Raw Inputview raw input (R code)
Raw Outputview raw output of R engine
Computing time2 seconds
R Server'Sir Maurice George Kendall' @ kendall.wessa.net

\begin{tabular}{lllllllll}
\hline
Summary of computational transaction \tabularnewline
Raw Input & view raw input (R code)  \tabularnewline
Raw Output & view raw output of R engine  \tabularnewline
Computing time & 2 seconds \tabularnewline
R Server & 'Sir Maurice George Kendall' @ kendall.wessa.net \tabularnewline
\hline
\end{tabular}
%Source: https://freestatistics.org/blog/index.php?pk=266117&T=0

[TABLE]
[ROW][C]Summary of computational transaction[/C][/ROW]
[ROW][C]Raw Input[/C][C]view raw input (R code) [/C][/ROW]
[ROW][C]Raw Output[/C][C]view raw output of R engine [/C][/ROW]
[ROW][C]Computing time[/C][C]2 seconds[/C][/ROW]
[ROW][C]R Server[/C][C]'Sir Maurice George Kendall' @ kendall.wessa.net[/C][/ROW]
[/TABLE]
Source: https://freestatistics.org/blog/index.php?pk=266117&T=0

Globally Unique Identifier (entire table): ba.freestatistics.org/blog/index.php?pk=266117&T=0

As an alternative you can also use a QR Code:  

The GUIDs for individual cells are displayed in the table below:

Summary of computational transaction
Raw Inputview raw input (R code)
Raw Outputview raw output of R engine
Computing time2 seconds
R Server'Sir Maurice George Kendall' @ kendall.wessa.net


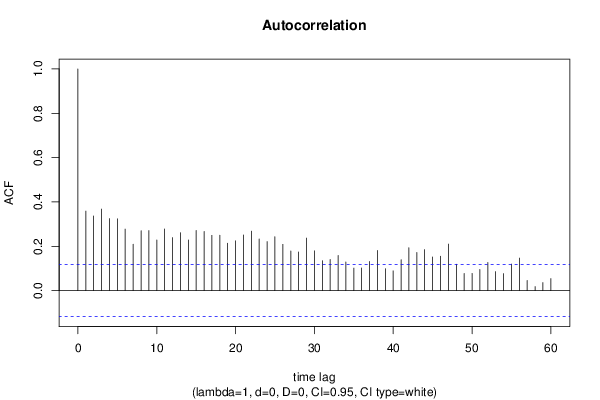
Autocorrelation Function
Time lag kACF(k)T-STATP-value
10.358515.97760
20.3367195.61420
30.3675686.12860
40.3248085.41560
50.3236675.39660
60.2774524.62613e-06
70.2094573.49230.000278
80.2697734.4985e-06
90.2707894.51495e-06
100.2286043.81168.5e-05
110.2776114.62873e-06
120.2389193.98364.3e-05
130.2608984.351e-05
140.2280363.80218.8e-05
150.2711034.52025e-06
160.2669214.45056e-06
170.2493434.15742.1e-05
180.2495164.16032.1e-05
190.2133483.55720.00022
200.2244333.7420.000111
210.2510024.1851.9e-05
220.2681874.47166e-06
230.2324913.87646.6e-05
240.2209543.6840.000138
250.2428054.04843.3e-05
260.2085743.47760.000293
270.1788012.98120.001563
280.1742052.90460.001986
290.2368783.94965e-05
300.1791372.98680.001535
310.1348212.24790.012683
320.1405072.34270.009924
330.1584012.64110.004366
340.1293152.15610.015966
350.101481.6920.045883
360.1021421.7030.044839
370.1315962.19410.014526
380.1811043.01960.001383
390.098371.64010.051053
400.0890421.48460.069387
410.1390812.31890.010562
420.1929783.21760.000723
430.1717952.86440.002248
440.1848663.08230.00113
450.1518752.53230.005942
460.1548152.58130.005178
470.2098783.49940.000271
480.1185771.97710.02451
490.0775221.29250.098621
500.0775791.29350.098457
510.0951881.58710.056812
520.1268722.11540.017644
530.085681.42860.077125
540.0766791.27850.101072
550.1193621.99020.023776
560.1466712.44550.007543
570.0455850.760.223936
580.0179130.29870.382709
590.0360420.60090.274183
600.054230.90420.183338

\begin{tabular}{lllllllll}
\hline
Autocorrelation Function \tabularnewline
Time lag k & ACF(k) & T-STAT & P-value \tabularnewline
1 & 0.35851 & 5.9776 & 0 \tabularnewline
2 & 0.336719 & 5.6142 & 0 \tabularnewline
3 & 0.367568 & 6.1286 & 0 \tabularnewline
4 & 0.324808 & 5.4156 & 0 \tabularnewline
5 & 0.323667 & 5.3966 & 0 \tabularnewline
6 & 0.277452 & 4.6261 & 3e-06 \tabularnewline
7 & 0.209457 & 3.4923 & 0.000278 \tabularnewline
8 & 0.269773 & 4.498 & 5e-06 \tabularnewline
9 & 0.270789 & 4.5149 & 5e-06 \tabularnewline
10 & 0.228604 & 3.8116 & 8.5e-05 \tabularnewline
11 & 0.277611 & 4.6287 & 3e-06 \tabularnewline
12 & 0.238919 & 3.9836 & 4.3e-05 \tabularnewline
13 & 0.260898 & 4.35 & 1e-05 \tabularnewline
14 & 0.228036 & 3.8021 & 8.8e-05 \tabularnewline
15 & 0.271103 & 4.5202 & 5e-06 \tabularnewline
16 & 0.266921 & 4.4505 & 6e-06 \tabularnewline
17 & 0.249343 & 4.1574 & 2.1e-05 \tabularnewline
18 & 0.249516 & 4.1603 & 2.1e-05 \tabularnewline
19 & 0.213348 & 3.5572 & 0.00022 \tabularnewline
20 & 0.224433 & 3.742 & 0.000111 \tabularnewline
21 & 0.251002 & 4.185 & 1.9e-05 \tabularnewline
22 & 0.268187 & 4.4716 & 6e-06 \tabularnewline
23 & 0.232491 & 3.8764 & 6.6e-05 \tabularnewline
24 & 0.220954 & 3.684 & 0.000138 \tabularnewline
25 & 0.242805 & 4.0484 & 3.3e-05 \tabularnewline
26 & 0.208574 & 3.4776 & 0.000293 \tabularnewline
27 & 0.178801 & 2.9812 & 0.001563 \tabularnewline
28 & 0.174205 & 2.9046 & 0.001986 \tabularnewline
29 & 0.236878 & 3.9496 & 5e-05 \tabularnewline
30 & 0.179137 & 2.9868 & 0.001535 \tabularnewline
31 & 0.134821 & 2.2479 & 0.012683 \tabularnewline
32 & 0.140507 & 2.3427 & 0.009924 \tabularnewline
33 & 0.158401 & 2.6411 & 0.004366 \tabularnewline
34 & 0.129315 & 2.1561 & 0.015966 \tabularnewline
35 & 0.10148 & 1.692 & 0.045883 \tabularnewline
36 & 0.102142 & 1.703 & 0.044839 \tabularnewline
37 & 0.131596 & 2.1941 & 0.014526 \tabularnewline
38 & 0.181104 & 3.0196 & 0.001383 \tabularnewline
39 & 0.09837 & 1.6401 & 0.051053 \tabularnewline
40 & 0.089042 & 1.4846 & 0.069387 \tabularnewline
41 & 0.139081 & 2.3189 & 0.010562 \tabularnewline
42 & 0.192978 & 3.2176 & 0.000723 \tabularnewline
43 & 0.171795 & 2.8644 & 0.002248 \tabularnewline
44 & 0.184866 & 3.0823 & 0.00113 \tabularnewline
45 & 0.151875 & 2.5323 & 0.005942 \tabularnewline
46 & 0.154815 & 2.5813 & 0.005178 \tabularnewline
47 & 0.209878 & 3.4994 & 0.000271 \tabularnewline
48 & 0.118577 & 1.9771 & 0.02451 \tabularnewline
49 & 0.077522 & 1.2925 & 0.098621 \tabularnewline
50 & 0.077579 & 1.2935 & 0.098457 \tabularnewline
51 & 0.095188 & 1.5871 & 0.056812 \tabularnewline
52 & 0.126872 & 2.1154 & 0.017644 \tabularnewline
53 & 0.08568 & 1.4286 & 0.077125 \tabularnewline
54 & 0.076679 & 1.2785 & 0.101072 \tabularnewline
55 & 0.119362 & 1.9902 & 0.023776 \tabularnewline
56 & 0.146671 & 2.4455 & 0.007543 \tabularnewline
57 & 0.045585 & 0.76 & 0.223936 \tabularnewline
58 & 0.017913 & 0.2987 & 0.382709 \tabularnewline
59 & 0.036042 & 0.6009 & 0.274183 \tabularnewline
60 & 0.05423 & 0.9042 & 0.183338 \tabularnewline
\hline
\end{tabular}
%Source: https://freestatistics.org/blog/index.php?pk=266117&T=1

[TABLE]
[ROW][C]Autocorrelation Function[/C][/ROW]
[ROW][C]Time lag k[/C][C]ACF(k)[/C][C]T-STAT[/C][C]P-value[/C][/ROW]
[ROW][C]1[/C][C]0.35851[/C][C]5.9776[/C][C]0[/C][/ROW]
[ROW][C]2[/C][C]0.336719[/C][C]5.6142[/C][C]0[/C][/ROW]
[ROW][C]3[/C][C]0.367568[/C][C]6.1286[/C][C]0[/C][/ROW]
[ROW][C]4[/C][C]0.324808[/C][C]5.4156[/C][C]0[/C][/ROW]
[ROW][C]5[/C][C]0.323667[/C][C]5.3966[/C][C]0[/C][/ROW]
[ROW][C]6[/C][C]0.277452[/C][C]4.6261[/C][C]3e-06[/C][/ROW]
[ROW][C]7[/C][C]0.209457[/C][C]3.4923[/C][C]0.000278[/C][/ROW]
[ROW][C]8[/C][C]0.269773[/C][C]4.498[/C][C]5e-06[/C][/ROW]
[ROW][C]9[/C][C]0.270789[/C][C]4.5149[/C][C]5e-06[/C][/ROW]
[ROW][C]10[/C][C]0.228604[/C][C]3.8116[/C][C]8.5e-05[/C][/ROW]
[ROW][C]11[/C][C]0.277611[/C][C]4.6287[/C][C]3e-06[/C][/ROW]
[ROW][C]12[/C][C]0.238919[/C][C]3.9836[/C][C]4.3e-05[/C][/ROW]
[ROW][C]13[/C][C]0.260898[/C][C]4.35[/C][C]1e-05[/C][/ROW]
[ROW][C]14[/C][C]0.228036[/C][C]3.8021[/C][C]8.8e-05[/C][/ROW]
[ROW][C]15[/C][C]0.271103[/C][C]4.5202[/C][C]5e-06[/C][/ROW]
[ROW][C]16[/C][C]0.266921[/C][C]4.4505[/C][C]6e-06[/C][/ROW]
[ROW][C]17[/C][C]0.249343[/C][C]4.1574[/C][C]2.1e-05[/C][/ROW]
[ROW][C]18[/C][C]0.249516[/C][C]4.1603[/C][C]2.1e-05[/C][/ROW]
[ROW][C]19[/C][C]0.213348[/C][C]3.5572[/C][C]0.00022[/C][/ROW]
[ROW][C]20[/C][C]0.224433[/C][C]3.742[/C][C]0.000111[/C][/ROW]
[ROW][C]21[/C][C]0.251002[/C][C]4.185[/C][C]1.9e-05[/C][/ROW]
[ROW][C]22[/C][C]0.268187[/C][C]4.4716[/C][C]6e-06[/C][/ROW]
[ROW][C]23[/C][C]0.232491[/C][C]3.8764[/C][C]6.6e-05[/C][/ROW]
[ROW][C]24[/C][C]0.220954[/C][C]3.684[/C][C]0.000138[/C][/ROW]
[ROW][C]25[/C][C]0.242805[/C][C]4.0484[/C][C]3.3e-05[/C][/ROW]
[ROW][C]26[/C][C]0.208574[/C][C]3.4776[/C][C]0.000293[/C][/ROW]
[ROW][C]27[/C][C]0.178801[/C][C]2.9812[/C][C]0.001563[/C][/ROW]
[ROW][C]28[/C][C]0.174205[/C][C]2.9046[/C][C]0.001986[/C][/ROW]
[ROW][C]29[/C][C]0.236878[/C][C]3.9496[/C][C]5e-05[/C][/ROW]
[ROW][C]30[/C][C]0.179137[/C][C]2.9868[/C][C]0.001535[/C][/ROW]
[ROW][C]31[/C][C]0.134821[/C][C]2.2479[/C][C]0.012683[/C][/ROW]
[ROW][C]32[/C][C]0.140507[/C][C]2.3427[/C][C]0.009924[/C][/ROW]
[ROW][C]33[/C][C]0.158401[/C][C]2.6411[/C][C]0.004366[/C][/ROW]
[ROW][C]34[/C][C]0.129315[/C][C]2.1561[/C][C]0.015966[/C][/ROW]
[ROW][C]35[/C][C]0.10148[/C][C]1.692[/C][C]0.045883[/C][/ROW]
[ROW][C]36[/C][C]0.102142[/C][C]1.703[/C][C]0.044839[/C][/ROW]
[ROW][C]37[/C][C]0.131596[/C][C]2.1941[/C][C]0.014526[/C][/ROW]
[ROW][C]38[/C][C]0.181104[/C][C]3.0196[/C][C]0.001383[/C][/ROW]
[ROW][C]39[/C][C]0.09837[/C][C]1.6401[/C][C]0.051053[/C][/ROW]
[ROW][C]40[/C][C]0.089042[/C][C]1.4846[/C][C]0.069387[/C][/ROW]
[ROW][C]41[/C][C]0.139081[/C][C]2.3189[/C][C]0.010562[/C][/ROW]
[ROW][C]42[/C][C]0.192978[/C][C]3.2176[/C][C]0.000723[/C][/ROW]
[ROW][C]43[/C][C]0.171795[/C][C]2.8644[/C][C]0.002248[/C][/ROW]
[ROW][C]44[/C][C]0.184866[/C][C]3.0823[/C][C]0.00113[/C][/ROW]
[ROW][C]45[/C][C]0.151875[/C][C]2.5323[/C][C]0.005942[/C][/ROW]
[ROW][C]46[/C][C]0.154815[/C][C]2.5813[/C][C]0.005178[/C][/ROW]
[ROW][C]47[/C][C]0.209878[/C][C]3.4994[/C][C]0.000271[/C][/ROW]
[ROW][C]48[/C][C]0.118577[/C][C]1.9771[/C][C]0.02451[/C][/ROW]
[ROW][C]49[/C][C]0.077522[/C][C]1.2925[/C][C]0.098621[/C][/ROW]
[ROW][C]50[/C][C]0.077579[/C][C]1.2935[/C][C]0.098457[/C][/ROW]
[ROW][C]51[/C][C]0.095188[/C][C]1.5871[/C][C]0.056812[/C][/ROW]
[ROW][C]52[/C][C]0.126872[/C][C]2.1154[/C][C]0.017644[/C][/ROW]
[ROW][C]53[/C][C]0.08568[/C][C]1.4286[/C][C]0.077125[/C][/ROW]
[ROW][C]54[/C][C]0.076679[/C][C]1.2785[/C][C]0.101072[/C][/ROW]
[ROW][C]55[/C][C]0.119362[/C][C]1.9902[/C][C]0.023776[/C][/ROW]
[ROW][C]56[/C][C]0.146671[/C][C]2.4455[/C][C]0.007543[/C][/ROW]
[ROW][C]57[/C][C]0.045585[/C][C]0.76[/C][C]0.223936[/C][/ROW]
[ROW][C]58[/C][C]0.017913[/C][C]0.2987[/C][C]0.382709[/C][/ROW]
[ROW][C]59[/C][C]0.036042[/C][C]0.6009[/C][C]0.274183[/C][/ROW]
[ROW][C]60[/C][C]0.05423[/C][C]0.9042[/C][C]0.183338[/C][/ROW]
[/TABLE]
Source: https://freestatistics.org/blog/index.php?pk=266117&T=1

Globally Unique Identifier (entire table): ba.freestatistics.org/blog/index.php?pk=266117&T=1

As an alternative you can also use a QR Code:  

The GUIDs for individual cells are displayed in the table below:

Autocorrelation Function
Time lag kACF(k)T-STATP-value
10.358515.97760
20.3367195.61420
30.3675686.12860
40.3248085.41560
50.3236675.39660
60.2774524.62613e-06
70.2094573.49230.000278
80.2697734.4985e-06
90.2707894.51495e-06
100.2286043.81168.5e-05
110.2776114.62873e-06
120.2389193.98364.3e-05
130.2608984.351e-05
140.2280363.80218.8e-05
150.2711034.52025e-06
160.2669214.45056e-06
170.2493434.15742.1e-05
180.2495164.16032.1e-05
190.2133483.55720.00022
200.2244333.7420.000111
210.2510024.1851.9e-05
220.2681874.47166e-06
230.2324913.87646.6e-05
240.2209543.6840.000138
250.2428054.04843.3e-05
260.2085743.47760.000293
270.1788012.98120.001563
280.1742052.90460.001986
290.2368783.94965e-05
300.1791372.98680.001535
310.1348212.24790.012683
320.1405072.34270.009924
330.1584012.64110.004366
340.1293152.15610.015966
350.101481.6920.045883
360.1021421.7030.044839
370.1315962.19410.014526
380.1811043.01960.001383
390.098371.64010.051053
400.0890421.48460.069387
410.1390812.31890.010562
420.1929783.21760.000723
430.1717952.86440.002248
440.1848663.08230.00113
450.1518752.53230.005942
460.1548152.58130.005178
470.2098783.49940.000271
480.1185771.97710.02451
490.0775221.29250.098621
500.0775791.29350.098457
510.0951881.58710.056812
520.1268722.11540.017644
530.085681.42860.077125
540.0766791.27850.101072
550.1193621.99020.023776
560.1466712.44550.007543
570.0455850.760.223936
580.0179130.29870.382709
590.0360420.60090.274183
600.054230.90420.183338


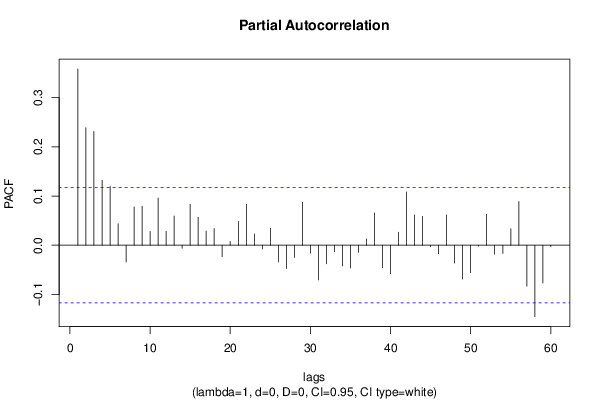
Partial Autocorrelation Function
Time lag kPACF(k)T-STATP-value
10.358515.97760
20.2388953.98324.3e-05
30.231273.8567.2e-05
40.1320622.20190.014246
50.1194441.99150.023701
60.0435370.72590.234252
7-0.033893-0.56510.286227
80.0775691.29330.098483
90.0791161.31910.094105
100.0280380.46750.320257
110.0960261.60110.055247
120.0284310.4740.317921
130.05930.98870.161829
14-0.006132-0.10220.459317
150.0832361.38780.08315
160.0566740.94490.172754
170.0287230.47890.316187
180.0341470.56930.284793
19-0.023583-0.39320.347235
200.0075170.12530.450173
210.0483440.80610.210448
220.0831361.38610.083406
230.0228530.3810.351732
24-0.007517-0.12530.450177
250.0342830.57160.284021
26-0.033947-0.5660.285922
27-0.047429-0.79080.214868
28-0.025182-0.41990.337451
290.0871831.45360.073588
30-0.016159-0.26940.393902
31-0.070747-1.17960.119587
32-0.037854-0.63120.26423
33-0.013284-0.22150.412437
34-0.042147-0.70270.241405
35-0.046282-0.77170.220483
36-0.01455-0.24260.404251
370.0126580.2110.416502
380.0652781.08840.138679
39-0.045623-0.76070.223745
40-0.057905-0.96550.167574
410.0265190.44220.32936
420.1080831.80210.036306
430.0615371.0260.152886
440.0586430.97780.164517
45-0.00306-0.0510.479672
46-0.017362-0.28950.386213
470.0615431.02610.152861
48-0.036301-0.60530.272752
49-0.06869-1.14530.126537
50-0.055866-0.93150.176209
51-0.001973-0.03290.486892
520.0630881.05190.146884
53-0.018118-0.30210.381406
54-0.016711-0.27860.390367
550.0333850.55660.289111
560.0886311.47780.0703
57-0.083341-1.38960.082885
58-0.145337-2.42320.008011
59-0.076986-1.28360.100172
60-0.002785-0.04640.481499

\begin{tabular}{lllllllll}
\hline
Partial Autocorrelation Function \tabularnewline
Time lag k & PACF(k) & T-STAT & P-value \tabularnewline
1 & 0.35851 & 5.9776 & 0 \tabularnewline
2 & 0.238895 & 3.9832 & 4.3e-05 \tabularnewline
3 & 0.23127 & 3.856 & 7.2e-05 \tabularnewline
4 & 0.132062 & 2.2019 & 0.014246 \tabularnewline
5 & 0.119444 & 1.9915 & 0.023701 \tabularnewline
6 & 0.043537 & 0.7259 & 0.234252 \tabularnewline
7 & -0.033893 & -0.5651 & 0.286227 \tabularnewline
8 & 0.077569 & 1.2933 & 0.098483 \tabularnewline
9 & 0.079116 & 1.3191 & 0.094105 \tabularnewline
10 & 0.028038 & 0.4675 & 0.320257 \tabularnewline
11 & 0.096026 & 1.6011 & 0.055247 \tabularnewline
12 & 0.028431 & 0.474 & 0.317921 \tabularnewline
13 & 0.0593 & 0.9887 & 0.161829 \tabularnewline
14 & -0.006132 & -0.1022 & 0.459317 \tabularnewline
15 & 0.083236 & 1.3878 & 0.08315 \tabularnewline
16 & 0.056674 & 0.9449 & 0.172754 \tabularnewline
17 & 0.028723 & 0.4789 & 0.316187 \tabularnewline
18 & 0.034147 & 0.5693 & 0.284793 \tabularnewline
19 & -0.023583 & -0.3932 & 0.347235 \tabularnewline
20 & 0.007517 & 0.1253 & 0.450173 \tabularnewline
21 & 0.048344 & 0.8061 & 0.210448 \tabularnewline
22 & 0.083136 & 1.3861 & 0.083406 \tabularnewline
23 & 0.022853 & 0.381 & 0.351732 \tabularnewline
24 & -0.007517 & -0.1253 & 0.450177 \tabularnewline
25 & 0.034283 & 0.5716 & 0.284021 \tabularnewline
26 & -0.033947 & -0.566 & 0.285922 \tabularnewline
27 & -0.047429 & -0.7908 & 0.214868 \tabularnewline
28 & -0.025182 & -0.4199 & 0.337451 \tabularnewline
29 & 0.087183 & 1.4536 & 0.073588 \tabularnewline
30 & -0.016159 & -0.2694 & 0.393902 \tabularnewline
31 & -0.070747 & -1.1796 & 0.119587 \tabularnewline
32 & -0.037854 & -0.6312 & 0.26423 \tabularnewline
33 & -0.013284 & -0.2215 & 0.412437 \tabularnewline
34 & -0.042147 & -0.7027 & 0.241405 \tabularnewline
35 & -0.046282 & -0.7717 & 0.220483 \tabularnewline
36 & -0.01455 & -0.2426 & 0.404251 \tabularnewline
37 & 0.012658 & 0.211 & 0.416502 \tabularnewline
38 & 0.065278 & 1.0884 & 0.138679 \tabularnewline
39 & -0.045623 & -0.7607 & 0.223745 \tabularnewline
40 & -0.057905 & -0.9655 & 0.167574 \tabularnewline
41 & 0.026519 & 0.4422 & 0.32936 \tabularnewline
42 & 0.108083 & 1.8021 & 0.036306 \tabularnewline
43 & 0.061537 & 1.026 & 0.152886 \tabularnewline
44 & 0.058643 & 0.9778 & 0.164517 \tabularnewline
45 & -0.00306 & -0.051 & 0.479672 \tabularnewline
46 & -0.017362 & -0.2895 & 0.386213 \tabularnewline
47 & 0.061543 & 1.0261 & 0.152861 \tabularnewline
48 & -0.036301 & -0.6053 & 0.272752 \tabularnewline
49 & -0.06869 & -1.1453 & 0.126537 \tabularnewline
50 & -0.055866 & -0.9315 & 0.176209 \tabularnewline
51 & -0.001973 & -0.0329 & 0.486892 \tabularnewline
52 & 0.063088 & 1.0519 & 0.146884 \tabularnewline
53 & -0.018118 & -0.3021 & 0.381406 \tabularnewline
54 & -0.016711 & -0.2786 & 0.390367 \tabularnewline
55 & 0.033385 & 0.5566 & 0.289111 \tabularnewline
56 & 0.088631 & 1.4778 & 0.0703 \tabularnewline
57 & -0.083341 & -1.3896 & 0.082885 \tabularnewline
58 & -0.145337 & -2.4232 & 0.008011 \tabularnewline
59 & -0.076986 & -1.2836 & 0.100172 \tabularnewline
60 & -0.002785 & -0.0464 & 0.481499 \tabularnewline
\hline
\end{tabular}
%Source: https://freestatistics.org/blog/index.php?pk=266117&T=2

[TABLE]
[ROW][C]Partial Autocorrelation Function[/C][/ROW]
[ROW][C]Time lag k[/C][C]PACF(k)[/C][C]T-STAT[/C][C]P-value[/C][/ROW]
[ROW][C]1[/C][C]0.35851[/C][C]5.9776[/C][C]0[/C][/ROW]
[ROW][C]2[/C][C]0.238895[/C][C]3.9832[/C][C]4.3e-05[/C][/ROW]
[ROW][C]3[/C][C]0.23127[/C][C]3.856[/C][C]7.2e-05[/C][/ROW]
[ROW][C]4[/C][C]0.132062[/C][C]2.2019[/C][C]0.014246[/C][/ROW]
[ROW][C]5[/C][C]0.119444[/C][C]1.9915[/C][C]0.023701[/C][/ROW]
[ROW][C]6[/C][C]0.043537[/C][C]0.7259[/C][C]0.234252[/C][/ROW]
[ROW][C]7[/C][C]-0.033893[/C][C]-0.5651[/C][C]0.286227[/C][/ROW]
[ROW][C]8[/C][C]0.077569[/C][C]1.2933[/C][C]0.098483[/C][/ROW]
[ROW][C]9[/C][C]0.079116[/C][C]1.3191[/C][C]0.094105[/C][/ROW]
[ROW][C]10[/C][C]0.028038[/C][C]0.4675[/C][C]0.320257[/C][/ROW]
[ROW][C]11[/C][C]0.096026[/C][C]1.6011[/C][C]0.055247[/C][/ROW]
[ROW][C]12[/C][C]0.028431[/C][C]0.474[/C][C]0.317921[/C][/ROW]
[ROW][C]13[/C][C]0.0593[/C][C]0.9887[/C][C]0.161829[/C][/ROW]
[ROW][C]14[/C][C]-0.006132[/C][C]-0.1022[/C][C]0.459317[/C][/ROW]
[ROW][C]15[/C][C]0.083236[/C][C]1.3878[/C][C]0.08315[/C][/ROW]
[ROW][C]16[/C][C]0.056674[/C][C]0.9449[/C][C]0.172754[/C][/ROW]
[ROW][C]17[/C][C]0.028723[/C][C]0.4789[/C][C]0.316187[/C][/ROW]
[ROW][C]18[/C][C]0.034147[/C][C]0.5693[/C][C]0.284793[/C][/ROW]
[ROW][C]19[/C][C]-0.023583[/C][C]-0.3932[/C][C]0.347235[/C][/ROW]
[ROW][C]20[/C][C]0.007517[/C][C]0.1253[/C][C]0.450173[/C][/ROW]
[ROW][C]21[/C][C]0.048344[/C][C]0.8061[/C][C]0.210448[/C][/ROW]
[ROW][C]22[/C][C]0.083136[/C][C]1.3861[/C][C]0.083406[/C][/ROW]
[ROW][C]23[/C][C]0.022853[/C][C]0.381[/C][C]0.351732[/C][/ROW]
[ROW][C]24[/C][C]-0.007517[/C][C]-0.1253[/C][C]0.450177[/C][/ROW]
[ROW][C]25[/C][C]0.034283[/C][C]0.5716[/C][C]0.284021[/C][/ROW]
[ROW][C]26[/C][C]-0.033947[/C][C]-0.566[/C][C]0.285922[/C][/ROW]
[ROW][C]27[/C][C]-0.047429[/C][C]-0.7908[/C][C]0.214868[/C][/ROW]
[ROW][C]28[/C][C]-0.025182[/C][C]-0.4199[/C][C]0.337451[/C][/ROW]
[ROW][C]29[/C][C]0.087183[/C][C]1.4536[/C][C]0.073588[/C][/ROW]
[ROW][C]30[/C][C]-0.016159[/C][C]-0.2694[/C][C]0.393902[/C][/ROW]
[ROW][C]31[/C][C]-0.070747[/C][C]-1.1796[/C][C]0.119587[/C][/ROW]
[ROW][C]32[/C][C]-0.037854[/C][C]-0.6312[/C][C]0.26423[/C][/ROW]
[ROW][C]33[/C][C]-0.013284[/C][C]-0.2215[/C][C]0.412437[/C][/ROW]
[ROW][C]34[/C][C]-0.042147[/C][C]-0.7027[/C][C]0.241405[/C][/ROW]
[ROW][C]35[/C][C]-0.046282[/C][C]-0.7717[/C][C]0.220483[/C][/ROW]
[ROW][C]36[/C][C]-0.01455[/C][C]-0.2426[/C][C]0.404251[/C][/ROW]
[ROW][C]37[/C][C]0.012658[/C][C]0.211[/C][C]0.416502[/C][/ROW]
[ROW][C]38[/C][C]0.065278[/C][C]1.0884[/C][C]0.138679[/C][/ROW]
[ROW][C]39[/C][C]-0.045623[/C][C]-0.7607[/C][C]0.223745[/C][/ROW]
[ROW][C]40[/C][C]-0.057905[/C][C]-0.9655[/C][C]0.167574[/C][/ROW]
[ROW][C]41[/C][C]0.026519[/C][C]0.4422[/C][C]0.32936[/C][/ROW]
[ROW][C]42[/C][C]0.108083[/C][C]1.8021[/C][C]0.036306[/C][/ROW]
[ROW][C]43[/C][C]0.061537[/C][C]1.026[/C][C]0.152886[/C][/ROW]
[ROW][C]44[/C][C]0.058643[/C][C]0.9778[/C][C]0.164517[/C][/ROW]
[ROW][C]45[/C][C]-0.00306[/C][C]-0.051[/C][C]0.479672[/C][/ROW]
[ROW][C]46[/C][C]-0.017362[/C][C]-0.2895[/C][C]0.386213[/C][/ROW]
[ROW][C]47[/C][C]0.061543[/C][C]1.0261[/C][C]0.152861[/C][/ROW]
[ROW][C]48[/C][C]-0.036301[/C][C]-0.6053[/C][C]0.272752[/C][/ROW]
[ROW][C]49[/C][C]-0.06869[/C][C]-1.1453[/C][C]0.126537[/C][/ROW]
[ROW][C]50[/C][C]-0.055866[/C][C]-0.9315[/C][C]0.176209[/C][/ROW]
[ROW][C]51[/C][C]-0.001973[/C][C]-0.0329[/C][C]0.486892[/C][/ROW]
[ROW][C]52[/C][C]0.063088[/C][C]1.0519[/C][C]0.146884[/C][/ROW]
[ROW][C]53[/C][C]-0.018118[/C][C]-0.3021[/C][C]0.381406[/C][/ROW]
[ROW][C]54[/C][C]-0.016711[/C][C]-0.2786[/C][C]0.390367[/C][/ROW]
[ROW][C]55[/C][C]0.033385[/C][C]0.5566[/C][C]0.289111[/C][/ROW]
[ROW][C]56[/C][C]0.088631[/C][C]1.4778[/C][C]0.0703[/C][/ROW]
[ROW][C]57[/C][C]-0.083341[/C][C]-1.3896[/C][C]0.082885[/C][/ROW]
[ROW][C]58[/C][C]-0.145337[/C][C]-2.4232[/C][C]0.008011[/C][/ROW]
[ROW][C]59[/C][C]-0.076986[/C][C]-1.2836[/C][C]0.100172[/C][/ROW]
[ROW][C]60[/C][C]-0.002785[/C][C]-0.0464[/C][C]0.481499[/C][/ROW]
[/TABLE]
Source: https://freestatistics.org/blog/index.php?pk=266117&T=2

Globally Unique Identifier (entire table): ba.freestatistics.org/blog/index.php?pk=266117&T=2

As an alternative you can also use a QR Code:  

The GUIDs for individual cells are displayed in the table below:

Partial Autocorrelation Function
Time lag kPACF(k)T-STATP-value
10.358515.97760
20.2388953.98324.3e-05
30.231273.8567.2e-05
40.1320622.20190.014246
50.1194441.99150.023701
60.0435370.72590.234252
7-0.033893-0.56510.286227
80.0775691.29330.098483
90.0791161.31910.094105
100.0280380.46750.320257
110.0960261.60110.055247
120.0284310.4740.317921
130.05930.98870.161829
14-0.006132-0.10220.459317
150.0832361.38780.08315
160.0566740.94490.172754
170.0287230.47890.316187
180.0341470.56930.284793
19-0.023583-0.39320.347235
200.0075170.12530.450173
210.0483440.80610.210448
220.0831361.38610.083406
230.0228530.3810.351732
24-0.007517-0.12530.450177
250.0342830.57160.284021
26-0.033947-0.5660.285922
27-0.047429-0.79080.214868
28-0.025182-0.41990.337451
290.0871831.45360.073588
30-0.016159-0.26940.393902
31-0.070747-1.17960.119587
32-0.037854-0.63120.26423
33-0.013284-0.22150.412437
34-0.042147-0.70270.241405
35-0.046282-0.77170.220483
36-0.01455-0.24260.404251
370.0126580.2110.416502
380.0652781.08840.138679
39-0.045623-0.76070.223745
40-0.057905-0.96550.167574
410.0265190.44220.32936
420.1080831.80210.036306
430.0615371.0260.152886
440.0586430.97780.164517
45-0.00306-0.0510.479672
46-0.017362-0.28950.386213
470.0615431.02610.152861
48-0.036301-0.60530.272752
49-0.06869-1.14530.126537
50-0.055866-0.93150.176209
51-0.001973-0.03290.486892
520.0630881.05190.146884
53-0.018118-0.30210.381406
54-0.016711-0.27860.390367
550.0333850.55660.289111
560.0886311.47780.0703
57-0.083341-1.38960.082885
58-0.145337-2.42320.008011
59-0.076986-1.28360.100172
60-0.002785-0.04640.481499


Parameters (Session):
par1 = 60 ; par2 = 1 ; par3 = 0 ; par4 = 0 ; par5 = 12 ; par6 = White Noise ; par7 = 0.95 ;
Parameters (R input):
par1 = 60 ; par2 = 1 ; par3 = 0 ; par4 = 0 ; par5 = 12 ; par6 = White Noise ; par7 = 0.95 ; par8 = ;
R code (references can be found in the software module):
par8 <- ''
par7 <- '0.95'
par6 <- 'White Noise'
par5 <- '12'
par4 <- '0'
par3 <- '0'
par2 <- '1'
par1 <- 'Default'
if (par1 == 'Default') {
par1 = 10*log10(length(x))
} else {
par1 <- as.numeric(par1)
}
par2 <- as.numeric(par2)
par3 <- as.numeric(par3)
par4 <- as.numeric(par4)
par5 <- as.numeric(par5)
if (par6 == 'White Noise') par6 <- 'white' else par6 <- 'ma'
par7 <- as.numeric(par7)
if (par8 != '') par8 <- as.numeric(par8)
ox <- x
if (par8 == '') {
if (par2 == 0) {
x <- log(x)
} else {
x <- (x ^ par2 - 1) / par2
}
} else {
x <- log(x,base=par8)
}
if (par3 > 0) x <- diff(x,lag=1,difference=par3)
if (par4 > 0) x <- diff(x,lag=par5,difference=par4)
bitmap(file='picts.png')
op <- par(mfrow=c(2,1))
plot(ox,type='l',main='Original Time Series',xlab='time',ylab='value')
if (par8=='') {
mytitle <- paste('Working Time Series (lambda=',par2,', d=',par3,', D=',par4,')',sep='')
mysub <- paste('(lambda=',par2,', d=',par3,', D=',par4,', CI=', par7, ', CI type=',par6,')',sep='')
} else {
mytitle <- paste('Working Time Series (base=',par8,', d=',par3,', D=',par4,')',sep='')
mysub <- paste('(base=',par8,', d=',par3,', D=',par4,', CI=', par7, ', CI type=',par6,')',sep='')
}
plot(x,type='l', main=mytitle,xlab='time',ylab='value')
par(op)
dev.off()
bitmap(file='pic1.png')
racf <- acf(x, par1, main='Autocorrelation', xlab='time lag', ylab='ACF', ci.type=par6, ci=par7, sub=mysub)
dev.off()
bitmap(file='pic2.png')
rpacf <- pacf(x,par1,main='Partial Autocorrelation',xlab='lags',ylab='PACF',sub=mysub)
dev.off()
(myacf <- c(racf$acf))
(mypacf <- c(rpacf$acf))
lengthx <- length(x)
sqrtn <- sqrt(lengthx)
load(file='createtable')
a<-table.start()
a<-table.row.start(a)
a<-table.element(a,'Autocorrelation Function',4,TRUE)
a<-table.row.end(a)
a<-table.row.start(a)
a<-table.element(a,'Time lag k',header=TRUE)
a<-table.element(a,hyperlink('basics.htm','ACF(k)','click here for more information about the Autocorrelation Function'),header=TRUE)
a<-table.element(a,'T-STAT',header=TRUE)
a<-table.element(a,'P-value',header=TRUE)
a<-table.row.end(a)
for (i in 2:(par1+1)) {
a<-table.row.start(a)
a<-table.element(a,i-1,header=TRUE)
a<-table.element(a,round(myacf[i],6))
mytstat <- myacf[i]*sqrtn
a<-table.element(a,round(mytstat,4))
a<-table.element(a,round(1-pt(abs(mytstat),lengthx),6))
a<-table.row.end(a)
}
a<-table.end(a)
table.save(a,file='mytable.tab')
a<-table.start()
a<-table.row.start(a)
a<-table.element(a,'Partial Autocorrelation Function',4,TRUE)
a<-table.row.end(a)
a<-table.row.start(a)
a<-table.element(a,'Time lag k',header=TRUE)
a<-table.element(a,hyperlink('basics.htm','PACF(k)','click here for more information about the Partial Autocorrelation Function'),header=TRUE)
a<-table.element(a,'T-STAT',header=TRUE)
a<-table.element(a,'P-value',header=TRUE)
a<-table.row.end(a)
for (i in 1:par1) {
a<-table.row.start(a)
a<-table.element(a,i,header=TRUE)
a<-table.element(a,round(mypacf[i],6))
mytstat <- mypacf[i]*sqrtn
a<-table.element(a,round(mytstat,4))
a<-table.element(a,round(1-pt(abs(mytstat),lengthx),6))
a<-table.row.end(a)
}
a<-table.end(a)
table.save(a,file='mytable1.tab')