Free Statistics

of Irreproducible Research!

Author's title

Author*The author of this computation has been verified*
R Software Modulerwasp_One Factor ANOVA.wasp
Title produced by softwareOne-Way-Between-Groups ANOVA- Free Statistics Software (Calculator)
Date of computationThu, 11 Dec 2014 18:28:58 +0000
Cite this page as followsStatistical Computations at FreeStatistics.org, Office for Research Development and Education, URL https://freestatistics.org/blog/index.php?v=date/2014/Dec/11/t14183226442gny6amp1056ilo.htm/, Retrieved Thu, 16 May 2024 20:52:51 +0000
Statistical Computations at FreeStatistics.org, Office for Research Development and Education, URL https://freestatistics.org/blog/index.php?pk=266255, Retrieved Thu, 16 May 2024 20:52:51 +0000
QR Codes:

Original text written by user:
IsPrivate?No (this computation is public)
User-defined keywords
Estimated Impact72
Family? (F = Feedback message, R = changed R code, M = changed R Module, P = changed Parameters, D = changed Data)
-       [One-Way-Between-Groups ANOVA- Free Statistics Software (Calculator)] [] [2014-12-11 18:28:58] [f8081e57f48fffedb891dd68b4ffae29] [Current]
Feedback Forum

Post a new message
Dataseries X:
12.9 12
12.2 8
12.8 11
7.4 13
6.7 11
12.6 10
14.8 7
13.3 10
11.1 15
8.2 12
11.4 12
6.4 10
10.6 10
12 14
6.3 6
11.3 12
11.9 14
9.3 11
9.6 8
10 12
6.4 15
13.8 13
10.8 11
13.8 12
11.7 7
10.9 11
16.1 7
13.4 12
9.9 12
11.5 13
8.3 9
11.7 11
9 12
9.7 15
10.8 12
10.3 6
10.4 5
12.7 13
9.3 11
11.8 6
5.9 12
11.4 10
13 6
10.8 12
12.3 11
11.3 6
11.8 12
7.9 12
12.7 8
12.3 10
11.6 11
6.7 7
10.9 12
12.1 13
13.3 14
10.1 12
5.7 6
14.3 14
8 10
13.3 12
9.3 11
12.5 10
7.6 7
15.9 12
9.2 7
9.1 12
11.1 12
13 10
14.5 10
12.2 12
12.3 12
11.4 12
8.8 8
14.6 10
12.6 5
13 10
12.6 12
13.2 11
9.9 9
7.7 12
10.5 11
13.4 10
10.9 12
4.3 10
10.3 9
11.8 11
11.2 12
11.4 7
8.6 11
13.2 12
12.6 6
5.6 9
9.9 15
8.8 10
7.7 11
9 12
7.3 12
11.4 12
13.6 11
7.9 9
10.7 11
10.3 12
8.3 12
9.6 14
14.2 8
8.5 10
13.5 9
4.9 10
6.4 9
9.6 10
11.6 12
11.1 11
4.35 9
12.7 11
18.1 12
17.85 12
16.6 7
12.6 12
17.1 12
19.1 12
16.1 10
13.35 15
18.4 10
14.7 15
10.6 10
12.6 15
16.2 9
13.6 15
18.9 12
14.1 13
14.5 12
16.15 12
14.75 8
14.8 9
12.45 15
12.65 12
17.35 12
8.6 15
18.4 11
16.1 12
11.6 6
17.75 14
15.25 12
17.65 12
16.35 12
17.65 11
13.6 12
14.35 12
14.75 12
18.25 12
9.9 8
16 8
18.25 12
16.85 12
14.6 11
13.85 10
18.95 11
15.6 12
14.85 13
11.75 12
18.45 12
15.9 10
17.1 10
16.1 11
19.9 8
10.95 12
18.45 9
15.1 12
15 9
11.35 11
15.95 15
18.1 8
14.6 8
15.4 11
15.4 11
17.6 11
13.35 13
19.1 7
15.35 12
7.6 8
13.4 8
13.9 4
19.1 11
15.25 10
12.9 7
16.1 12
17.35 11
13.15 9
12.15 10
12.6 8
10.35 8
15.4 11
9.6 12
18.2 10
13.6 10
14.85 12
14.75 8
14.1 11
14.9 8
16.25 10
19.25 14
13.6 9
13.6 9
15.65 10
12.75 13
14.6 12
9.85 13
12.65 8
19.2 3
16.6 8
11.2 12
15.25 11
11.9 9
13.2 12
16.35 12
12.4 12
15.85 10
18.15 13
11.15 9
15.65 12
17.75 11
7.65 14
12.35 11
15.6 9
19.3 12
15.2 8
17.1 15
15.6 12
18.4 14
19.05 12
18.55 9
19.1 9
13.1 13
12.85 13
9.5 15
4.5 11
11.85 7
13.6 10
11.7 11
12.4 14
13.35 14
11.4 13
14.9 12
19.9 8
11.2 13
14.6 9
17.6 12
14.05 13
16.1 11
13.35 11
11.85 13
11.95 12
14.75 12
15.15 10
13.2 9
16.85 10
7.85 13
7.7 13
12.6 9
7.85 11
10.95 12
12.35 8
9.95 12
14.9 12
16.65 12
13.4 9
13.95 12
15.7 12
16.85 11
10.95 12
15.35 6
12.2 7
15.1 10
17.75 12
15.2 10
14.6 12
16.65 9
8.1 3


Summary of computational transaction
Raw Inputview raw input (R code)
Raw Outputview raw output of R engine
Computing time1 seconds
R Server'Sir Ronald Aylmer Fisher' @ fisher.wessa.net

\begin{tabular}{lllllllll}
\hline
Summary of computational transaction \tabularnewline
Raw Input & view raw input (R code)  \tabularnewline
Raw Output & view raw output of R engine  \tabularnewline
Computing time & 1 seconds \tabularnewline
R Server & 'Sir Ronald Aylmer Fisher' @ fisher.wessa.net \tabularnewline
\hline
\end{tabular}
%Source: https://freestatistics.org/blog/index.php?pk=266255&T=0

[TABLE]
[ROW][C]Summary of computational transaction[/C][/ROW]
[ROW][C]Raw Input[/C][C]view raw input (R code) [/C][/ROW]
[ROW][C]Raw Output[/C][C]view raw output of R engine [/C][/ROW]
[ROW][C]Computing time[/C][C]1 seconds[/C][/ROW]
[ROW][C]R Server[/C][C]'Sir Ronald Aylmer Fisher' @ fisher.wessa.net[/C][/ROW]
[/TABLE]
Source: https://freestatistics.org/blog/index.php?pk=266255&T=0

Globally Unique Identifier (entire table): ba.freestatistics.org/blog/index.php?pk=266255&T=0

As an alternative you can also use a QR Code:  

The GUIDs for individual cells are displayed in the table below:

Summary of computational transaction
Raw Inputview raw input (R code)
Raw Outputview raw output of R engine
Computing time1 seconds
R Server'Sir Ronald Aylmer Fisher' @ fisher.wessa.net


ANOVA Model
TOT ~ CONFSOFTTOT
means12.9580.010.48-0.8240.669-1.0390.6920.942-1.458-2.075-0.4460.726-0.246

\begin{tabular}{lllllllll}
\hline
ANOVA Model \tabularnewline
TOT  ~  CONFSOFTTOT \tabularnewline
means & 12.958 & 0.01 & 0.48 & -0.824 & 0.669 & -1.039 & 0.692 & 0.942 & -1.458 & -2.075 & -0.446 & 0.726 & -0.246 \tabularnewline
\hline
\end{tabular}
%Source: https://freestatistics.org/blog/index.php?pk=266255&T=1

[TABLE]
[ROW][C]ANOVA Model[/C][/ROW]
[ROW][C]TOT  ~  CONFSOFTTOT[/C][/ROW]
[ROW][C]means[/C][C]12.958[/C][C]0.01[/C][C]0.48[/C][C]-0.824[/C][C]0.669[/C][C]-1.039[/C][C]0.692[/C][C]0.942[/C][C]-1.458[/C][C]-2.075[/C][C]-0.446[/C][C]0.726[/C][C]-0.246[/C][/ROW]
[/TABLE]
Source: https://freestatistics.org/blog/index.php?pk=266255&T=1

Globally Unique Identifier (entire table): ba.freestatistics.org/blog/index.php?pk=266255&T=1

As an alternative you can also use a QR Code:  

The GUIDs for individual cells are displayed in the table below:

ANOVA Model
TOT ~ CONFSOFTTOT
means12.9580.010.48-0.8240.669-1.0390.6920.942-1.458-2.075-0.4460.726-0.246


ANOVA Statistics
DfSum SqMean SqF valuePr(>F)
CONFSOFTTOT12111.7529.3130.8010.649
Residuals2653079.75211.622

\begin{tabular}{lllllllll}
\hline
ANOVA Statistics \tabularnewline
  & Df & Sum Sq & Mean Sq & F value & Pr(>F) \tabularnewline
CONFSOFTTOT & 12 & 111.752 & 9.313 & 0.801 & 0.649 \tabularnewline
Residuals & 265 & 3079.752 & 11.622 &   &   \tabularnewline
\hline
\end{tabular}
%Source: https://freestatistics.org/blog/index.php?pk=266255&T=2

[TABLE]
[ROW][C]ANOVA Statistics[/C][/ROW]
[ROW][C] [/C][C]Df[/C][C]Sum Sq[/C][C]Mean Sq[/C][C]F value[/C][C]Pr(>F)[/C][/ROW]
[ROW][C]CONFSOFTTOT[/C][C]12[/C][C]111.752[/C][C]9.313[/C][C]0.801[/C][C]0.649[/C][/ROW]
[ROW][C]Residuals[/C][C]265[/C][C]3079.752[/C][C]11.622[/C][C] [/C][C] [/C][/ROW]
[/TABLE]
Source: https://freestatistics.org/blog/index.php?pk=266255&T=2

Globally Unique Identifier (entire table): ba.freestatistics.org/blog/index.php?pk=266255&T=2

As an alternative you can also use a QR Code:  

The GUIDs for individual cells are displayed in the table below:

ANOVA Statistics
DfSum SqMean SqF valuePr(>F)
CONFSOFTTOT12111.7529.3130.8010.649
Residuals2653079.75211.622


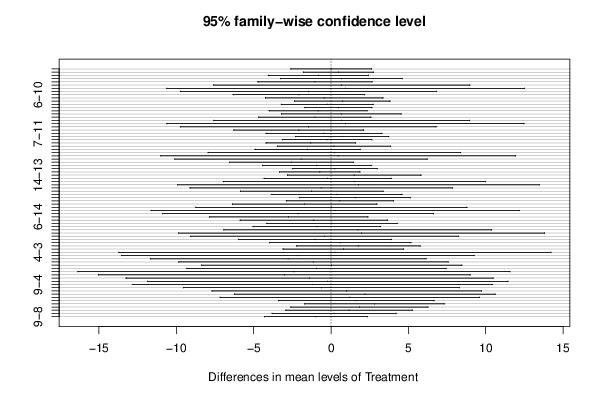
Tukey Honest Significant Difference Comparisons
difflwruprp adj
11-100.01-2.5932.6131
12-100.48-1.7862.7471
13-10-0.824-4.0562.4081
14-100.669-3.2584.5961
15-10-1.039-4.7272.6490.999
3-100.692-7.5898.9721
4-100.942-10.61312.4971
5-10-1.458-9.7396.8221
6-10-2.075-6.3232.1730.918
7-10-0.446-4.2453.3531
8-100.726-2.3593.811
9-10-0.246-3.2142.7211
12-110.471-1.6972.6381
13-11-0.834-3.9972.3291
14-110.659-3.2114.5291
15-11-1.049-4.6772.5790.999
3-110.682-7.5728.9351
4-110.932-10.60412.4681
5-11-1.468-9.7226.7851
6-11-2.085-6.2812.1110.908
7-11-0.456-4.1973.2851
8-110.716-2.2963.7281
9-11-0.256-3.1482.6361
13-12-1.305-4.1971.5880.953
14-120.188-3.4643.8411
15-12-1.52-4.9141.8750.956
3-120.211-7.9438.3651
4-120.461-11.00311.9261
5-12-1.939-10.0936.2151
6-12-2.555-6.5511.440.637
7-12-0.926-4.4412.5891
8-120.245-2.4812.9721
9-12-0.727-3.321.8660.999
14-131.493-2.8255.8110.995
15-13-0.215-4.3173.8871
3-131.516-6.9579.9891
4-131.766-9.92813.461
5-13-0.634-9.1077.8391
6-13-1.251-5.8633.3611
7-130.378-3.8244.5811
8-131.55-2.025.120.965
9-130.578-2.8914.0471
15-14-1.708-6.3772.9610.991
3-140.023-8.7398.7841
4-140.273-11.63212.1771
5-14-2.127-10.8896.6341
6-14-2.744-7.8672.3790.853
7-14-1.115-5.8723.6431
8-140.057-4.1524.2661
9-14-0.915-5.0393.2091
3-151.731-6.92610.3881
4-151.981-9.84713.8091
5-15-0.419-9.0768.2381
6-15-1.036-5.9783.9071
7-150.593-3.9695.1561
8-151.765-2.2225.7520.959
9-150.793-3.1054.691
4-30.25-13.70914.2091
5-3-2.15-13.5489.2481
6-3-2.767-11.6776.1430.998
7-3-1.137-9.8437.5681
8-30.034-8.3848.4521
9-3-0.938-9.3147.4381
5-4-2.4-16.35911.5591
6-4-3.017-15.0318.9981
7-4-1.387-13.25110.4761
8-4-0.216-11.8711.4381
9-4-1.188-12.81110.4351
6-5-0.617-9.5278.2931
7-51.012-7.6939.7181
8-52.184-6.23410.6021
9-51.212-7.1649.5881
7-61.629-3.3976.6550.997
8-62.801-1.7097.3110.681
9-61.829-2.6026.2590.976
8-71.172-2.9195.2620.999
9-70.199-3.8034.2021
9-8-0.972-4.3042.360.999

\begin{tabular}{lllllllll}
\hline
Tukey Honest Significant Difference Comparisons \tabularnewline
  & diff & lwr & upr & p adj \tabularnewline
11-10 & 0.01 & -2.593 & 2.613 & 1 \tabularnewline
12-10 & 0.48 & -1.786 & 2.747 & 1 \tabularnewline
13-10 & -0.824 & -4.056 & 2.408 & 1 \tabularnewline
14-10 & 0.669 & -3.258 & 4.596 & 1 \tabularnewline
15-10 & -1.039 & -4.727 & 2.649 & 0.999 \tabularnewline
3-10 & 0.692 & -7.589 & 8.972 & 1 \tabularnewline
4-10 & 0.942 & -10.613 & 12.497 & 1 \tabularnewline
5-10 & -1.458 & -9.739 & 6.822 & 1 \tabularnewline
6-10 & -2.075 & -6.323 & 2.173 & 0.918 \tabularnewline
7-10 & -0.446 & -4.245 & 3.353 & 1 \tabularnewline
8-10 & 0.726 & -2.359 & 3.81 & 1 \tabularnewline
9-10 & -0.246 & -3.214 & 2.721 & 1 \tabularnewline
12-11 & 0.471 & -1.697 & 2.638 & 1 \tabularnewline
13-11 & -0.834 & -3.997 & 2.329 & 1 \tabularnewline
14-11 & 0.659 & -3.211 & 4.529 & 1 \tabularnewline
15-11 & -1.049 & -4.677 & 2.579 & 0.999 \tabularnewline
3-11 & 0.682 & -7.572 & 8.935 & 1 \tabularnewline
4-11 & 0.932 & -10.604 & 12.468 & 1 \tabularnewline
5-11 & -1.468 & -9.722 & 6.785 & 1 \tabularnewline
6-11 & -2.085 & -6.281 & 2.111 & 0.908 \tabularnewline
7-11 & -0.456 & -4.197 & 3.285 & 1 \tabularnewline
8-11 & 0.716 & -2.296 & 3.728 & 1 \tabularnewline
9-11 & -0.256 & -3.148 & 2.636 & 1 \tabularnewline
13-12 & -1.305 & -4.197 & 1.588 & 0.953 \tabularnewline
14-12 & 0.188 & -3.464 & 3.841 & 1 \tabularnewline
15-12 & -1.52 & -4.914 & 1.875 & 0.956 \tabularnewline
3-12 & 0.211 & -7.943 & 8.365 & 1 \tabularnewline
4-12 & 0.461 & -11.003 & 11.926 & 1 \tabularnewline
5-12 & -1.939 & -10.093 & 6.215 & 1 \tabularnewline
6-12 & -2.555 & -6.551 & 1.44 & 0.637 \tabularnewline
7-12 & -0.926 & -4.441 & 2.589 & 1 \tabularnewline
8-12 & 0.245 & -2.481 & 2.972 & 1 \tabularnewline
9-12 & -0.727 & -3.32 & 1.866 & 0.999 \tabularnewline
14-13 & 1.493 & -2.825 & 5.811 & 0.995 \tabularnewline
15-13 & -0.215 & -4.317 & 3.887 & 1 \tabularnewline
3-13 & 1.516 & -6.957 & 9.989 & 1 \tabularnewline
4-13 & 1.766 & -9.928 & 13.46 & 1 \tabularnewline
5-13 & -0.634 & -9.107 & 7.839 & 1 \tabularnewline
6-13 & -1.251 & -5.863 & 3.361 & 1 \tabularnewline
7-13 & 0.378 & -3.824 & 4.581 & 1 \tabularnewline
8-13 & 1.55 & -2.02 & 5.12 & 0.965 \tabularnewline
9-13 & 0.578 & -2.891 & 4.047 & 1 \tabularnewline
15-14 & -1.708 & -6.377 & 2.961 & 0.991 \tabularnewline
3-14 & 0.023 & -8.739 & 8.784 & 1 \tabularnewline
4-14 & 0.273 & -11.632 & 12.177 & 1 \tabularnewline
5-14 & -2.127 & -10.889 & 6.634 & 1 \tabularnewline
6-14 & -2.744 & -7.867 & 2.379 & 0.853 \tabularnewline
7-14 & -1.115 & -5.872 & 3.643 & 1 \tabularnewline
8-14 & 0.057 & -4.152 & 4.266 & 1 \tabularnewline
9-14 & -0.915 & -5.039 & 3.209 & 1 \tabularnewline
3-15 & 1.731 & -6.926 & 10.388 & 1 \tabularnewline
4-15 & 1.981 & -9.847 & 13.809 & 1 \tabularnewline
5-15 & -0.419 & -9.076 & 8.238 & 1 \tabularnewline
6-15 & -1.036 & -5.978 & 3.907 & 1 \tabularnewline
7-15 & 0.593 & -3.969 & 5.156 & 1 \tabularnewline
8-15 & 1.765 & -2.222 & 5.752 & 0.959 \tabularnewline
9-15 & 0.793 & -3.105 & 4.69 & 1 \tabularnewline
4-3 & 0.25 & -13.709 & 14.209 & 1 \tabularnewline
5-3 & -2.15 & -13.548 & 9.248 & 1 \tabularnewline
6-3 & -2.767 & -11.677 & 6.143 & 0.998 \tabularnewline
7-3 & -1.137 & -9.843 & 7.568 & 1 \tabularnewline
8-3 & 0.034 & -8.384 & 8.452 & 1 \tabularnewline
9-3 & -0.938 & -9.314 & 7.438 & 1 \tabularnewline
5-4 & -2.4 & -16.359 & 11.559 & 1 \tabularnewline
6-4 & -3.017 & -15.031 & 8.998 & 1 \tabularnewline
7-4 & -1.387 & -13.251 & 10.476 & 1 \tabularnewline
8-4 & -0.216 & -11.87 & 11.438 & 1 \tabularnewline
9-4 & -1.188 & -12.811 & 10.435 & 1 \tabularnewline
6-5 & -0.617 & -9.527 & 8.293 & 1 \tabularnewline
7-5 & 1.012 & -7.693 & 9.718 & 1 \tabularnewline
8-5 & 2.184 & -6.234 & 10.602 & 1 \tabularnewline
9-5 & 1.212 & -7.164 & 9.588 & 1 \tabularnewline
7-6 & 1.629 & -3.397 & 6.655 & 0.997 \tabularnewline
8-6 & 2.801 & -1.709 & 7.311 & 0.681 \tabularnewline
9-6 & 1.829 & -2.602 & 6.259 & 0.976 \tabularnewline
8-7 & 1.172 & -2.919 & 5.262 & 0.999 \tabularnewline
9-7 & 0.199 & -3.803 & 4.202 & 1 \tabularnewline
9-8 & -0.972 & -4.304 & 2.36 & 0.999 \tabularnewline
\hline
\end{tabular}
%Source: https://freestatistics.org/blog/index.php?pk=266255&T=3

[TABLE]
[ROW][C]Tukey Honest Significant Difference Comparisons[/C][/ROW]
[ROW][C] [/C][C]diff[/C][C]lwr[/C][C]upr[/C][C]p adj[/C][/ROW]
[ROW][C]11-10[/C][C]0.01[/C][C]-2.593[/C][C]2.613[/C][C]1[/C][/ROW]
[ROW][C]12-10[/C][C]0.48[/C][C]-1.786[/C][C]2.747[/C][C]1[/C][/ROW]
[ROW][C]13-10[/C][C]-0.824[/C][C]-4.056[/C][C]2.408[/C][C]1[/C][/ROW]
[ROW][C]14-10[/C][C]0.669[/C][C]-3.258[/C][C]4.596[/C][C]1[/C][/ROW]
[ROW][C]15-10[/C][C]-1.039[/C][C]-4.727[/C][C]2.649[/C][C]0.999[/C][/ROW]
[ROW][C]3-10[/C][C]0.692[/C][C]-7.589[/C][C]8.972[/C][C]1[/C][/ROW]
[ROW][C]4-10[/C][C]0.942[/C][C]-10.613[/C][C]12.497[/C][C]1[/C][/ROW]
[ROW][C]5-10[/C][C]-1.458[/C][C]-9.739[/C][C]6.822[/C][C]1[/C][/ROW]
[ROW][C]6-10[/C][C]-2.075[/C][C]-6.323[/C][C]2.173[/C][C]0.918[/C][/ROW]
[ROW][C]7-10[/C][C]-0.446[/C][C]-4.245[/C][C]3.353[/C][C]1[/C][/ROW]
[ROW][C]8-10[/C][C]0.726[/C][C]-2.359[/C][C]3.81[/C][C]1[/C][/ROW]
[ROW][C]9-10[/C][C]-0.246[/C][C]-3.214[/C][C]2.721[/C][C]1[/C][/ROW]
[ROW][C]12-11[/C][C]0.471[/C][C]-1.697[/C][C]2.638[/C][C]1[/C][/ROW]
[ROW][C]13-11[/C][C]-0.834[/C][C]-3.997[/C][C]2.329[/C][C]1[/C][/ROW]
[ROW][C]14-11[/C][C]0.659[/C][C]-3.211[/C][C]4.529[/C][C]1[/C][/ROW]
[ROW][C]15-11[/C][C]-1.049[/C][C]-4.677[/C][C]2.579[/C][C]0.999[/C][/ROW]
[ROW][C]3-11[/C][C]0.682[/C][C]-7.572[/C][C]8.935[/C][C]1[/C][/ROW]
[ROW][C]4-11[/C][C]0.932[/C][C]-10.604[/C][C]12.468[/C][C]1[/C][/ROW]
[ROW][C]5-11[/C][C]-1.468[/C][C]-9.722[/C][C]6.785[/C][C]1[/C][/ROW]
[ROW][C]6-11[/C][C]-2.085[/C][C]-6.281[/C][C]2.111[/C][C]0.908[/C][/ROW]
[ROW][C]7-11[/C][C]-0.456[/C][C]-4.197[/C][C]3.285[/C][C]1[/C][/ROW]
[ROW][C]8-11[/C][C]0.716[/C][C]-2.296[/C][C]3.728[/C][C]1[/C][/ROW]
[ROW][C]9-11[/C][C]-0.256[/C][C]-3.148[/C][C]2.636[/C][C]1[/C][/ROW]
[ROW][C]13-12[/C][C]-1.305[/C][C]-4.197[/C][C]1.588[/C][C]0.953[/C][/ROW]
[ROW][C]14-12[/C][C]0.188[/C][C]-3.464[/C][C]3.841[/C][C]1[/C][/ROW]
[ROW][C]15-12[/C][C]-1.52[/C][C]-4.914[/C][C]1.875[/C][C]0.956[/C][/ROW]
[ROW][C]3-12[/C][C]0.211[/C][C]-7.943[/C][C]8.365[/C][C]1[/C][/ROW]
[ROW][C]4-12[/C][C]0.461[/C][C]-11.003[/C][C]11.926[/C][C]1[/C][/ROW]
[ROW][C]5-12[/C][C]-1.939[/C][C]-10.093[/C][C]6.215[/C][C]1[/C][/ROW]
[ROW][C]6-12[/C][C]-2.555[/C][C]-6.551[/C][C]1.44[/C][C]0.637[/C][/ROW]
[ROW][C]7-12[/C][C]-0.926[/C][C]-4.441[/C][C]2.589[/C][C]1[/C][/ROW]
[ROW][C]8-12[/C][C]0.245[/C][C]-2.481[/C][C]2.972[/C][C]1[/C][/ROW]
[ROW][C]9-12[/C][C]-0.727[/C][C]-3.32[/C][C]1.866[/C][C]0.999[/C][/ROW]
[ROW][C]14-13[/C][C]1.493[/C][C]-2.825[/C][C]5.811[/C][C]0.995[/C][/ROW]
[ROW][C]15-13[/C][C]-0.215[/C][C]-4.317[/C][C]3.887[/C][C]1[/C][/ROW]
[ROW][C]3-13[/C][C]1.516[/C][C]-6.957[/C][C]9.989[/C][C]1[/C][/ROW]
[ROW][C]4-13[/C][C]1.766[/C][C]-9.928[/C][C]13.46[/C][C]1[/C][/ROW]
[ROW][C]5-13[/C][C]-0.634[/C][C]-9.107[/C][C]7.839[/C][C]1[/C][/ROW]
[ROW][C]6-13[/C][C]-1.251[/C][C]-5.863[/C][C]3.361[/C][C]1[/C][/ROW]
[ROW][C]7-13[/C][C]0.378[/C][C]-3.824[/C][C]4.581[/C][C]1[/C][/ROW]
[ROW][C]8-13[/C][C]1.55[/C][C]-2.02[/C][C]5.12[/C][C]0.965[/C][/ROW]
[ROW][C]9-13[/C][C]0.578[/C][C]-2.891[/C][C]4.047[/C][C]1[/C][/ROW]
[ROW][C]15-14[/C][C]-1.708[/C][C]-6.377[/C][C]2.961[/C][C]0.991[/C][/ROW]
[ROW][C]3-14[/C][C]0.023[/C][C]-8.739[/C][C]8.784[/C][C]1[/C][/ROW]
[ROW][C]4-14[/C][C]0.273[/C][C]-11.632[/C][C]12.177[/C][C]1[/C][/ROW]
[ROW][C]5-14[/C][C]-2.127[/C][C]-10.889[/C][C]6.634[/C][C]1[/C][/ROW]
[ROW][C]6-14[/C][C]-2.744[/C][C]-7.867[/C][C]2.379[/C][C]0.853[/C][/ROW]
[ROW][C]7-14[/C][C]-1.115[/C][C]-5.872[/C][C]3.643[/C][C]1[/C][/ROW]
[ROW][C]8-14[/C][C]0.057[/C][C]-4.152[/C][C]4.266[/C][C]1[/C][/ROW]
[ROW][C]9-14[/C][C]-0.915[/C][C]-5.039[/C][C]3.209[/C][C]1[/C][/ROW]
[ROW][C]3-15[/C][C]1.731[/C][C]-6.926[/C][C]10.388[/C][C]1[/C][/ROW]
[ROW][C]4-15[/C][C]1.981[/C][C]-9.847[/C][C]13.809[/C][C]1[/C][/ROW]
[ROW][C]5-15[/C][C]-0.419[/C][C]-9.076[/C][C]8.238[/C][C]1[/C][/ROW]
[ROW][C]6-15[/C][C]-1.036[/C][C]-5.978[/C][C]3.907[/C][C]1[/C][/ROW]
[ROW][C]7-15[/C][C]0.593[/C][C]-3.969[/C][C]5.156[/C][C]1[/C][/ROW]
[ROW][C]8-15[/C][C]1.765[/C][C]-2.222[/C][C]5.752[/C][C]0.959[/C][/ROW]
[ROW][C]9-15[/C][C]0.793[/C][C]-3.105[/C][C]4.69[/C][C]1[/C][/ROW]
[ROW][C]4-3[/C][C]0.25[/C][C]-13.709[/C][C]14.209[/C][C]1[/C][/ROW]
[ROW][C]5-3[/C][C]-2.15[/C][C]-13.548[/C][C]9.248[/C][C]1[/C][/ROW]
[ROW][C]6-3[/C][C]-2.767[/C][C]-11.677[/C][C]6.143[/C][C]0.998[/C][/ROW]
[ROW][C]7-3[/C][C]-1.137[/C][C]-9.843[/C][C]7.568[/C][C]1[/C][/ROW]
[ROW][C]8-3[/C][C]0.034[/C][C]-8.384[/C][C]8.452[/C][C]1[/C][/ROW]
[ROW][C]9-3[/C][C]-0.938[/C][C]-9.314[/C][C]7.438[/C][C]1[/C][/ROW]
[ROW][C]5-4[/C][C]-2.4[/C][C]-16.359[/C][C]11.559[/C][C]1[/C][/ROW]
[ROW][C]6-4[/C][C]-3.017[/C][C]-15.031[/C][C]8.998[/C][C]1[/C][/ROW]
[ROW][C]7-4[/C][C]-1.387[/C][C]-13.251[/C][C]10.476[/C][C]1[/C][/ROW]
[ROW][C]8-4[/C][C]-0.216[/C][C]-11.87[/C][C]11.438[/C][C]1[/C][/ROW]
[ROW][C]9-4[/C][C]-1.188[/C][C]-12.811[/C][C]10.435[/C][C]1[/C][/ROW]
[ROW][C]6-5[/C][C]-0.617[/C][C]-9.527[/C][C]8.293[/C][C]1[/C][/ROW]
[ROW][C]7-5[/C][C]1.012[/C][C]-7.693[/C][C]9.718[/C][C]1[/C][/ROW]
[ROW][C]8-5[/C][C]2.184[/C][C]-6.234[/C][C]10.602[/C][C]1[/C][/ROW]
[ROW][C]9-5[/C][C]1.212[/C][C]-7.164[/C][C]9.588[/C][C]1[/C][/ROW]
[ROW][C]7-6[/C][C]1.629[/C][C]-3.397[/C][C]6.655[/C][C]0.997[/C][/ROW]
[ROW][C]8-6[/C][C]2.801[/C][C]-1.709[/C][C]7.311[/C][C]0.681[/C][/ROW]
[ROW][C]9-6[/C][C]1.829[/C][C]-2.602[/C][C]6.259[/C][C]0.976[/C][/ROW]
[ROW][C]8-7[/C][C]1.172[/C][C]-2.919[/C][C]5.262[/C][C]0.999[/C][/ROW]
[ROW][C]9-7[/C][C]0.199[/C][C]-3.803[/C][C]4.202[/C][C]1[/C][/ROW]
[ROW][C]9-8[/C][C]-0.972[/C][C]-4.304[/C][C]2.36[/C][C]0.999[/C][/ROW]
[/TABLE]
Source: https://freestatistics.org/blog/index.php?pk=266255&T=3

Globally Unique Identifier (entire table): ba.freestatistics.org/blog/index.php?pk=266255&T=3

As an alternative you can also use a QR Code:  

The GUIDs for individual cells are displayed in the table below:

Tukey Honest Significant Difference Comparisons
difflwruprp adj
11-100.01-2.5932.6131
12-100.48-1.7862.7471
13-10-0.824-4.0562.4081
14-100.669-3.2584.5961
15-10-1.039-4.7272.6490.999
3-100.692-7.5898.9721
4-100.942-10.61312.4971
5-10-1.458-9.7396.8221
6-10-2.075-6.3232.1730.918
7-10-0.446-4.2453.3531
8-100.726-2.3593.811
9-10-0.246-3.2142.7211
12-110.471-1.6972.6381
13-11-0.834-3.9972.3291
14-110.659-3.2114.5291
15-11-1.049-4.6772.5790.999
3-110.682-7.5728.9351
4-110.932-10.60412.4681
5-11-1.468-9.7226.7851
6-11-2.085-6.2812.1110.908
7-11-0.456-4.1973.2851
8-110.716-2.2963.7281
9-11-0.256-3.1482.6361
13-12-1.305-4.1971.5880.953
14-120.188-3.4643.8411
15-12-1.52-4.9141.8750.956
3-120.211-7.9438.3651
4-120.461-11.00311.9261
5-12-1.939-10.0936.2151
6-12-2.555-6.5511.440.637
7-12-0.926-4.4412.5891
8-120.245-2.4812.9721
9-12-0.727-3.321.8660.999
14-131.493-2.8255.8110.995
15-13-0.215-4.3173.8871
3-131.516-6.9579.9891
4-131.766-9.92813.461
5-13-0.634-9.1077.8391
6-13-1.251-5.8633.3611
7-130.378-3.8244.5811
8-131.55-2.025.120.965
9-130.578-2.8914.0471
15-14-1.708-6.3772.9610.991
3-140.023-8.7398.7841
4-140.273-11.63212.1771
5-14-2.127-10.8896.6341
6-14-2.744-7.8672.3790.853
7-14-1.115-5.8723.6431
8-140.057-4.1524.2661
9-14-0.915-5.0393.2091
3-151.731-6.92610.3881
4-151.981-9.84713.8091
5-15-0.419-9.0768.2381
6-15-1.036-5.9783.9071
7-150.593-3.9695.1561
8-151.765-2.2225.7520.959
9-150.793-3.1054.691
4-30.25-13.70914.2091
5-3-2.15-13.5489.2481
6-3-2.767-11.6776.1430.998
7-3-1.137-9.8437.5681
8-30.034-8.3848.4521
9-3-0.938-9.3147.4381
5-4-2.4-16.35911.5591
6-4-3.017-15.0318.9981
7-4-1.387-13.25110.4761
8-4-0.216-11.8711.4381
9-4-1.188-12.81110.4351
6-5-0.617-9.5278.2931
7-51.012-7.6939.7181
8-52.184-6.23410.6021
9-51.212-7.1649.5881
7-61.629-3.3976.6550.997
8-62.801-1.7097.3110.681
9-61.829-2.6026.2590.976
8-71.172-2.9195.2620.999
9-70.199-3.8034.2021
9-8-0.972-4.3042.360.999


Levenes Test for Homogeneity of Variance
DfF valuePr(>F)
Group120.9720.476
265

\begin{tabular}{lllllllll}
\hline
Levenes Test for Homogeneity of Variance \tabularnewline
  & Df & F value & Pr(>F) \tabularnewline
Group & 12 & 0.972 & 0.476 \tabularnewline
  & 265 &   &   \tabularnewline
\hline
\end{tabular}
%Source: https://freestatistics.org/blog/index.php?pk=266255&T=4

[TABLE]
[ROW][C]Levenes Test for Homogeneity of Variance[/C][/ROW]
[ROW][C] [/C][C]Df[/C][C]F value[/C][C]Pr(>F)[/C][/ROW]
[ROW][C]Group[/C][C]12[/C][C]0.972[/C][C]0.476[/C][/ROW]
[ROW][C] [/C][C]265[/C][C] [/C][C] [/C][/ROW]
[/TABLE]
Source: https://freestatistics.org/blog/index.php?pk=266255&T=4

Globally Unique Identifier (entire table): ba.freestatistics.org/blog/index.php?pk=266255&T=4

As an alternative you can also use a QR Code:  

The GUIDs for individual cells are displayed in the table below:

Levenes Test for Homogeneity of Variance
DfF valuePr(>F)
Group120.9720.476
265


Parameters (Session):
par1 = 1 ; par2 = 2 ; par3 = TRUE ;
Parameters (R input):
par1 = 1 ; par2 = 2 ; par3 = TRUE ;
R code (references can be found in the software module):
cat1 <- as.numeric(par1) #
cat2<- as.numeric(par2) #
intercept<-as.logical(par3)
x <- t(x)
x1<-as.numeric(x[,cat1])
f1<-as.character(x[,cat2])
xdf<-data.frame(x1,f1)
(V1<-dimnames(y)[[1]][cat1])
(V2<-dimnames(y)[[1]][cat2])
names(xdf)<-c('Response', 'Treatment')
if(intercept == FALSE) (lmxdf<-lm(Response ~ Treatment - 1, data = xdf) ) else (lmxdf<-lm(Response ~ Treatment, data = xdf) )
(aov.xdf<-aov(lmxdf) )
(anova.xdf<-anova(lmxdf) )
load(file='createtable')
a<-table.start()
a<-table.row.start(a)
a<-table.element(a,'ANOVA Model', length(lmxdf$coefficients)+1,TRUE)
a<-table.row.end(a)
a<-table.row.start(a)
a<-table.element(a, paste(V1, ' ~ ', V2), length(lmxdf$coefficients)+1,TRUE)
a<-table.row.end(a)
a<-table.row.start(a)
a<-table.element(a, 'means',,TRUE)
for(i in 1:length(lmxdf$coefficients)){
a<-table.element(a, round(lmxdf$coefficients[i], digits=3),,FALSE)
}
a<-table.row.end(a)
a<-table.end(a)
table.save(a,file='mytable.tab')
a<-table.start()
a<-table.row.start(a)
a<-table.element(a,'ANOVA Statistics', 5+1,TRUE)
a<-table.row.end(a)
a<-table.row.start(a)
a<-table.element(a, ' ',,TRUE)
a<-table.element(a, 'Df',,FALSE)
a<-table.element(a, 'Sum Sq',,FALSE)
a<-table.element(a, 'Mean Sq',,FALSE)
a<-table.element(a, 'F value',,FALSE)
a<-table.element(a, 'Pr(>F)',,FALSE)
a<-table.row.end(a)
a<-table.row.start(a)
a<-table.element(a, V2,,TRUE)
a<-table.element(a, anova.xdf$Df[1],,FALSE)
a<-table.element(a, round(anova.xdf$'Sum Sq'[1], digits=3),,FALSE)
a<-table.element(a, round(anova.xdf$'Mean Sq'[1], digits=3),,FALSE)
a<-table.element(a, round(anova.xdf$'F value'[1], digits=3),,FALSE)
a<-table.element(a, round(anova.xdf$'Pr(>F)'[1], digits=3),,FALSE)
a<-table.row.end(a)
a<-table.row.start(a)
a<-table.element(a, 'Residuals',,TRUE)
a<-table.element(a, anova.xdf$Df[2],,FALSE)
a<-table.element(a, round(anova.xdf$'Sum Sq'[2], digits=3),,FALSE)
a<-table.element(a, round(anova.xdf$'Mean Sq'[2], digits=3),,FALSE)
a<-table.element(a, ' ',,FALSE)
a<-table.row.end(a)
a<-table.end(a)
table.save(a,file='mytable1.tab')
bitmap(file='anovaplot.png')
boxplot(Response ~ Treatment, data=xdf, xlab=V2, ylab=V1)
dev.off()
if(intercept==TRUE){
'Tukey Plot'
thsd<-TukeyHSD(aov.xdf)
bitmap(file='TukeyHSDPlot.png')
plot(thsd)
dev.off()
}
if(intercept==TRUE){
a<-table.start()
a<-table.row.start(a)
a<-table.element(a,'Tukey Honest Significant Difference Comparisons', 5,TRUE)
a<-table.row.end(a)
a<-table.row.start(a)
a<-table.element(a, ' ', 1, TRUE)
for(i in 1:4){
a<-table.element(a,colnames(thsd[[1]])[i], 1, TRUE)
}
a<-table.row.end(a)
for(i in 1:length(rownames(thsd[[1]]))){
a<-table.row.start(a)
a<-table.element(a,rownames(thsd[[1]])[i], 1, TRUE)
for(j in 1:4){
a<-table.element(a,round(thsd[[1]][i,j], digits=3), 1, FALSE)
}
a<-table.row.end(a)
}
a<-table.end(a)
table.save(a,file='mytable2.tab')
}
if(intercept==FALSE){
a<-table.start()
a<-table.row.start(a)
a<-table.element(a,'TukeyHSD Message', 1,TRUE)
a<-table.row.end(a)
a<-table.start()
a<-table.row.start(a)
a<-table.element(a,'Must Include Intercept to use Tukey Test ', 1, FALSE)
a<-table.row.end(a)
a<-table.end(a)
table.save(a,file='mytable2.tab')
}
library(car)
lt.lmxdf<-leveneTest(lmxdf)
a<-table.start()
a<-table.row.start(a)
a<-table.element(a,'Levenes Test for Homogeneity of Variance', 4,TRUE)
a<-table.row.end(a)
a<-table.row.start(a)
a<-table.element(a,' ', 1, TRUE)
for (i in 1:3){
a<-table.element(a,names(lt.lmxdf)[i], 1, FALSE)
}
a<-table.row.end(a)
a<-table.row.start(a)
a<-table.element(a,'Group', 1, TRUE)
for (i in 1:3){
a<-table.element(a,round(lt.lmxdf[[i]][1], digits=3), 1, FALSE)
}
a<-table.row.end(a)
a<-table.row.start(a)
a<-table.element(a,' ', 1, TRUE)
a<-table.element(a,lt.lmxdf[[1]][2], 1, FALSE)
a<-table.element(a,' ', 1, FALSE)
a<-table.row.end(a)
a<-table.end(a)
table.save(a,file='mytable3.tab')